Bitcoin Enters HODL Era as Exchange Flows Hit Record Lows - Market Shifts Revealed

Bitcoin investors are digging in for the long haul as exchange withdrawals signal a major behavioral shift.
HODL Mode Activated
Centralized exchange outflows have plummeted to levels not seen since the 2023 bull run, with daily net withdrawals dropping 67% from January peaks. The cooling trend suggests seasoned holders are moving assets to cold storage rather than chasing short-term gains.
Whales Accumulate in Silence
Large wallet addresses have absorbed over 42,000 BTC this quarter while retail trading volume stagnates. This quiet accumulation phase typically precedes major price movements - though traditional finance pundits remain blissfully unaware as they debate whether cryptocurrency is 'still a thing.'
The Great Patience Test
Market analysts observe this HODL pattern mirrors previous cycle bottoms where suppressed volatility eventually erupted into parabolic rallies. With leverage ratios at yearly lows and funding rates neutral, the stage sets for organic growth rather than speculative frenzy.
As Wall Street continues measuring risk in basis points, Bitcoin's silent majority just demonstrated the ultimate investment strategy: actually owning the asset.
Bitcoin Exchange Flows Show Signs of Accumulation
According to Adler, Bitcoin’s current exchange dynamics highlight a significant shift in market behavior. FLOW Activity Pressure now stands at 9, which places it in the lower zone. This reading indicates that overall flow activity is subdued, signaling reduced speculative movements on centralized exchanges. Adler explains that the current average Gross flow (Inflow + Outflow) is 70,000 BTC, a dramatic reduction compared to the 266,000 BTC peak recorded in March 2024. This stark decline reflects a market environment that is quieter and more accumulation-driven, rather than dominated by heavy trading activity.
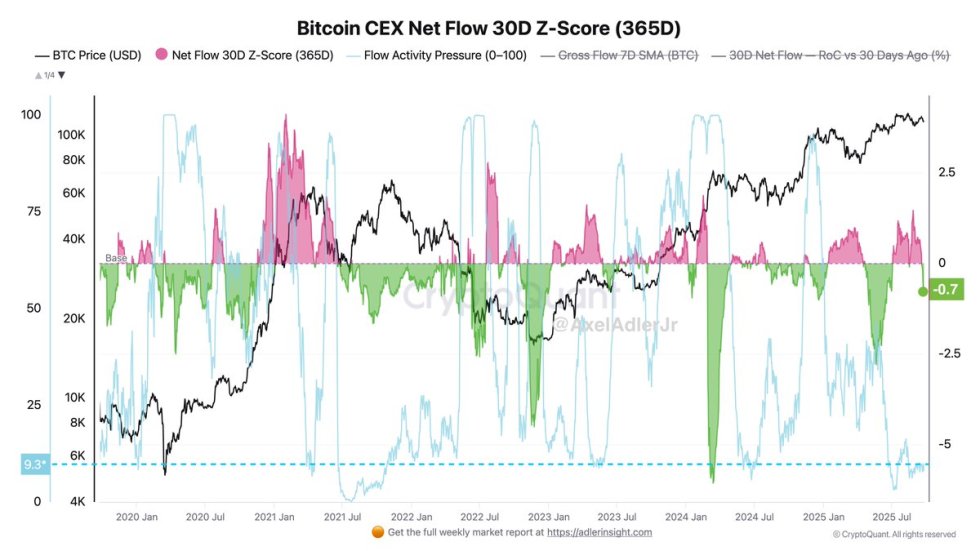
In addition, Adler points to the Net Flow 30D Z-Score of −0.7, which shows a moderate bias toward purchases relative to the annual baseline. This means that the coins entering exchanges are largely being absorbed, with demand effectively consuming the available supply. Adler emphasizes that “everything that comes to exchanges gets bought up,” while reserves continue to be spent to satisfy this steady appetite from buyers.
This type of activity often signals underlying strength in Bitcoin’s structure. While short-term volatility remains a concern, the reduced flow activity and steady absorption of supply hint at an accumulation phase. In the bigger picture, this dynamic supports the thesis that BTC is preparing for continuation once market sentiment shifts back in favor of buyers.
Technical Details: Testing Key Support
Bitcoin (BTC) continues to battle selling pressure, with the price currently hovering around $111,802. The 12-hour chart shows BTC pressing against a critical support zone, just above $111K, which has held multiple times over the past few months. A breakdown below this level could expose the market to deeper corrections toward the psychological $110K mark or even the 200-day moving average NEAR $105K.
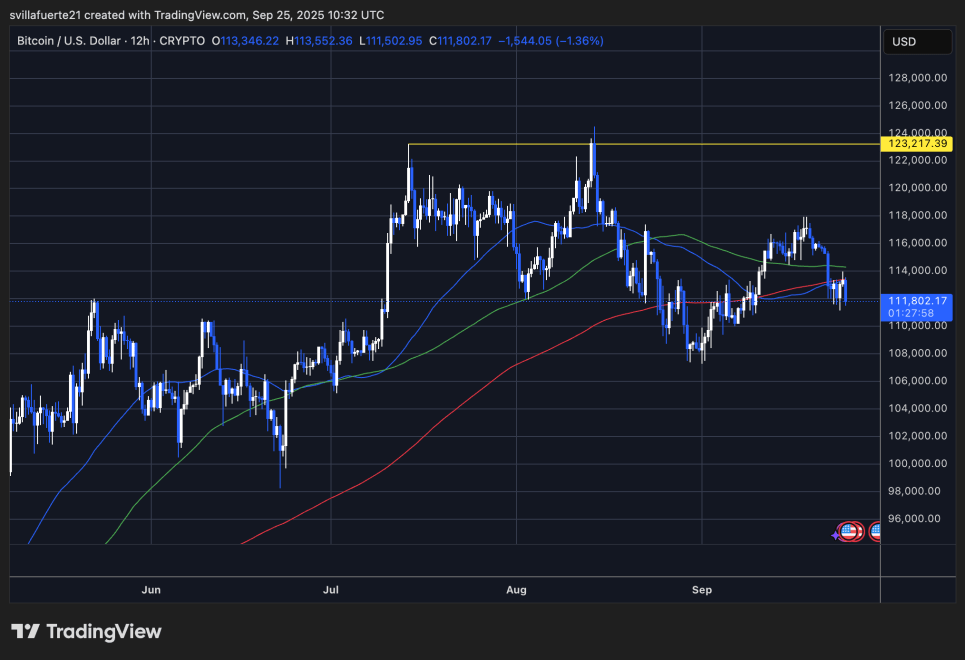
The moving averages are reflecting mixed momentum. The 50-SMA is rolling over, signaling near-term weakness, while the 100-SMA and 200-SMA remain below the current price, still reflecting longer-term bullish structure. For now, this suggests that while bears are pressing hard, bulls have not fully lost control.
On the resistance side, BTC continues to face a ceiling near $118,000, a level it failed to break on multiple attempts over the summer. Only a decisive breakout above this area WOULD confirm renewed bullish momentum.
In the short term, volatility is expected to remain elevated as traders test the durability of this support zone. Holding above $111K would reinforce the bullish case, while a break lower risks shifting sentiment toward a more extended correction.
Featured image from Dall-E, chart from TradingView
