XRP Under Siege: Bears Push Toward 2-Month Low as Technicals Falter

XRP faces mounting pressure as bearish momentum threatens to drag prices to their lowest level in two months.
Technical Breakdown
Chart patterns signal weakening support levels across multiple timeframes. The asset struggles to maintain footing above key psychological barriers.
Market Sentiment Shifts
Traders reposition portfolios amid fading bullish conviction. Volume patterns suggest institutional players remain on sidelines.
Regulatory Overhang Persists
Legal uncertainties continue casting shadows despite recent partial victories. The SEC's lingering presence keeps larger investors cautious.
Broader Crypto Context
While Bitcoin shows resilience, altcoins face disproportionate selling pressure. XRP's correlation with general market weakness exposes its vulnerability.
Remember when 'technical analysis' was just drawing lines and hoping? Some things never change in finance.
XRP Momentum Turns Negative
Readings from the XRP/USD one-day chart indicate that the token’s Moving Average Convergence Divergence (MACD) has formed a bearish crossover, signaling that XRP has entered a renewed downtrend phase.
: Want more token insights like this? Sign up for Editor Harsh Notariya’s Daily crypto Newsletter here.
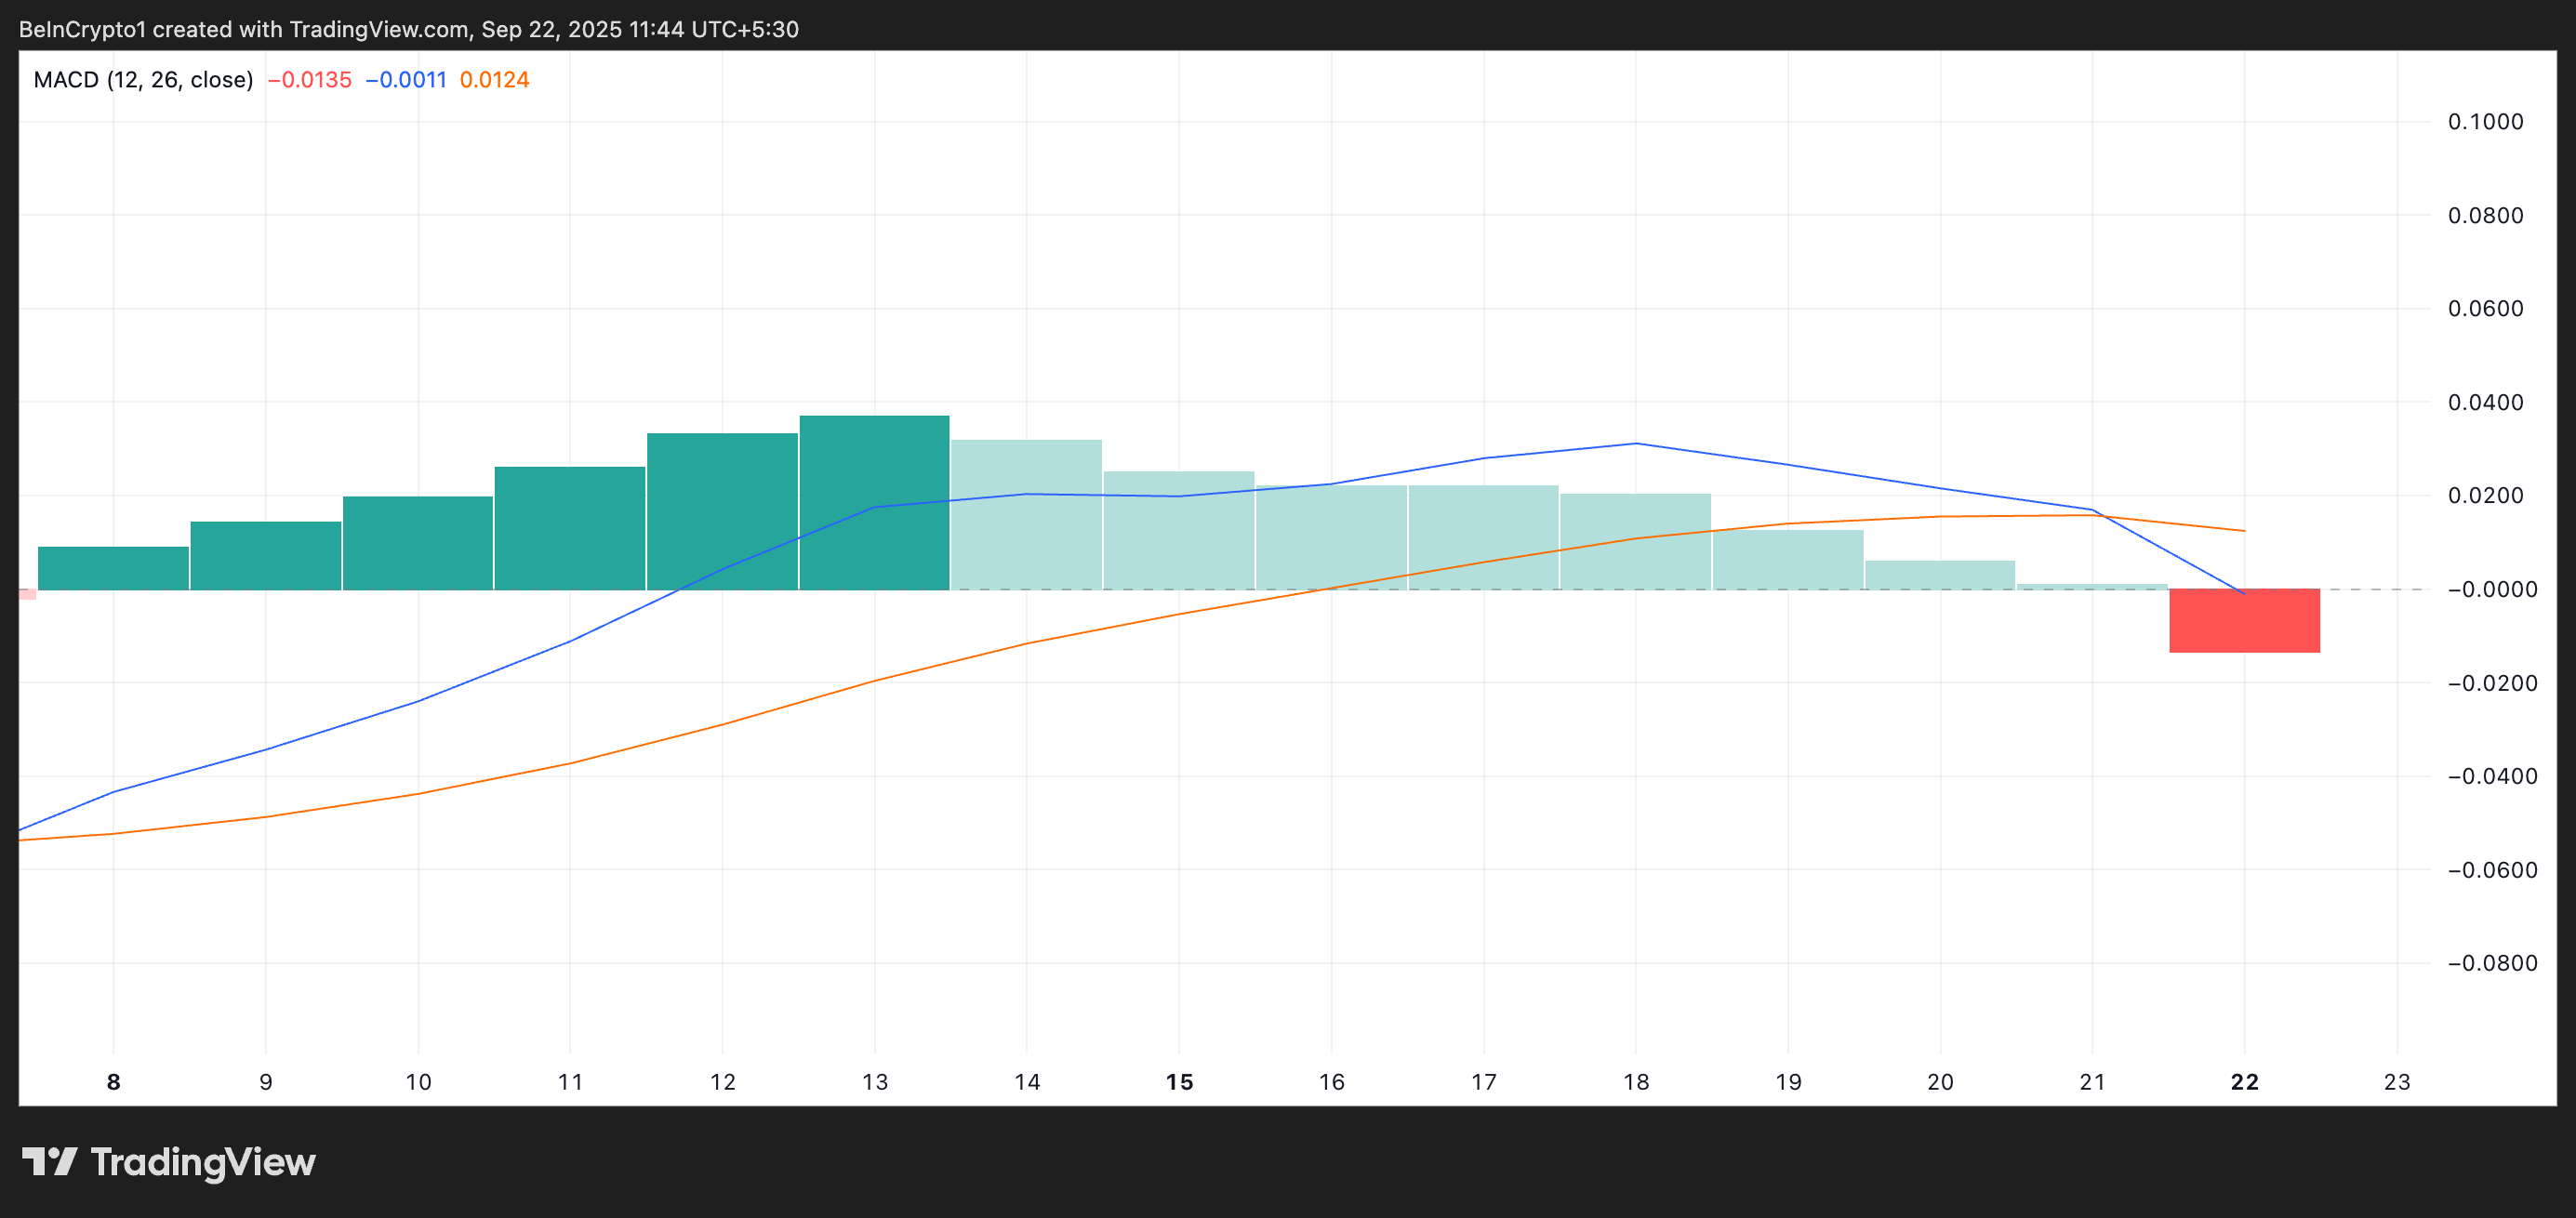
The MACD indicator identifies trends and momentum in its price movement. It helps traders spot potential buy or sell signals through crossovers between the MACD and signal lines.
A bearish crossover occurs when the MACD line crosses below the signal line, suggesting that selling pressure is building and that the asset’s upward momentum is fading.
For XRP, this is the first time the MACD has taken this shape since September 8, highlighting a shift in market sentiment from bullish to bearish.
This could increase the downward pressure on XRP as traders usually interpret the setup as a signal to reduce positions and initiate selling. Furthermore, XRP’s price has plummeted below its 20-day exponential moving average (EMA), confirming the dip in bullish bias towards the altcoin.
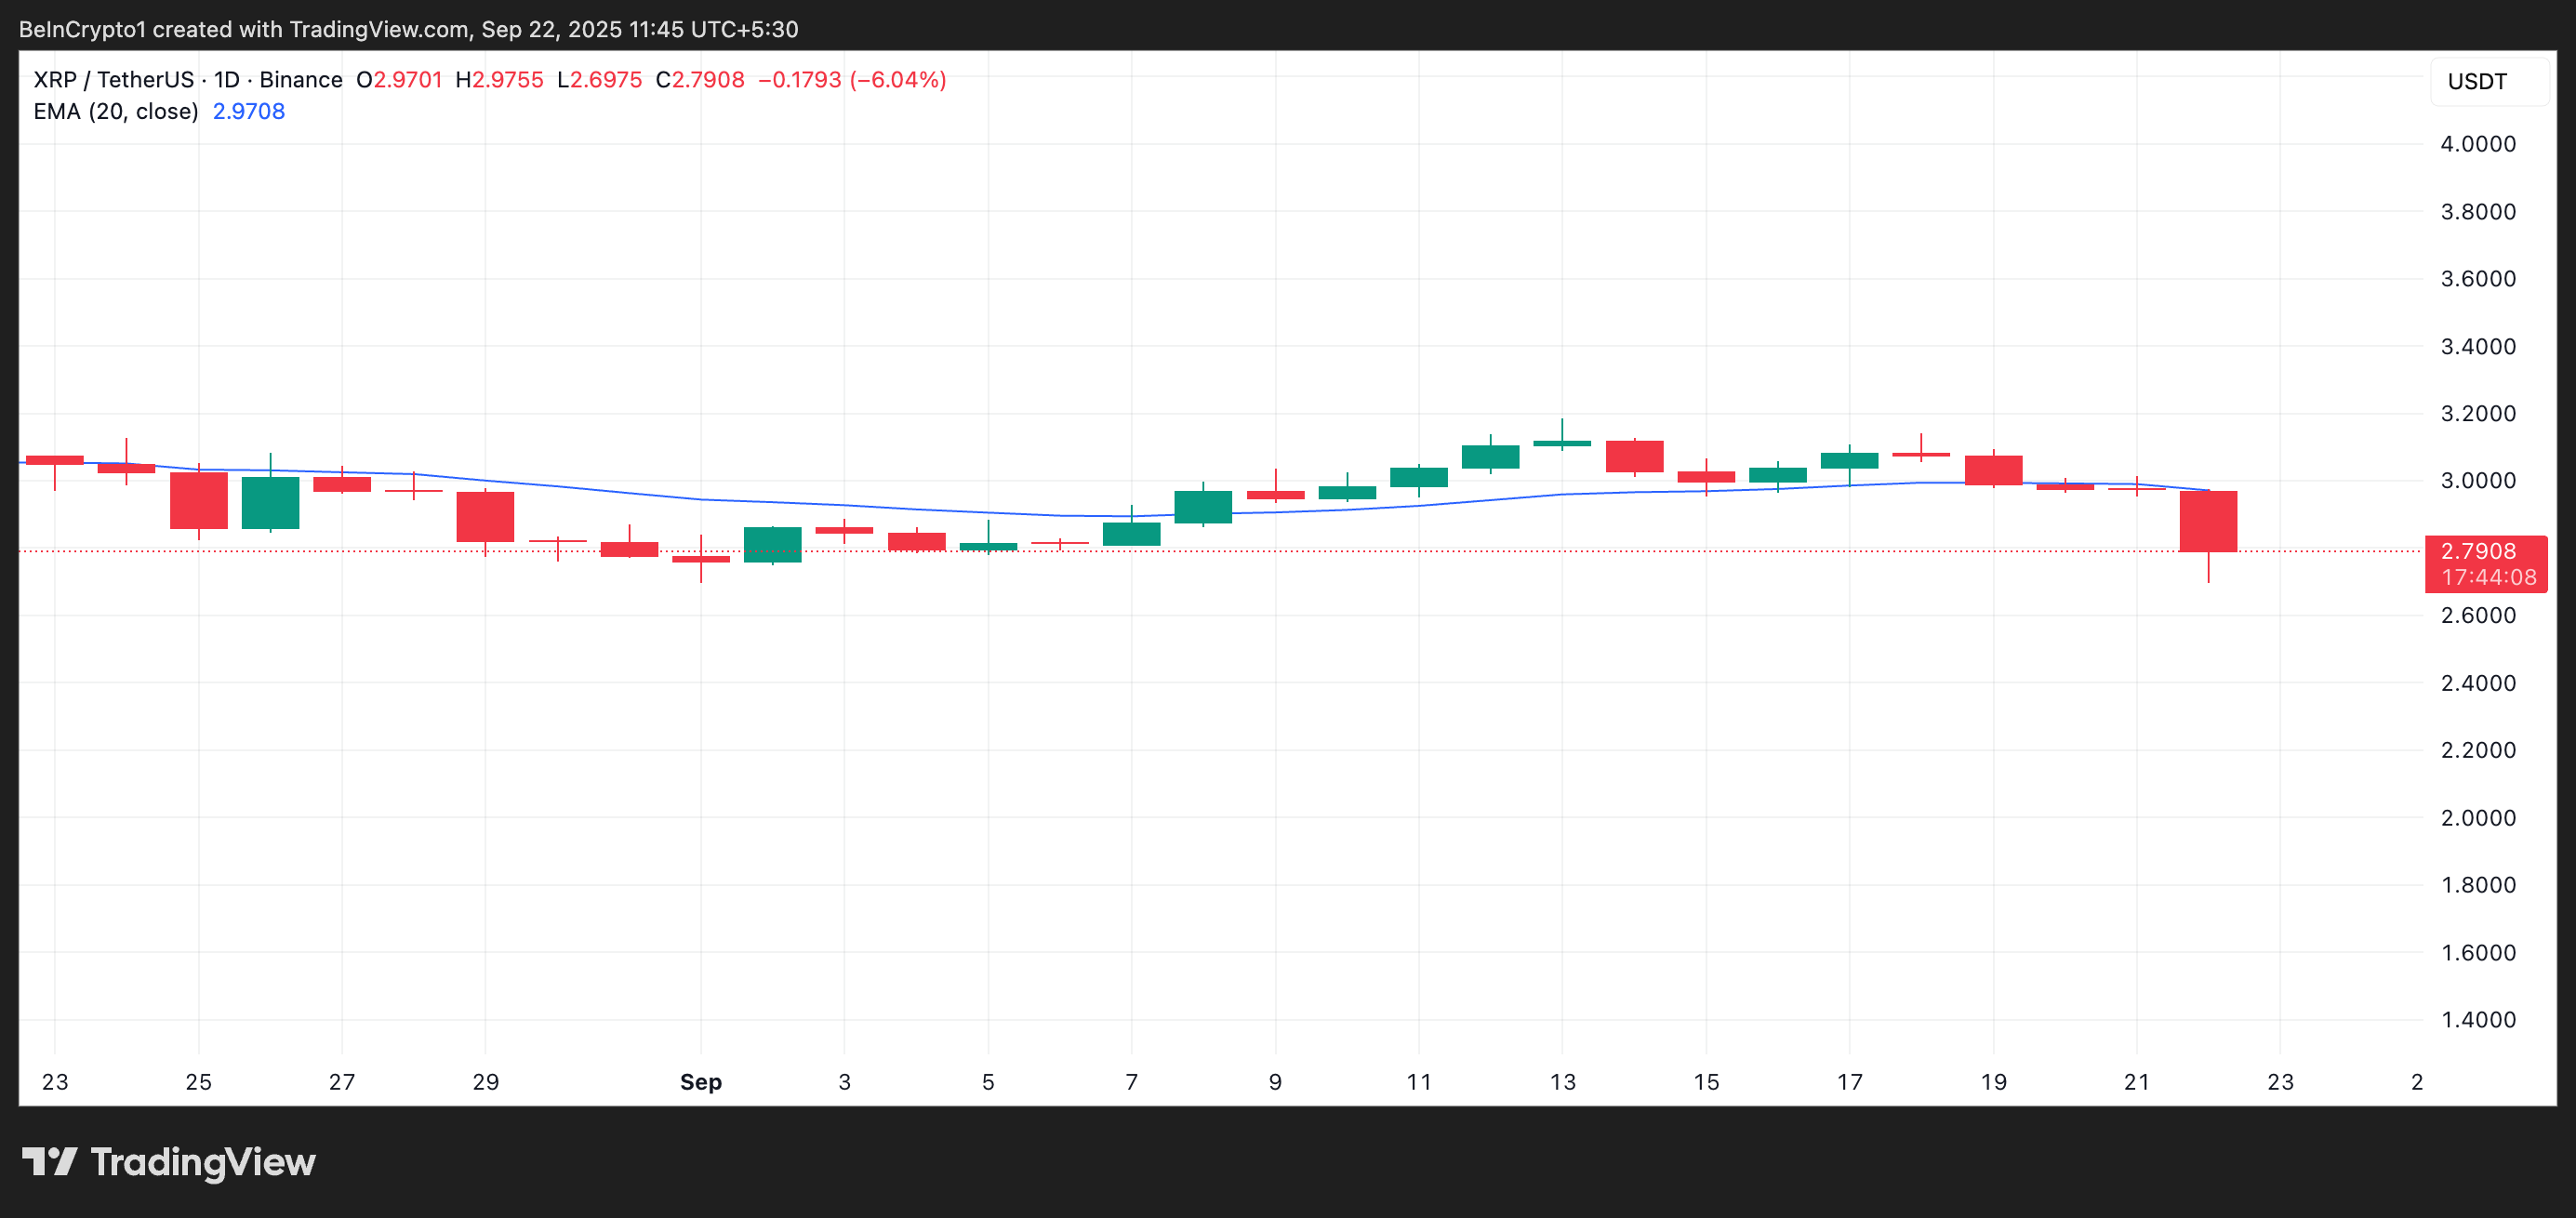
As of this writing, the key moving average forms dynamic resistance above XRP’s price at $2.97, keeping its performance muted.
The 20-day EMA measures the asset’s average price over the past 20 trading days, weighing recent price changes more heavily.
When the price falls below the EMA, it signals that short-term selling pressure is increasing and that bearish momentum may be building. This puts XRP at risk of extending its decline over the next few trading sessions.
XRP Bears Eye $2.39 While Bulls Target $2.87 Rebound
For XRP’s near-term price outlook, its next direction depends on whether bulls can defend the support floor at $2.63. If selloffs worsen and the price level fails to hold, XRP’s price could fall to $2.39, a low it last reached in July.
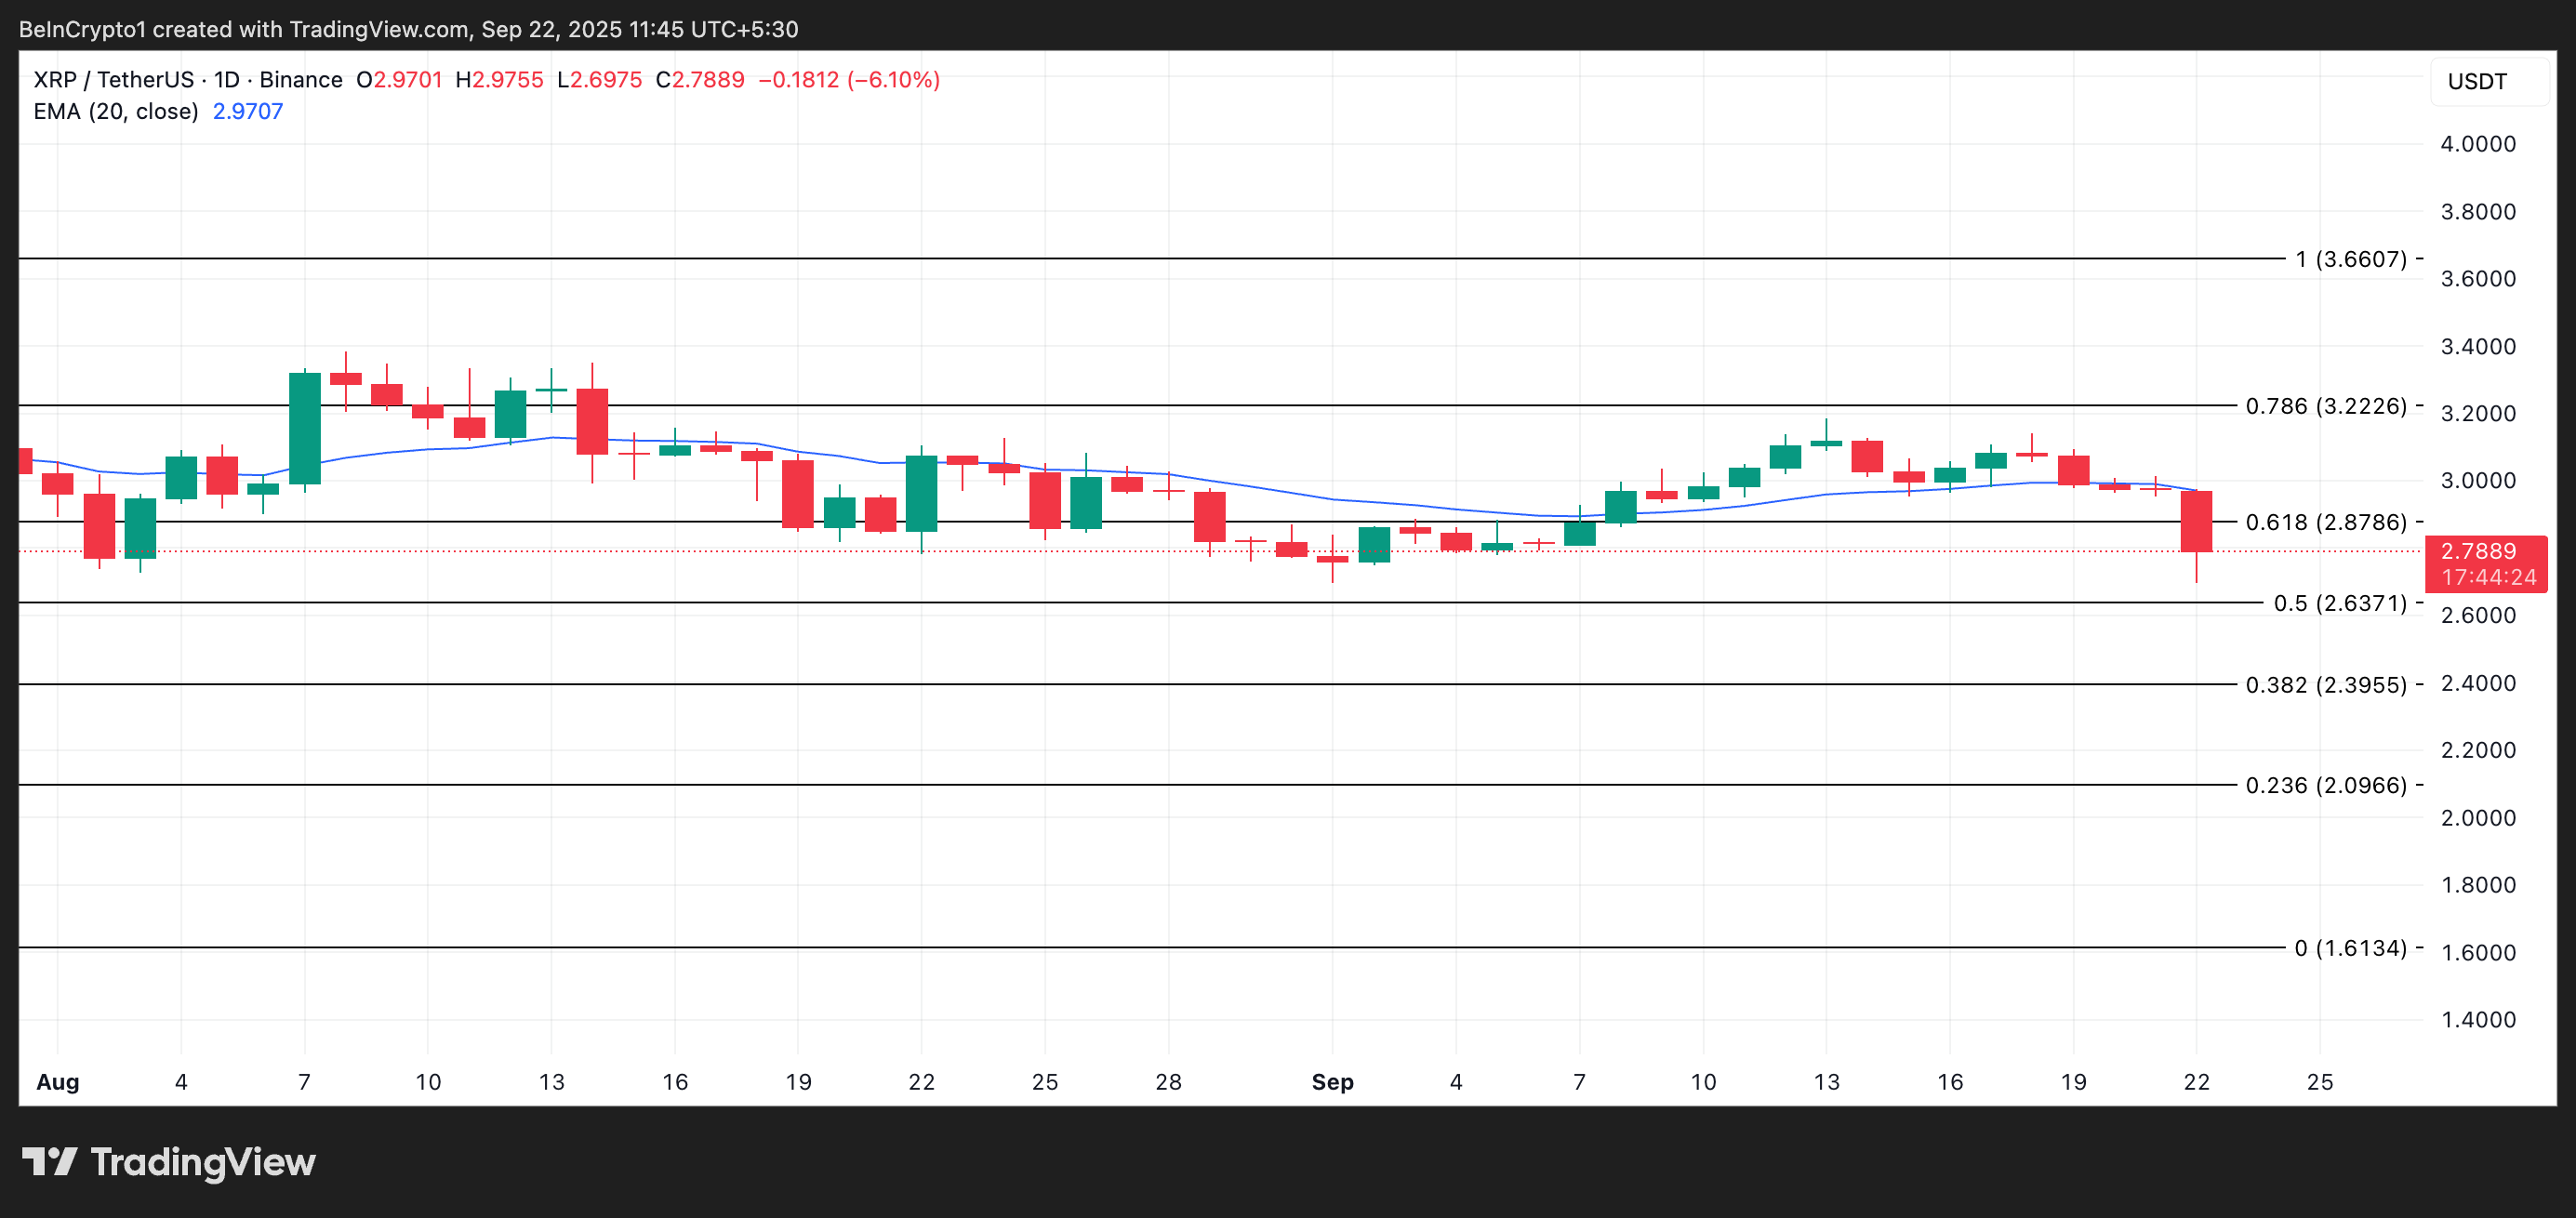
On the other hand, if buyer confidence strengthens and accumulation grows, the token’s value could rebound toward $2.87. A successful breach of this barrier could open the door for a rally above the token’s 20-day EMA and a push for $3.22.
