Bitcoin Shows 3 Critical Exhaustion Signals as September Nears Its Close

Bitcoin's relentless rally hits potential turbulence with three distinct warning flashes emerging in the final stretch of September.
Key Pressure Points
Watch for weakening momentum indicators, declining trading volumes, and failed breakout attempts above key resistance levels—classic signs that even the king of crypto might need a breather.
Market participants are hedging bets as institutional inflows slow and retail enthusiasm shows early fatigue. Still, long-term holders aren't blinking—yet.
Because in crypto, a 20% pullback is just another Tuesday—and Wall Street still doesn't get that volatility isn't a bug, it's a feature.
3 Warning Signals for Bitcoin Price in the Final Week of September
Historical data shows that September carries a “curse” lasting over a decade. It has consistently been the weakest month of the year. With just over a week left, this pattern threatens to repeat as negative signals build.
On-Chain Signal: SOPR Indicates Profitability Is Drying Up
Analyst Joao Wedson, founder of Alphractal, highlighted that the Spent Output Profit Ratio (SOPR) Trend Signal is flashing bearish.
SOPR measures whether Bitcoin transactions on-chain are profitable or losing. A reading above 1 means sellers are in profit (selling BTC above their purchase price). A reading below 1 means sellers are at a loss (selling below cost).
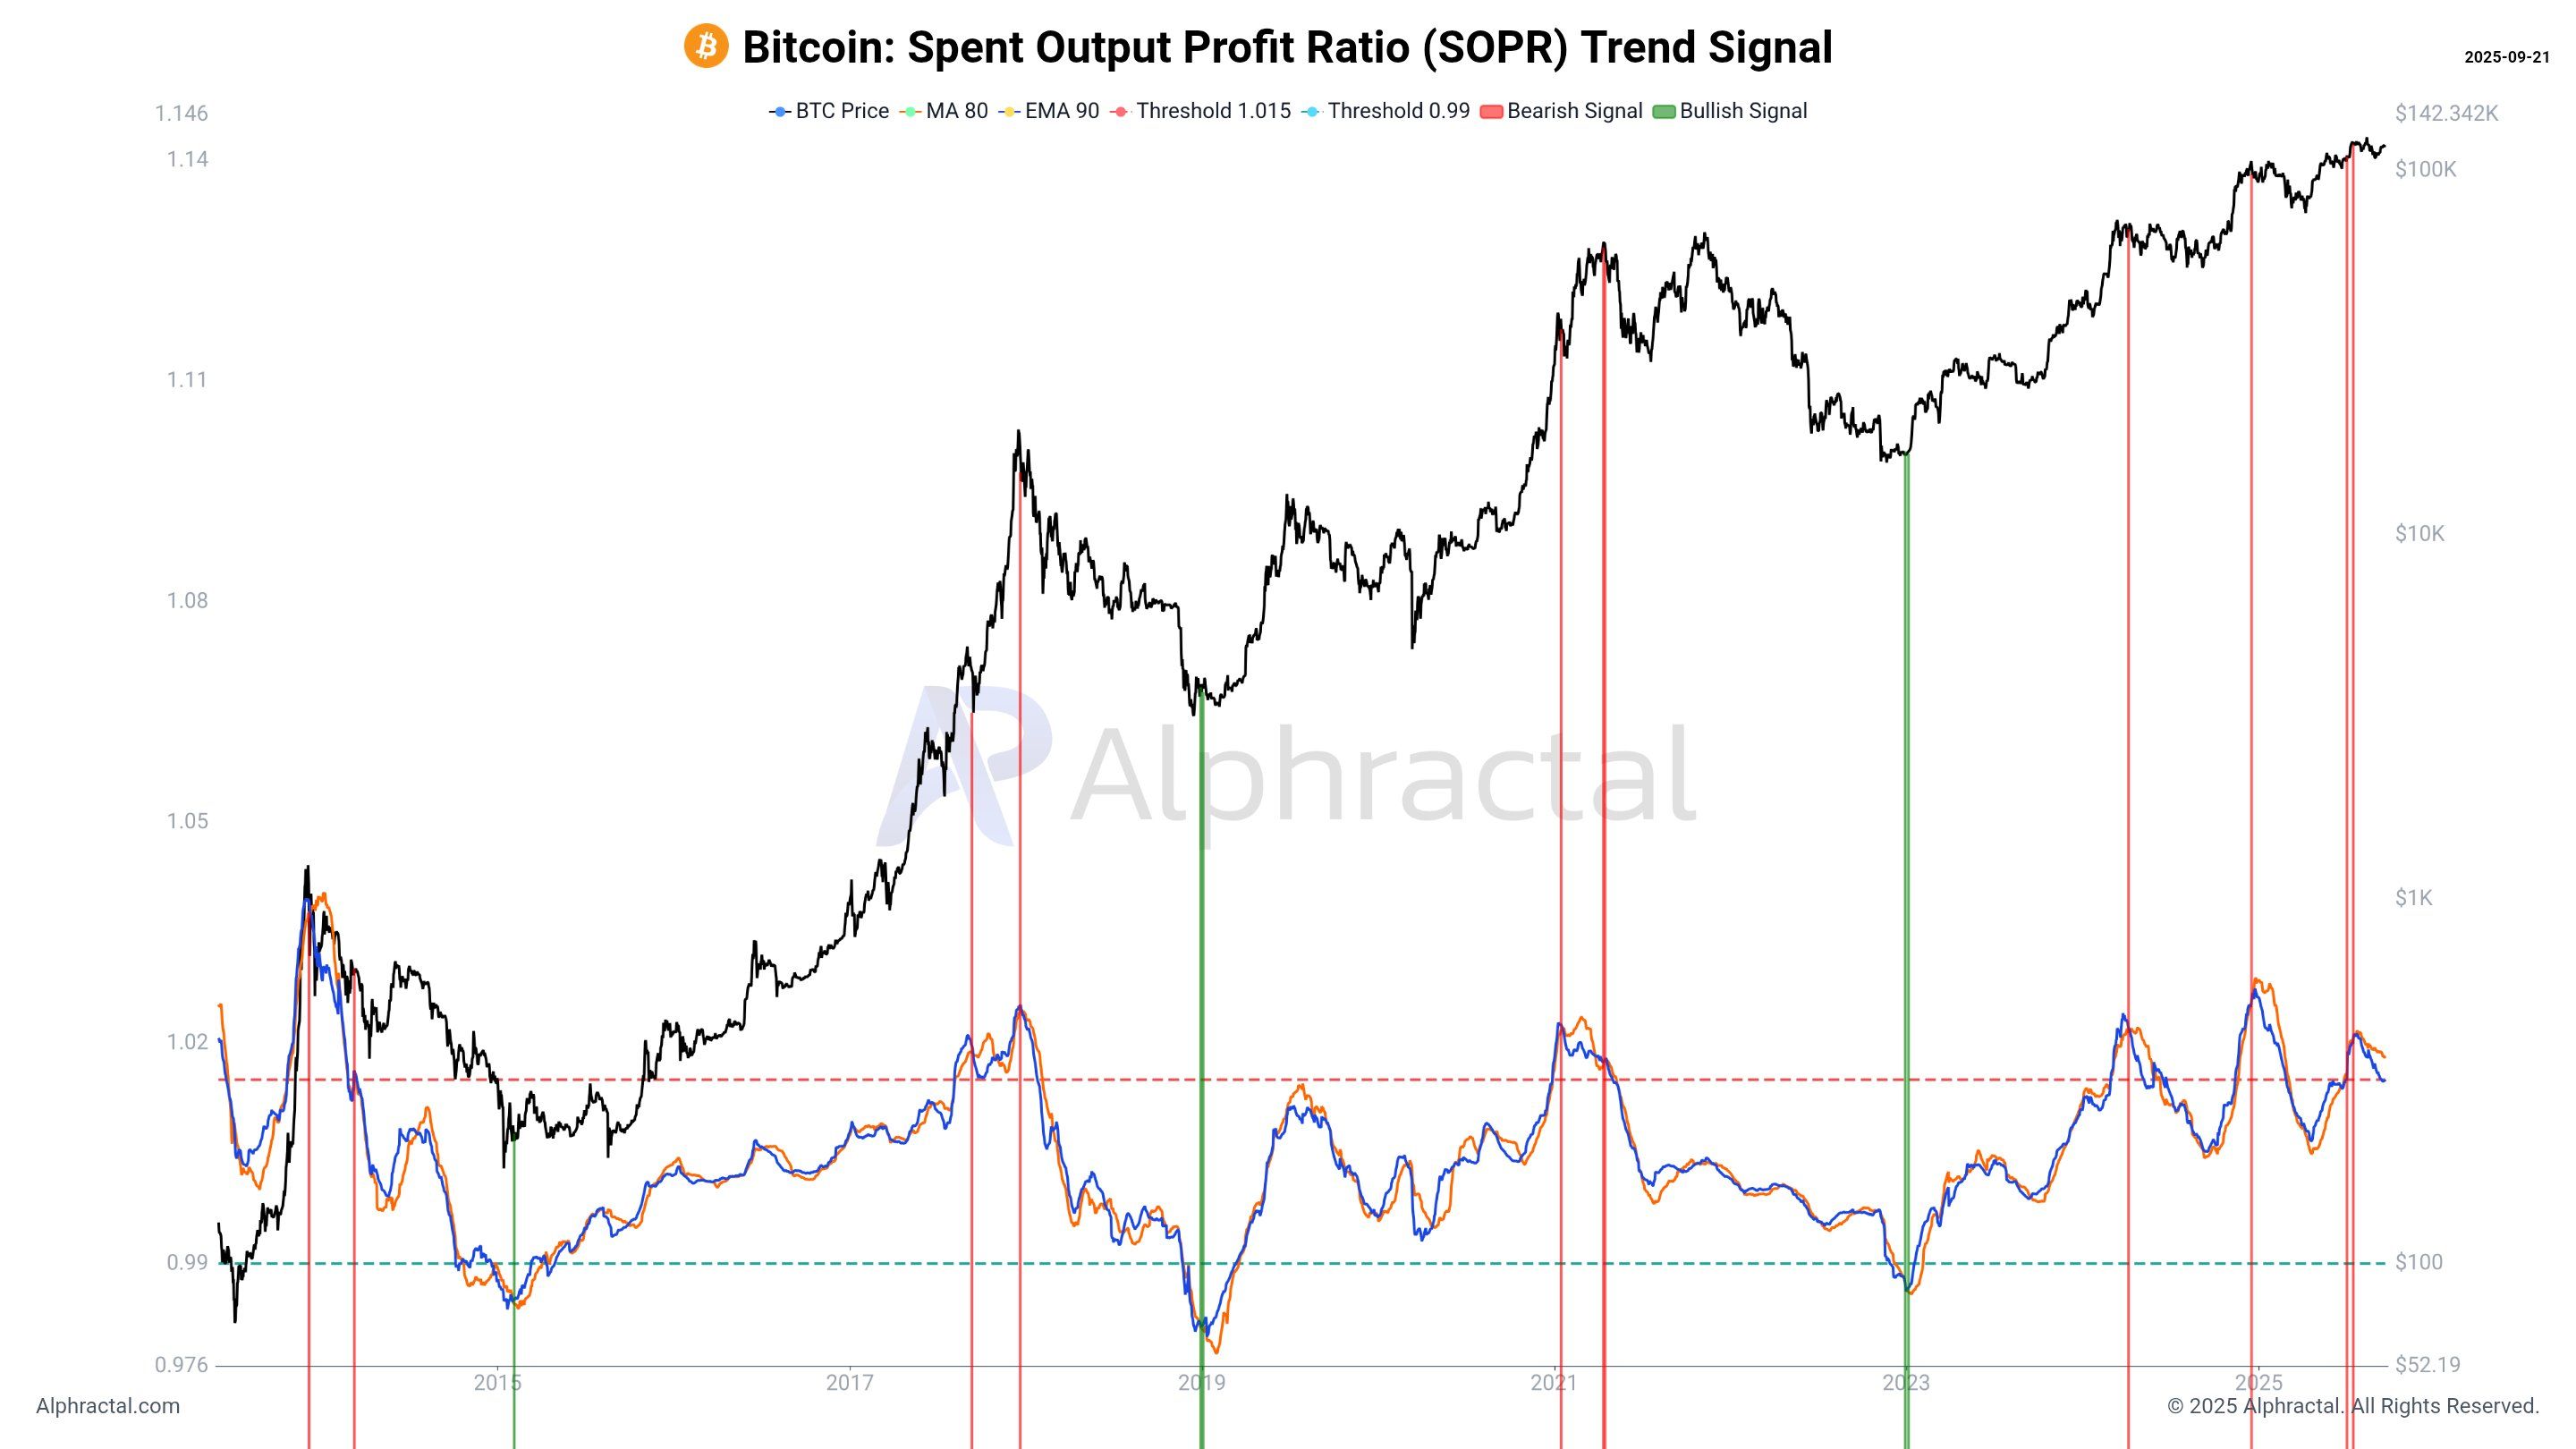
Currently, SOPR remains above 1 but is trending downward. This suggests that profitability from on-chain transactions is fading.
Historically, red zones on the chart mark bitcoin peaks, as shown across multiple past cycles. Wedson explained that investors tend to accumulate BTC too late and at excessively high prices during such times.
“The SOPR Trend Signal is excellent at signaling when blockchain profitability is drying up. Never in Bitcoin’s history have investors accumulated BTC so late and at such high prices,” Joao Wedson said.
Wedson also pointed out that short-term holders’ (STH) realized price is $111,400, which is close to the current market level. Any drop below this threshold could trigger stop-loss selling. Alarmingly, BTC already fell below this level in the final week of September.
Additionally, despite Bitcoin’s higher price than previous cycles, the Sharpe ratio is weaker. This means risk-adjusted returns are lower, and so is profit potential.
Exchange Signal: Taker Buy/Sell Ratio Drops Sharply, Selling Pressure Dominates
CryptoQuant data shows the taker buy/sell ratio across all exchanges has fallen below 1 in recent weeks. The 30-day simple moving average (SMA30) also follows this downward trend.
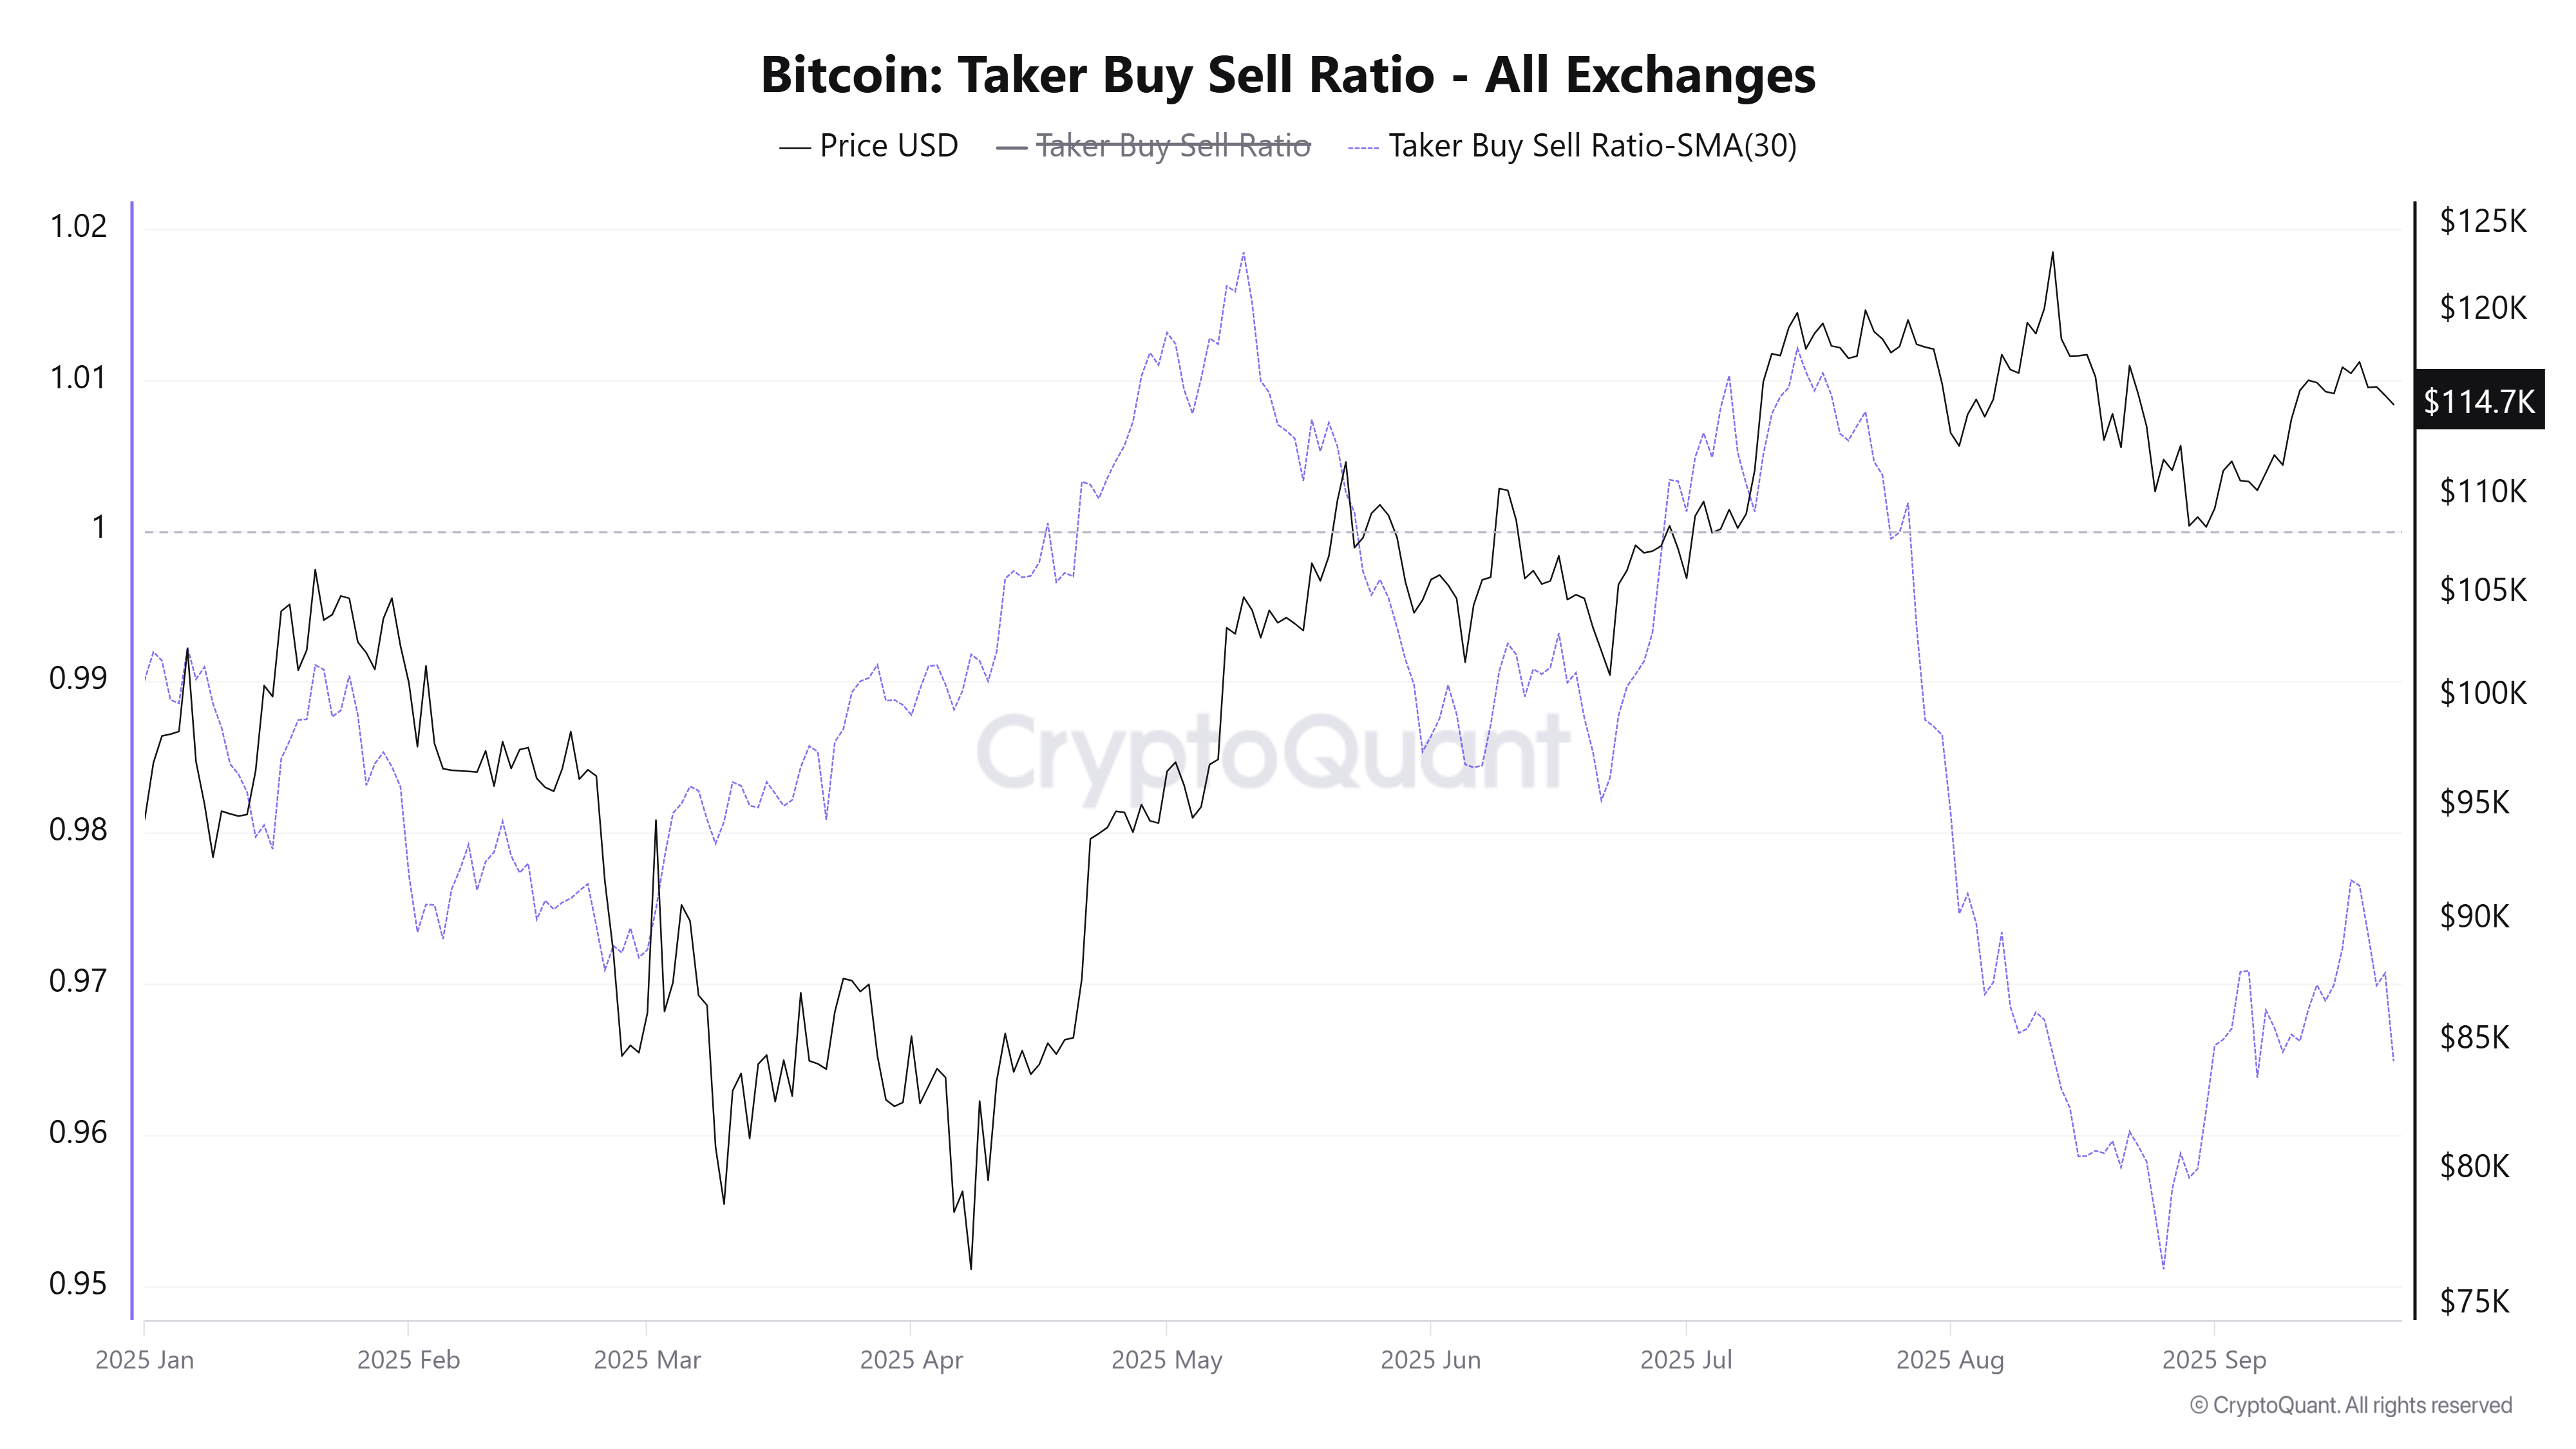
This indicates that active selling volume (taker sell) now outpaces buying, reflecting negative trader sentiment. Historically, when this ratio remains under 1, Bitcoin often faces downward pressure, especially when prices are already NEAR record highs.
This is a clear sign that bullish momentum is weakening. Without new capital inflows, the final week of September could see a reversal.
Macro Signal from DXY
Since the Federal Reserve’s recent rate cut, the US Dollar Index (DXY) has rebounded. It climbed from 96.2 points to 97.8 points.
Some analysts warn that the inverse correlation between DXY and BTC may return, posing downside risks to Bitcoin’s price.
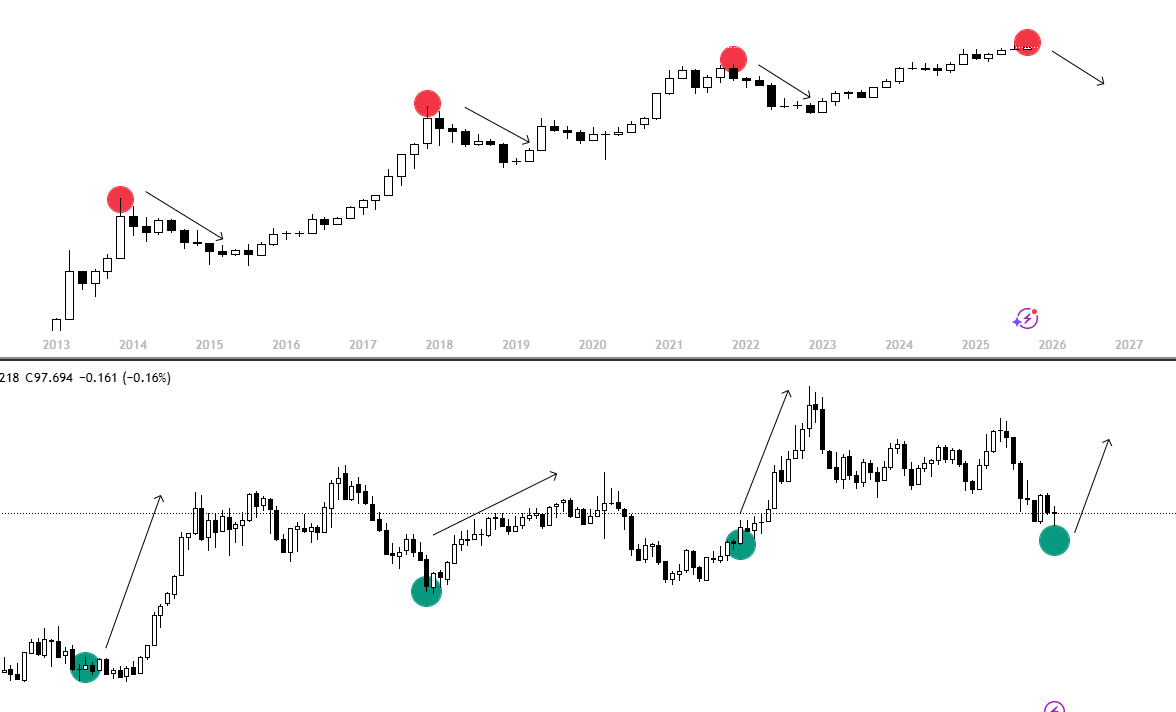
Analyst Killa outlined a broader scenario: if DXY continues to recover, Bitcoin may reverse—just as it did in 2014, 2018, and 2021.
These three signals—on-chain, exchange-based, and macro—reinforce Bitcoin’s September curse. If history repeats, the final days of the month could confirm it.
