ASTER’s Next Big Move Hinges on One Critical Level and October’s Game-Changing Unlock

ASTER stands at a make-or-break moment—all eyes on that crucial resistance level and an October unlock that could shake the entire ecosystem.
The Key Level: Everything Hangs in the Balance
Break through, and ASTER rockets toward new highs. Fail, and it's back to consolidation—traders are watching this line like hawks.
October Unlock: Catalyst or Catastrophe?
Massive token releases often trigger volatility—some call it 'planned dilution,' others see opportunity. Either way, it's gonna move markets.
Timing is Everything in Crypto's Casino
Smart money's positioning now—because in this game, you're either early or you're left holding the bag after the 'financial innovation' parade has passed.
Money Flows and Momentum Hint at Weakening Sell Pressure
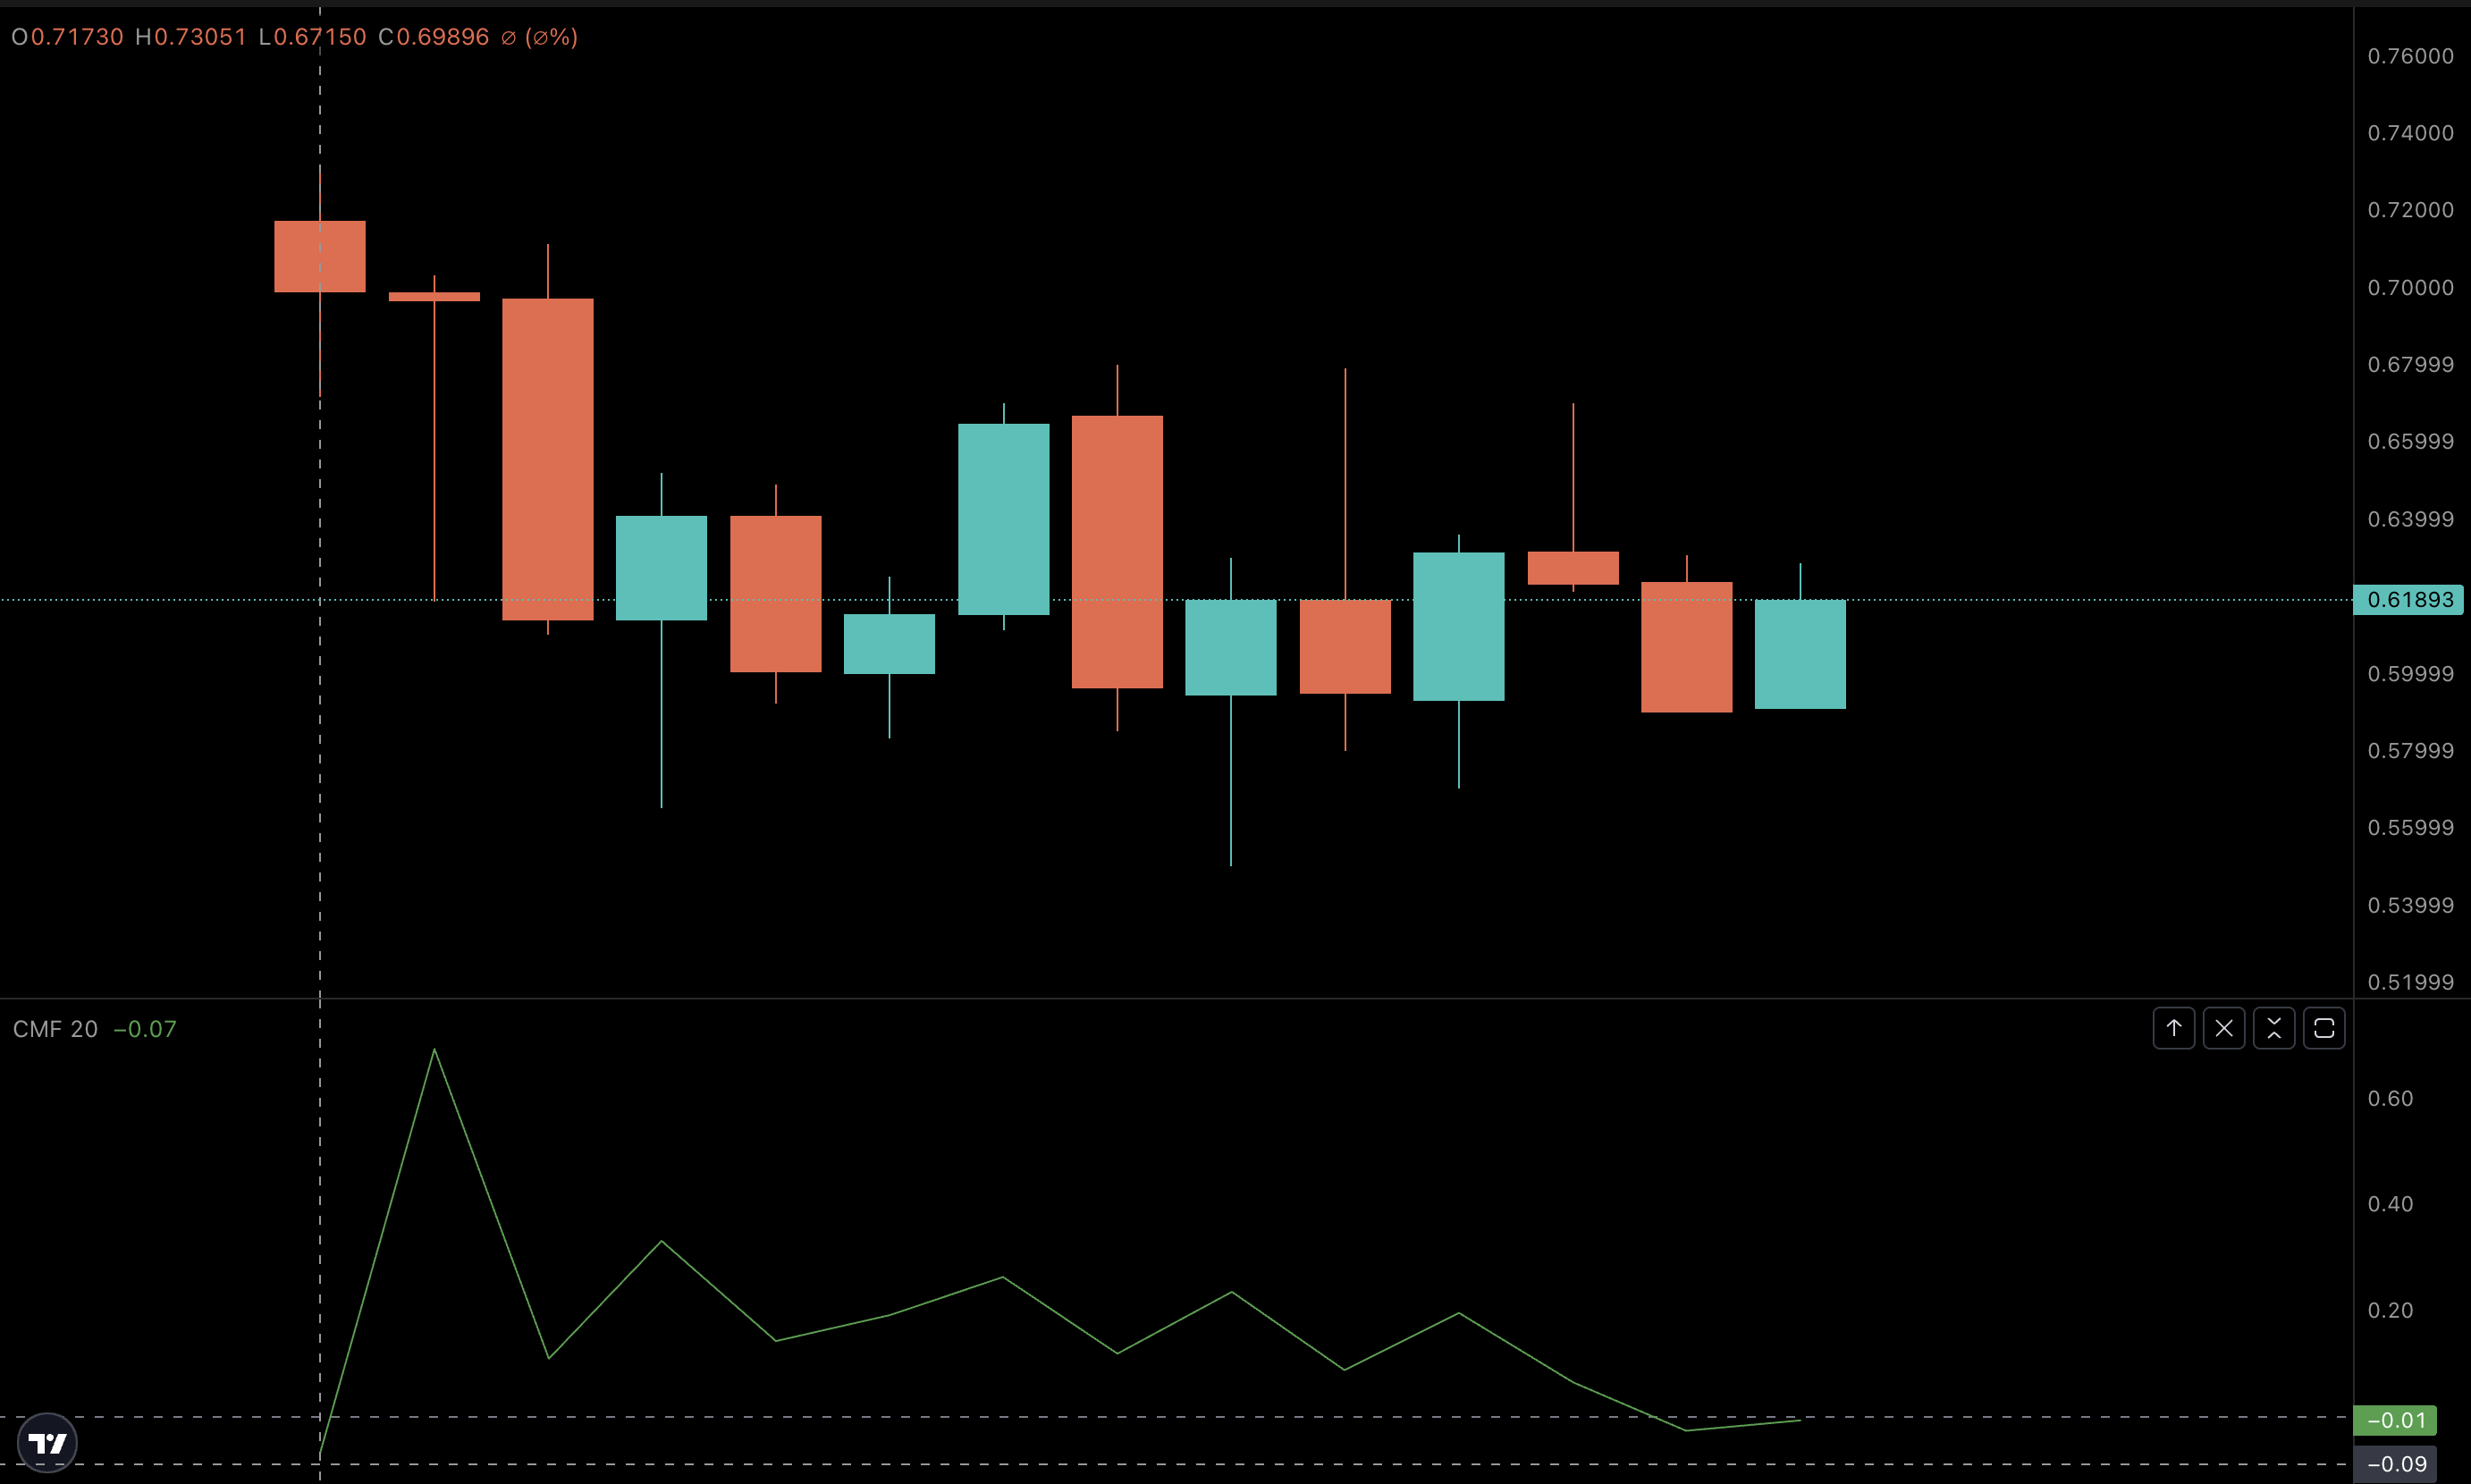
Since ASTER began trading on September 17, Chaikin Money FLOW (CMF) has steadily dropped, showing that large money flows were exiting the ASTER market. This aligns with the first wave of airdrop claimants likely swapping or selling their initial allocations.
But in the last hour, CMF has begun moving higher, suggesting that the pace of outflows is slowing. The ASTER price can see some more strength if the hourly CMF index manages to MOVE into the positive territory,
Sign up for Editor Harsh Notariya’s Daily crypto Newsletter here.
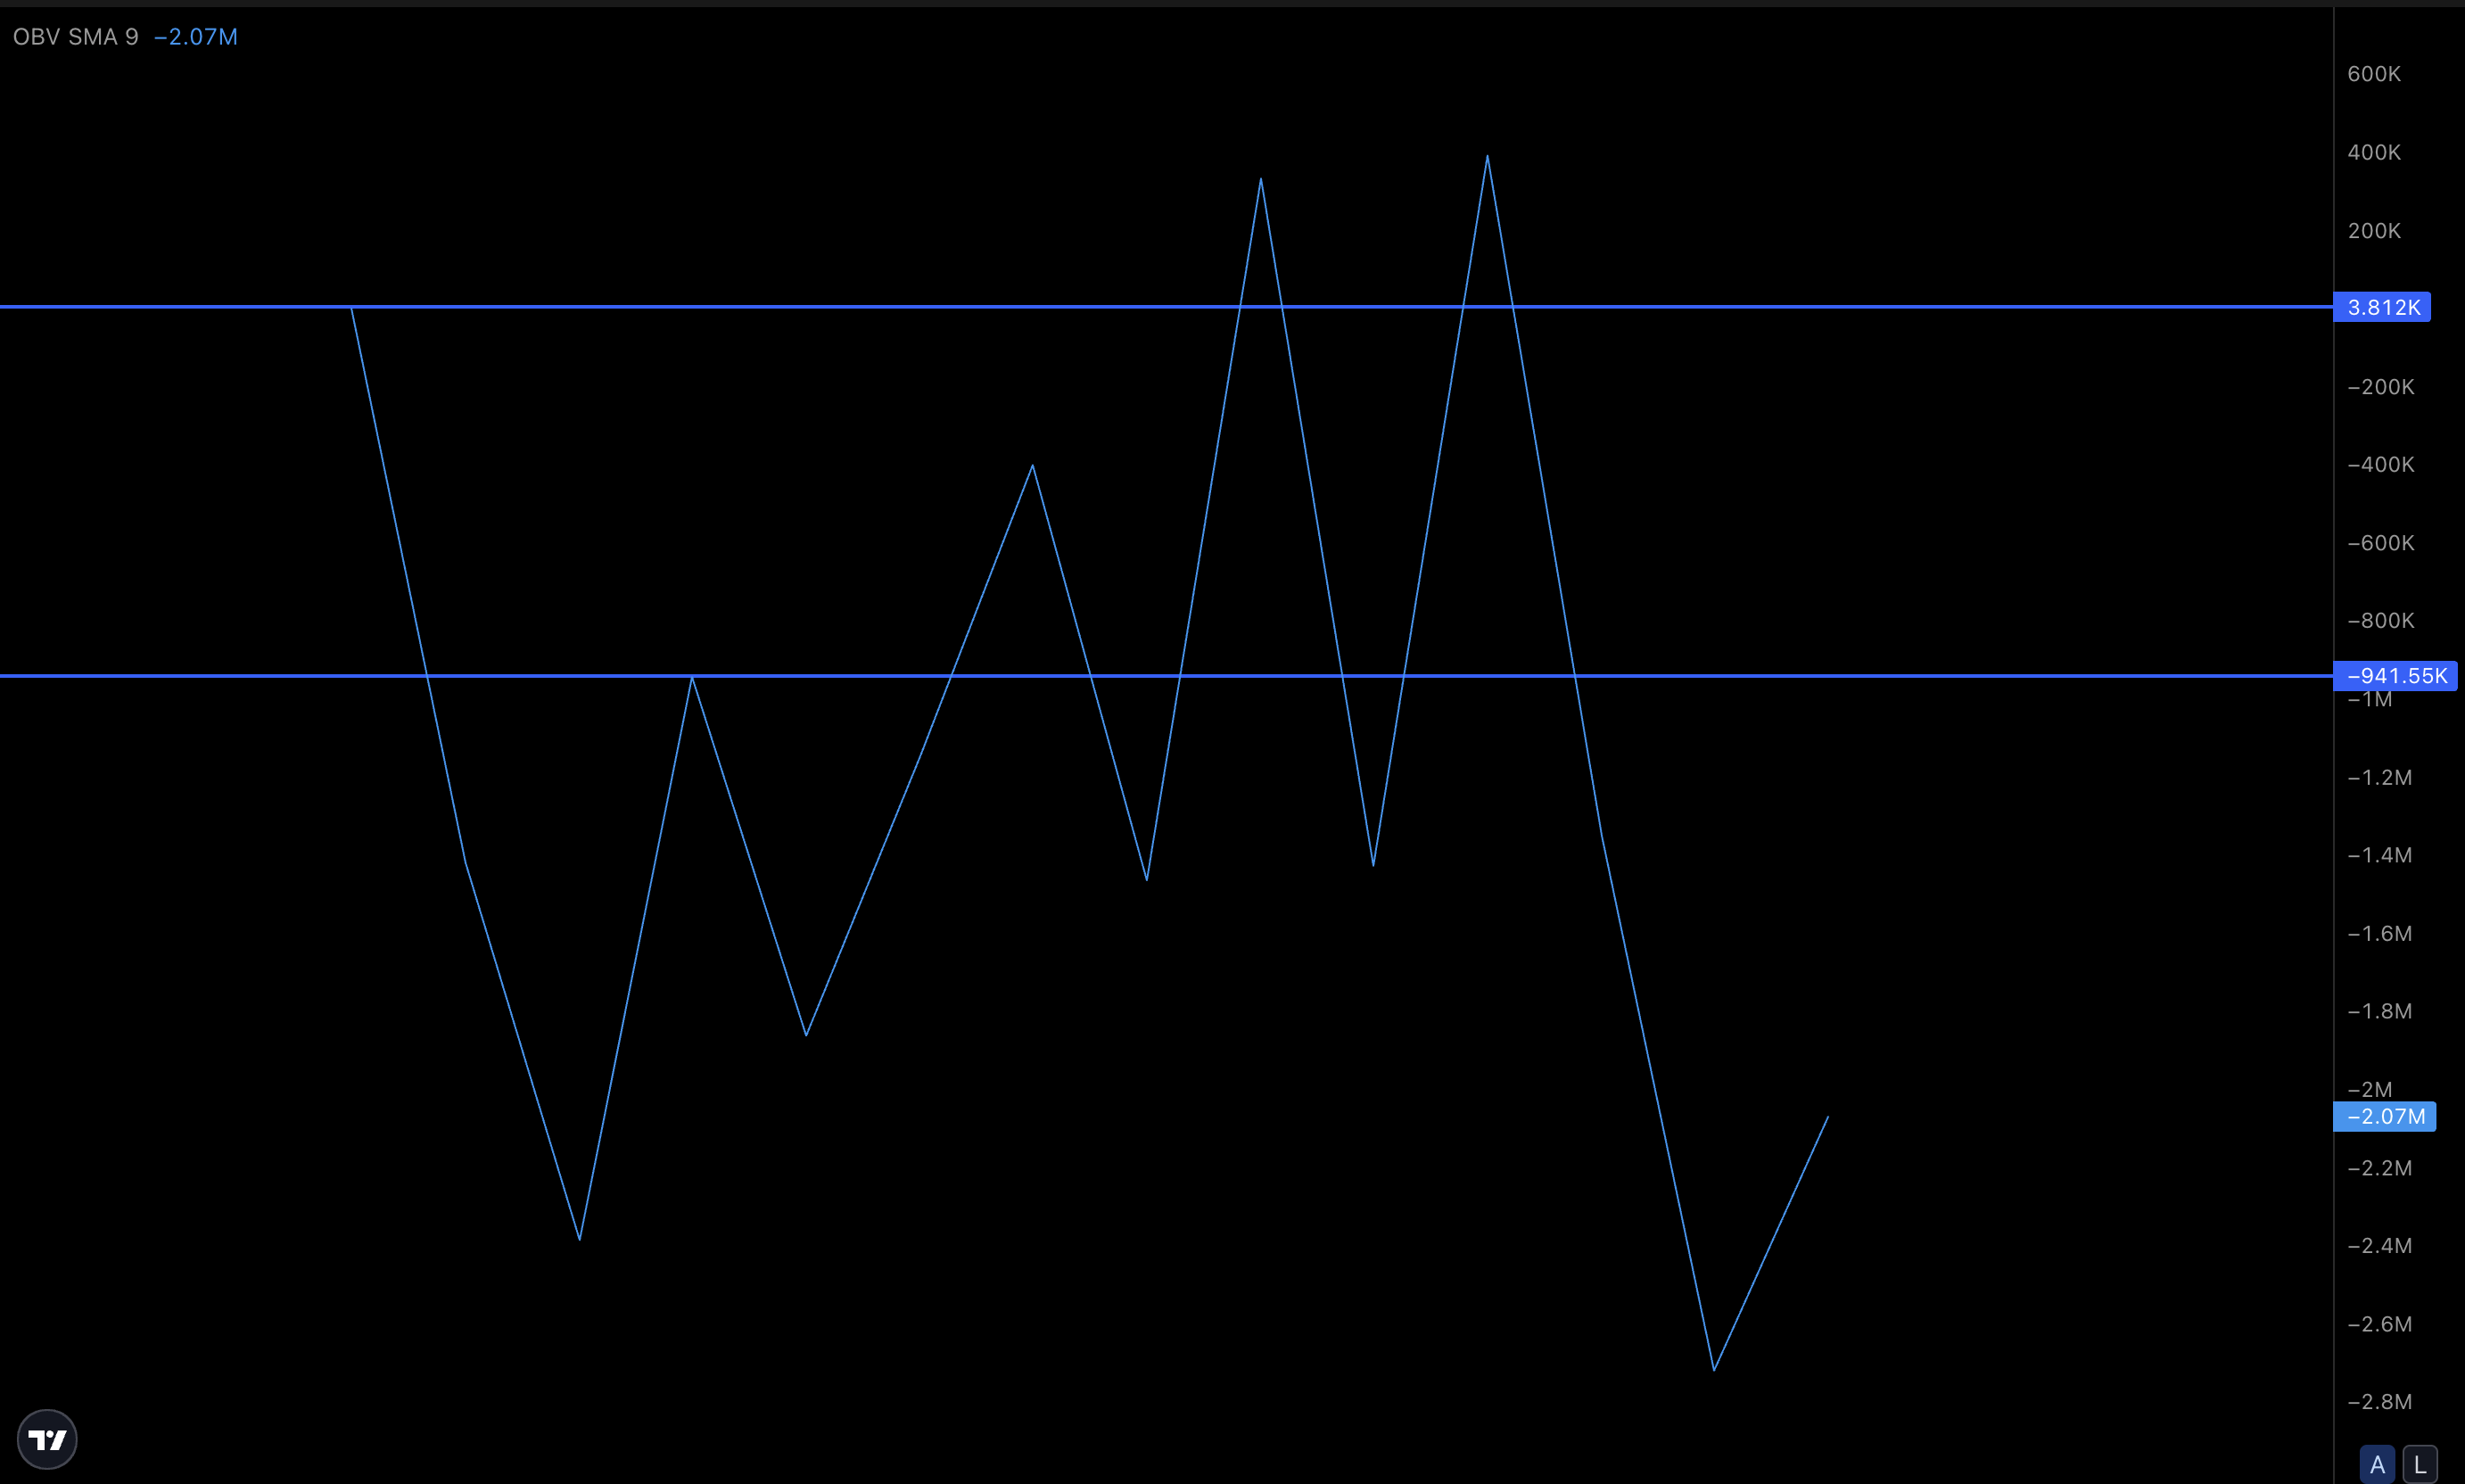
The On-Balance Volume (OBV) line, which tracks cumulative buying and selling, shows a similar zigzag. It fell heavily after launch but is now trying to turn upward again. If OBV can break back toward neutral, it WOULD confirm that buyers are gradually absorbing the selling pressure on AsterDEX.
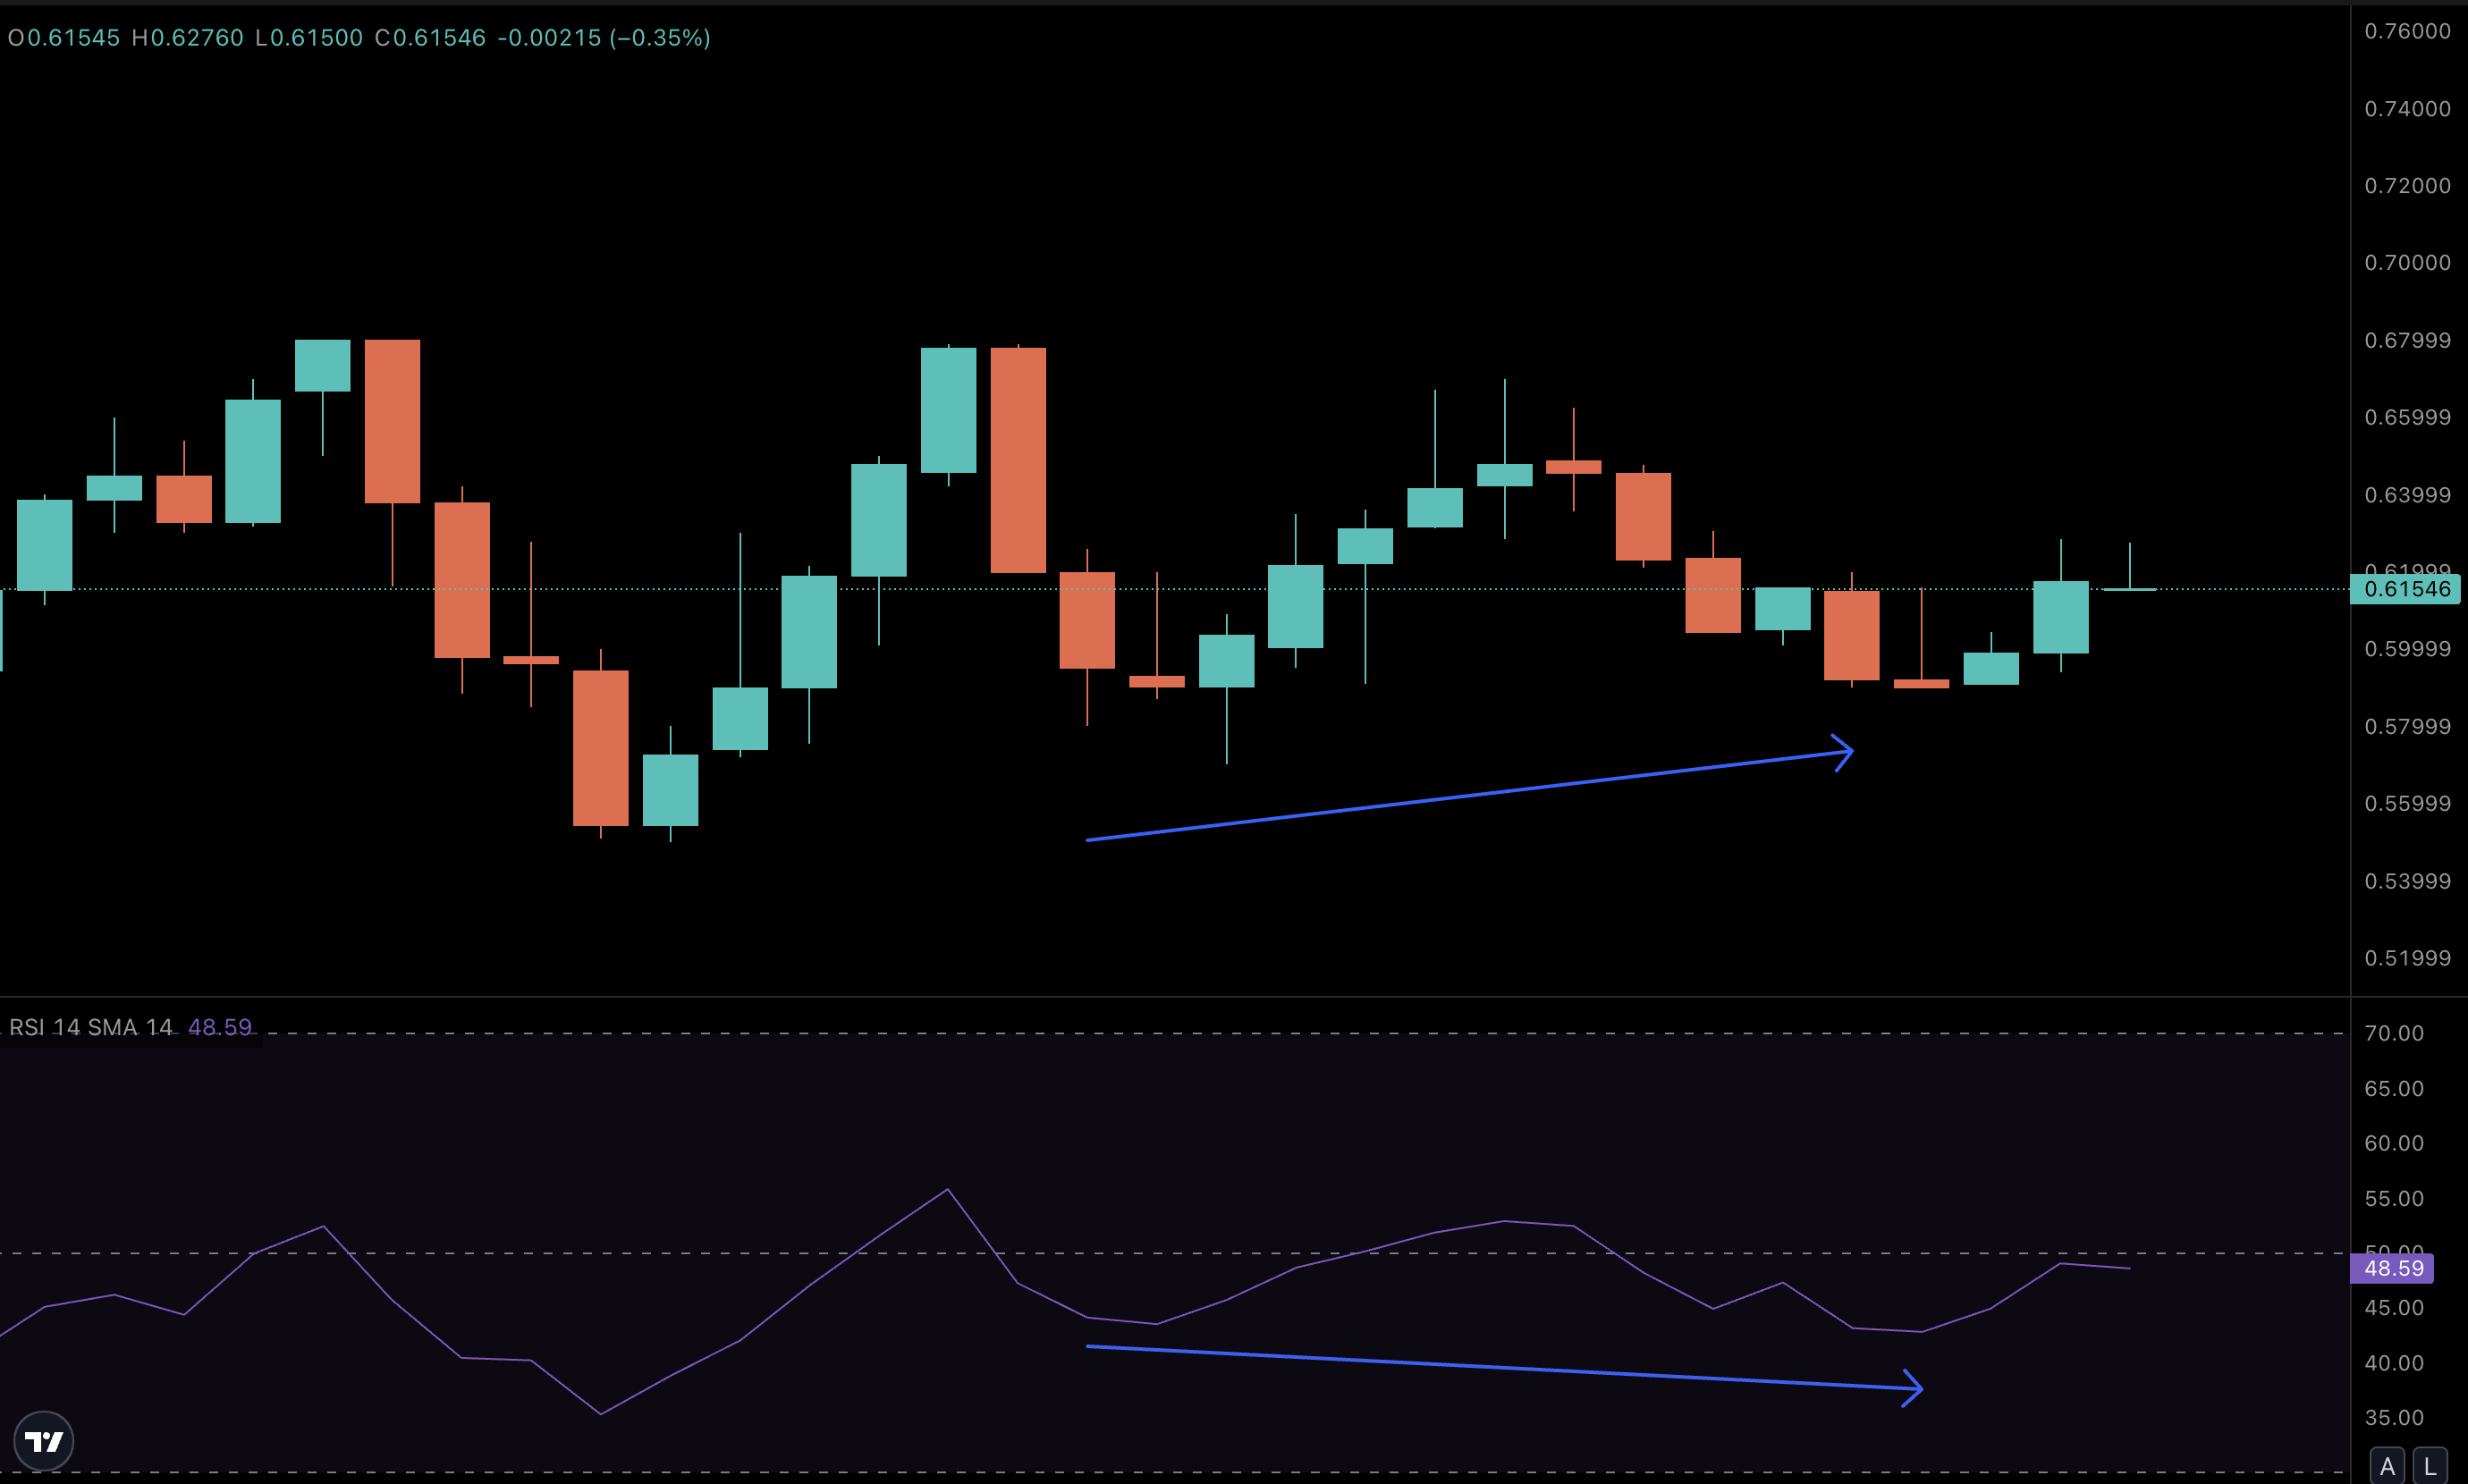
On the shorter 15-minute chart, RSI also points to easing pressure. Between a few key ASTER trading sessions, the price made higher lows while the RSI slipped to lower lows — a hidden bullish divergence. This is often an early sign that momentum is shifting back toward buyers.
All of these metrics suggest the same story: selling pressure is weakening, even while the market waits for the October 1 unlock. Once withdrawals are live, more holders will be free to sell, but it will also mean ASTER becomes accessible on major exchanges. That expansion of liquidity could either unleash broader selling or let buyers step in more aggressively.
RSI (Relative Strength Index) is a momentum indicator that tracks whether buying or selling pressure is stronger.
Users can claim ASTER in their Spot/DEX account from the listing, but withdrawals will remain locked until October 1, which means tokens must stay inside the platform (though trading is allowed). After October 1, more holders will be able to move their tokens off the platform, which could increase both selling pressure and liquidity.
$0.73 is the Key ASTER Price Level to Watch
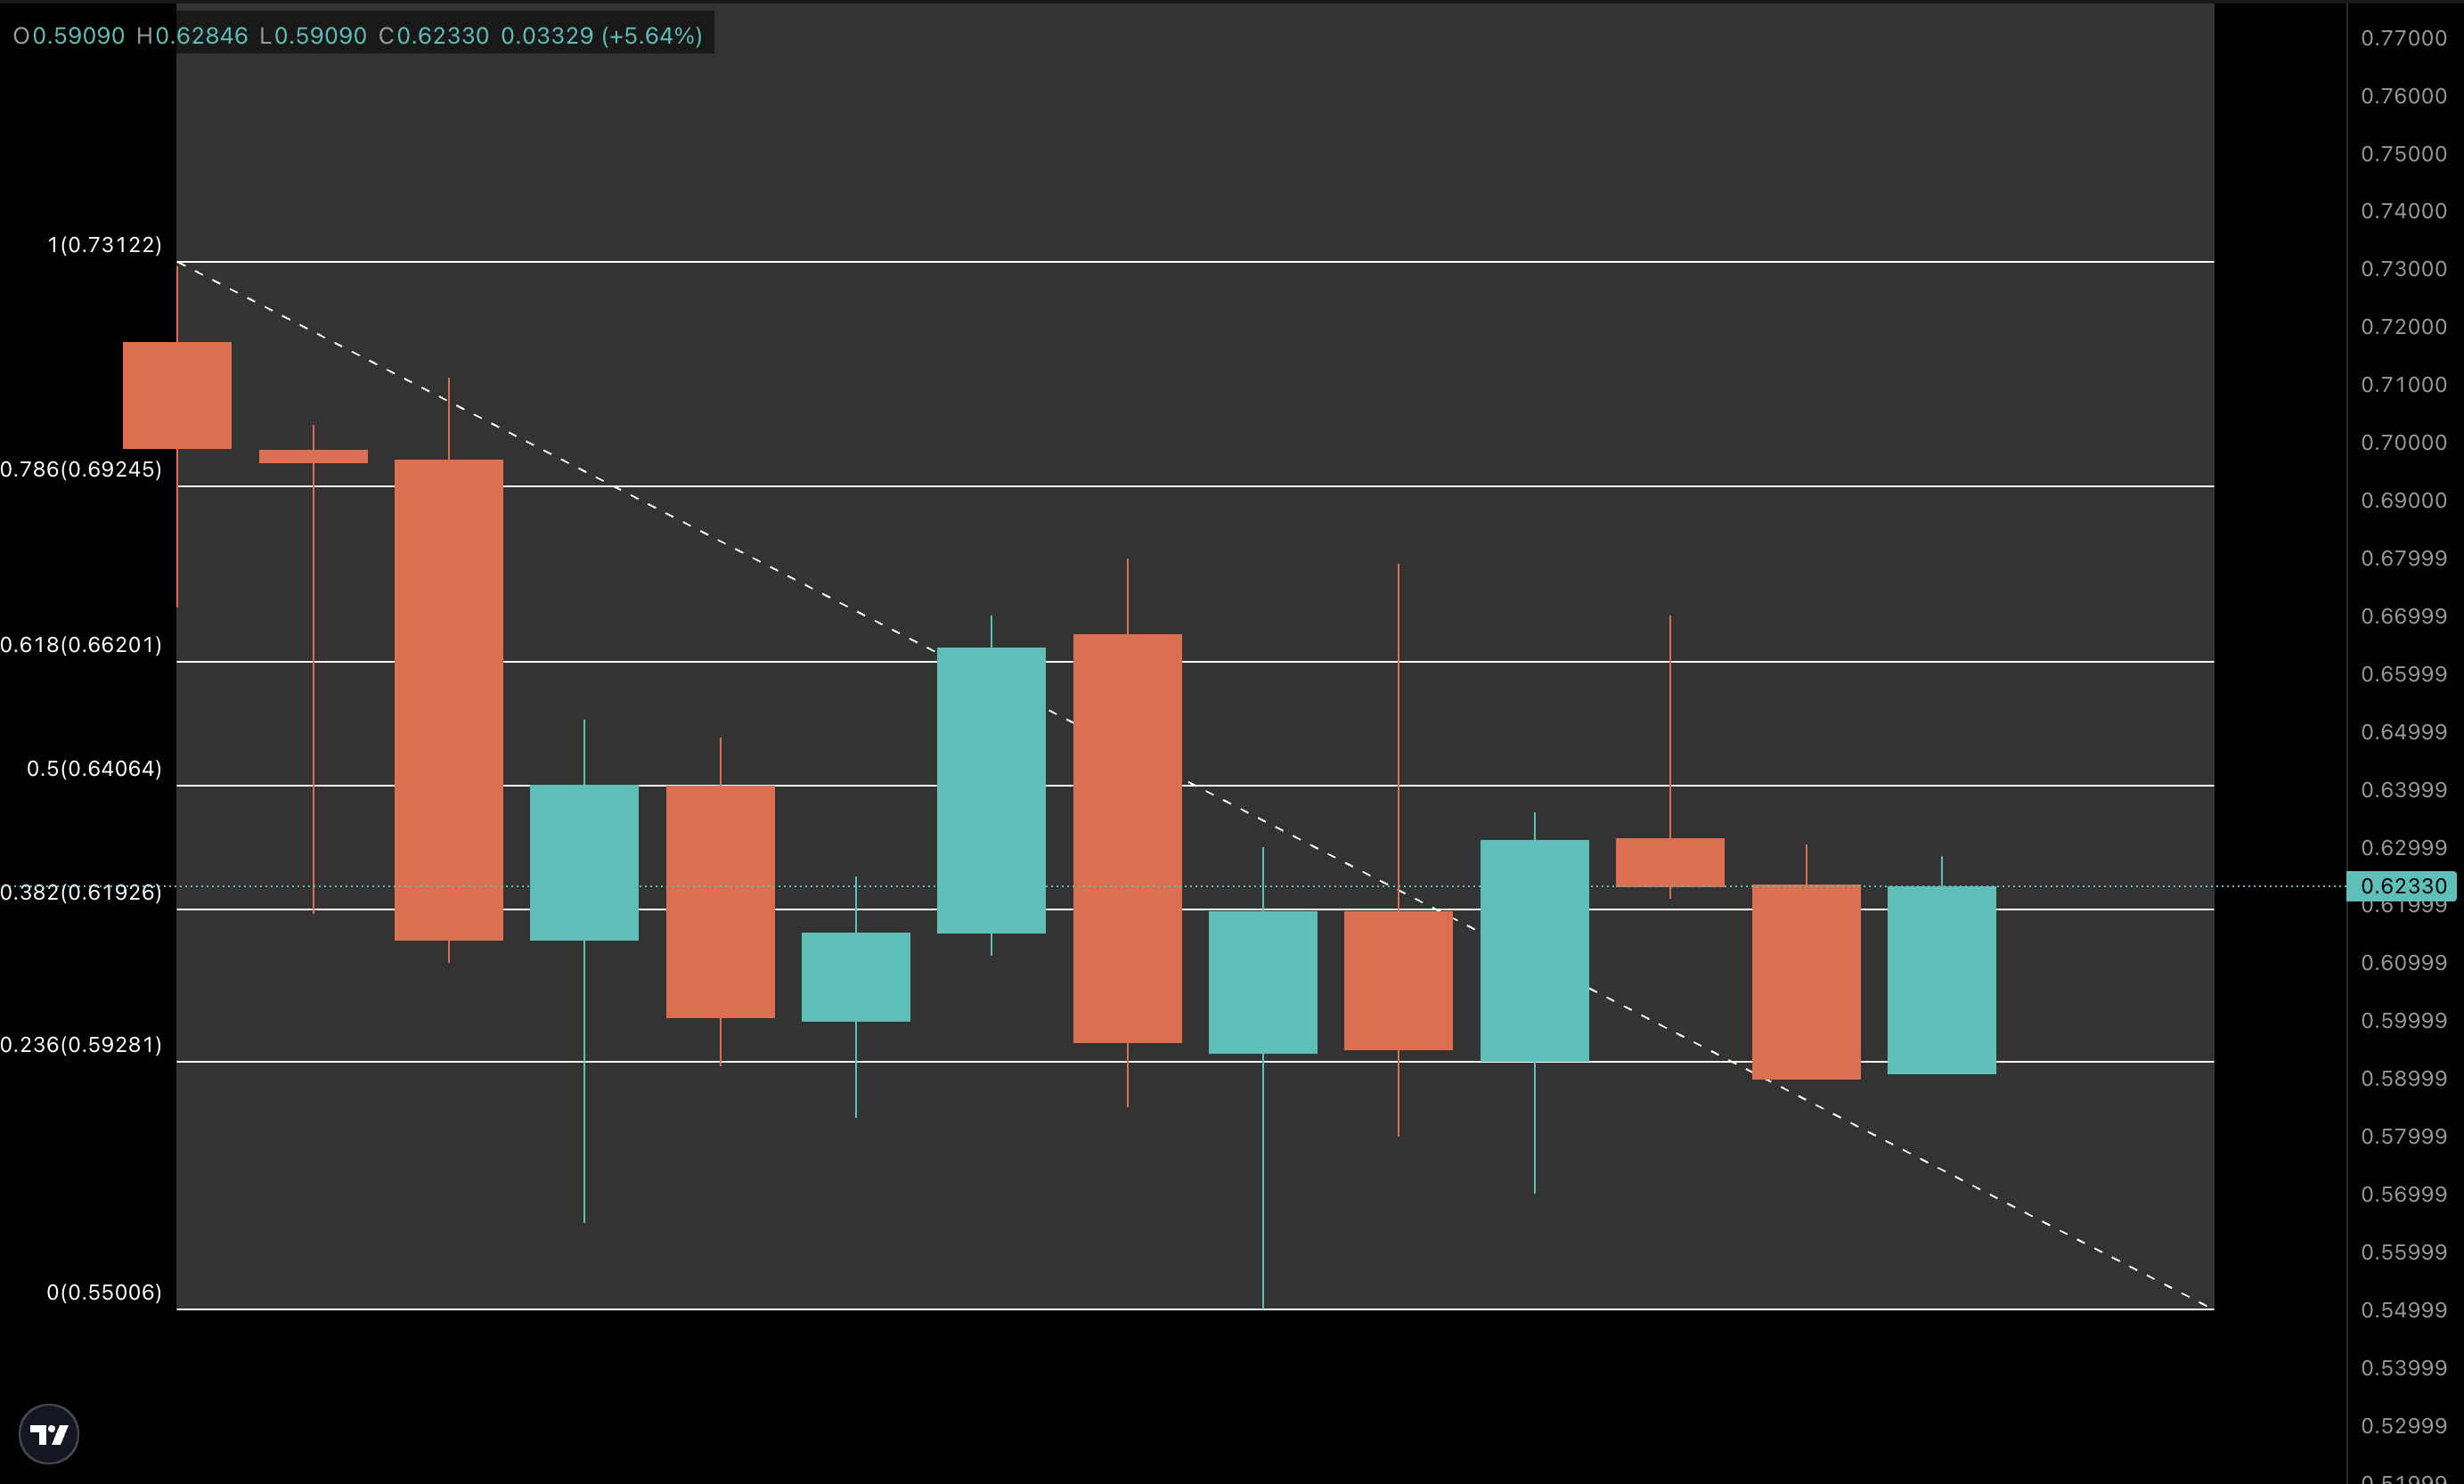
On the price chart, one level stands out. The ASTER price must reclaim $0.73, its listing high on AsterDEX, to confirm the next bullish leg. For now, resistance lies at $0.64 and $0.66, while $0.55 acts as crucial support. If that support breaks, the risk of fresh lows grows.
This puts the token at a crossroads. Until October 1, trading is confined to AsterDEX spot markets, leaving price discovery in the hands of early participants. After that date, liquidity will widen, CEX listings are expected, and ASTER will face its first real stress test.
If buyers manage to absorb selling and push above $0.73, the bullish “Hyperliquid-flipping” narrative will strengthen. But if October 1 brings a flood of selling from airdrop claimants, ASTER could instead tip into deeper losses. The market now waits to see which way it breaks.
