Pi Coin Price Stalemate: A 2% Surge or 5% Plunge Could Shatter the Deadlock

Pi Coin's price action hits gridlock as buyers and sellers dig in—neither side willing to blink first.
The Standoff Breakdown
Traders watch the charts like hawks, waiting for that decisive move. Just a 2% bounce could trigger FOMO buying, while a 5% dip might spark panic selling. Either scenario breaks the current impasse that's frustrating both bulls and bears.
Market mechanics suggest this equilibrium won't last forever. Liquidity pools thin out at key levels, creating powder-keg conditions. When it moves, it'll move fast—no gentle exits here.
Meanwhile, traditional finance pundits still can't decide whether crypto is the future or just a well-dressed casino. Their hesitation? Priceless.
Buyer-Seller Stalemate Reflected in Money Flows
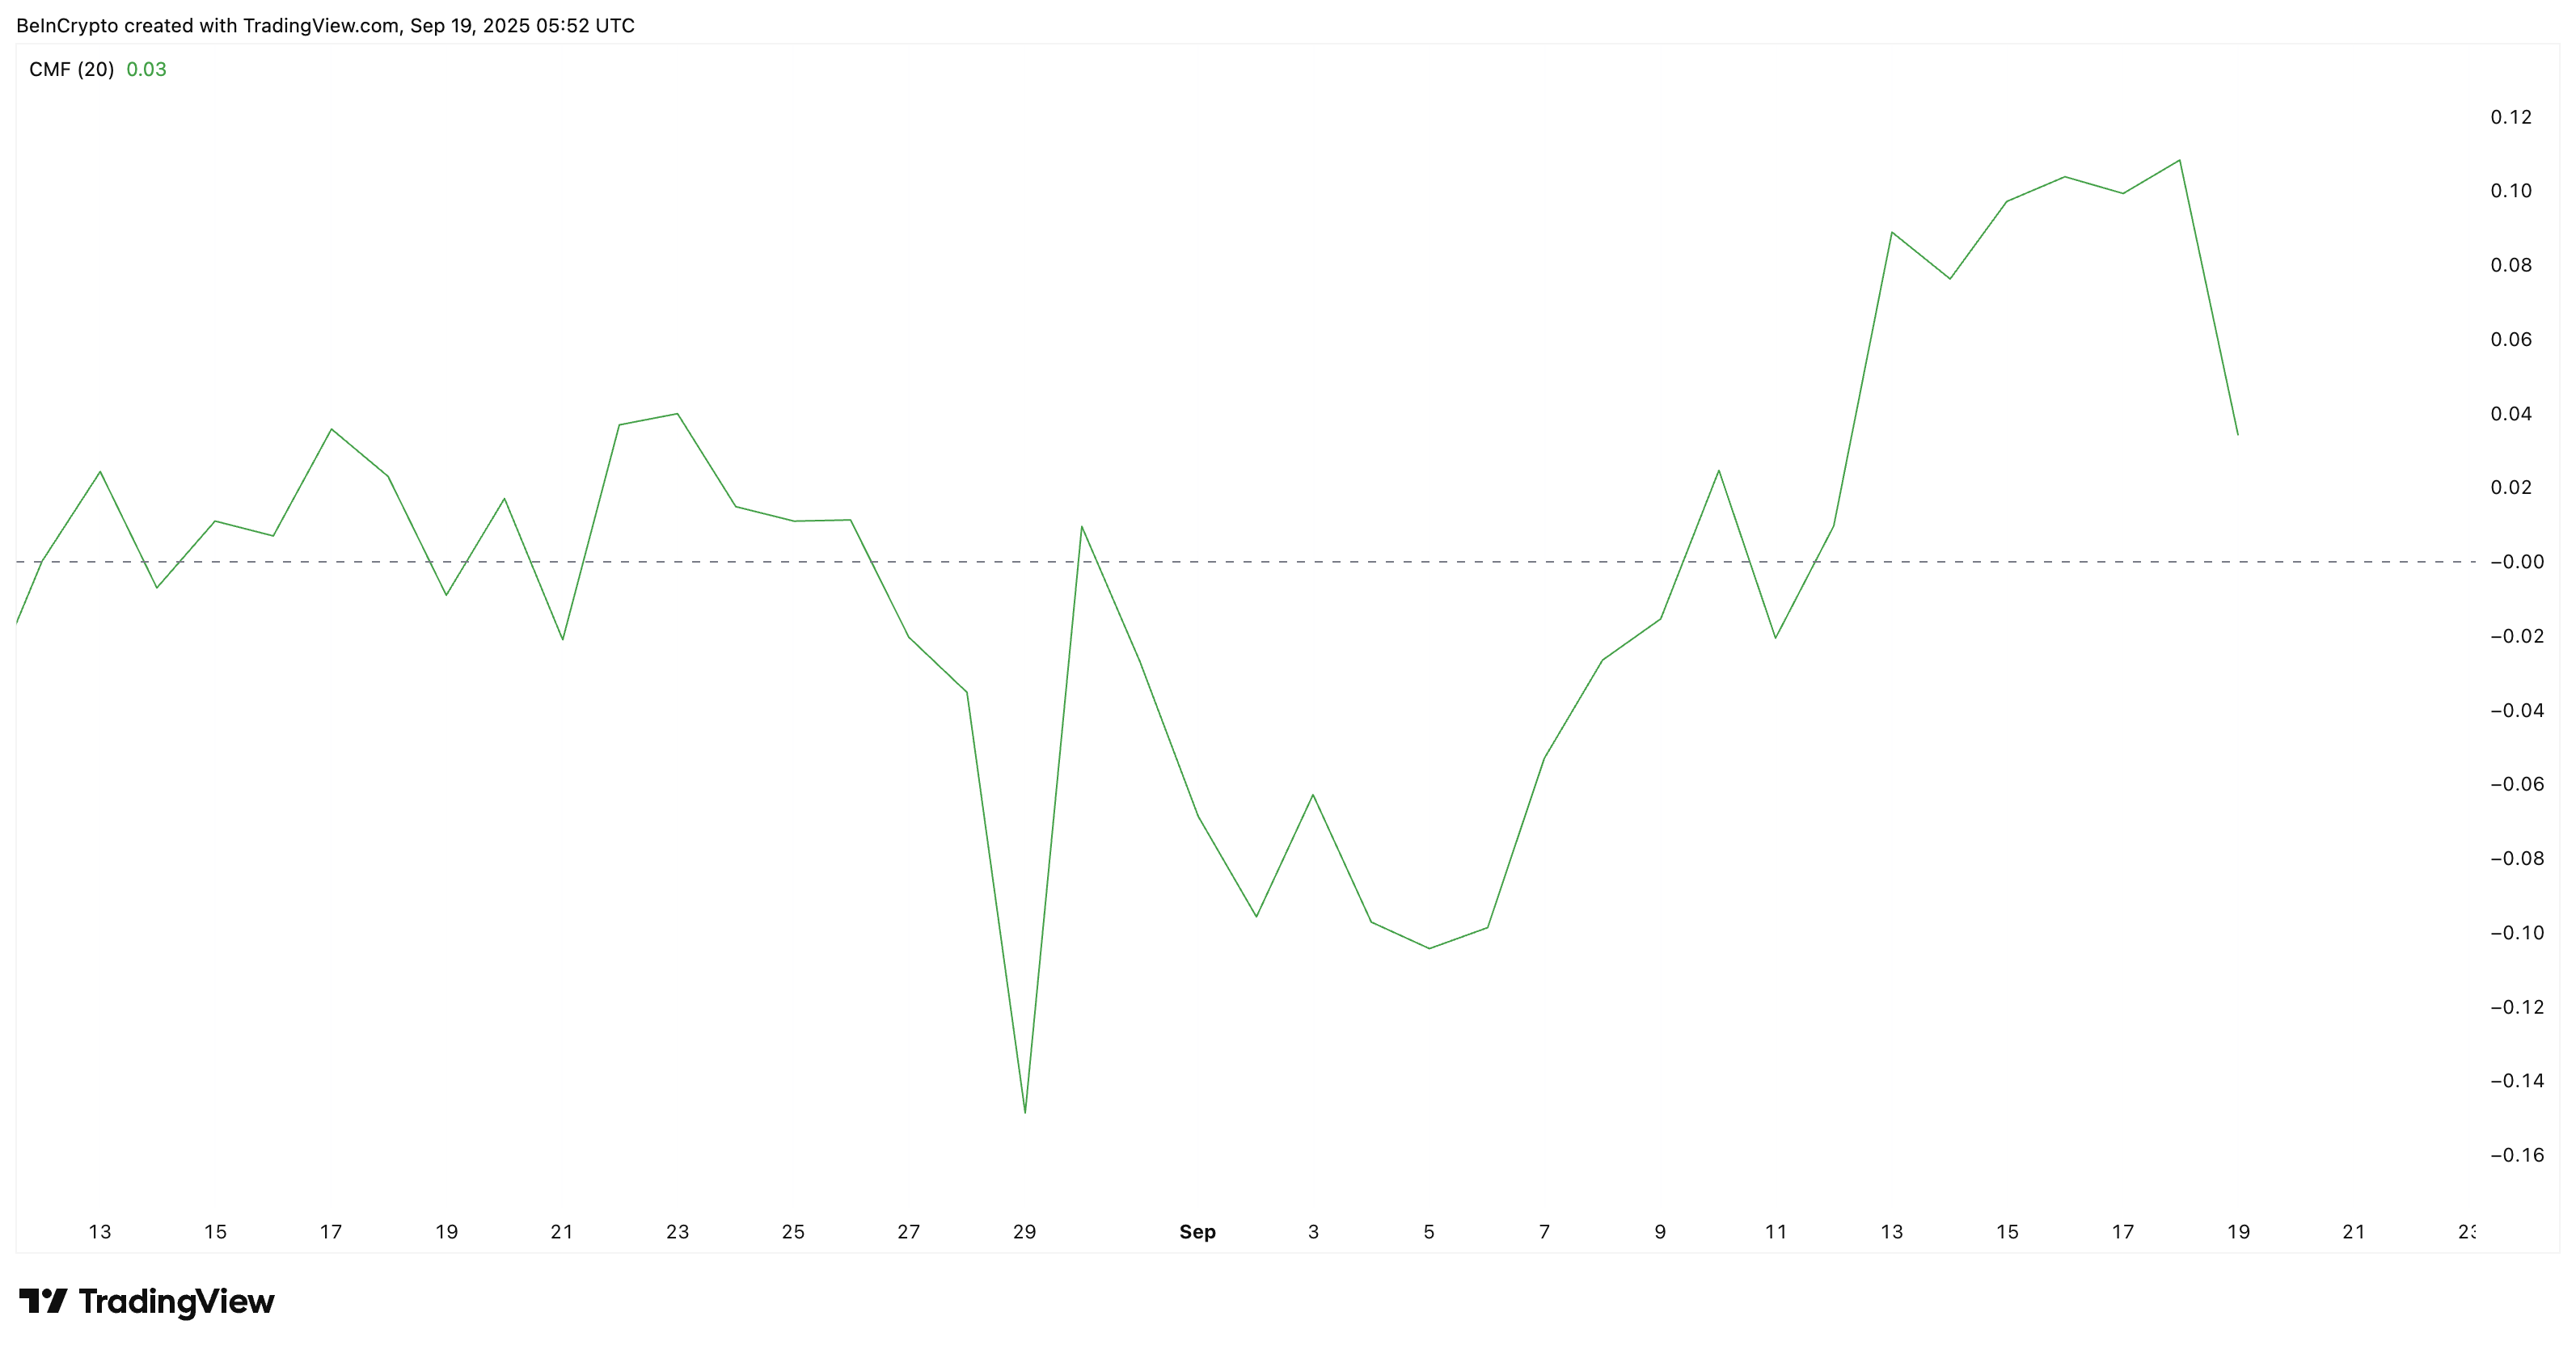
The split between big wallets and retail traders is now visible in the money FLOW data. The Chaikin Money Flow (CMF), which measures whether money is moving in or out, dropped sharply from 0.11 to 0.03 at press time.
This fall suggests that large wallets have been moving funds out, signaling reduced confidence.
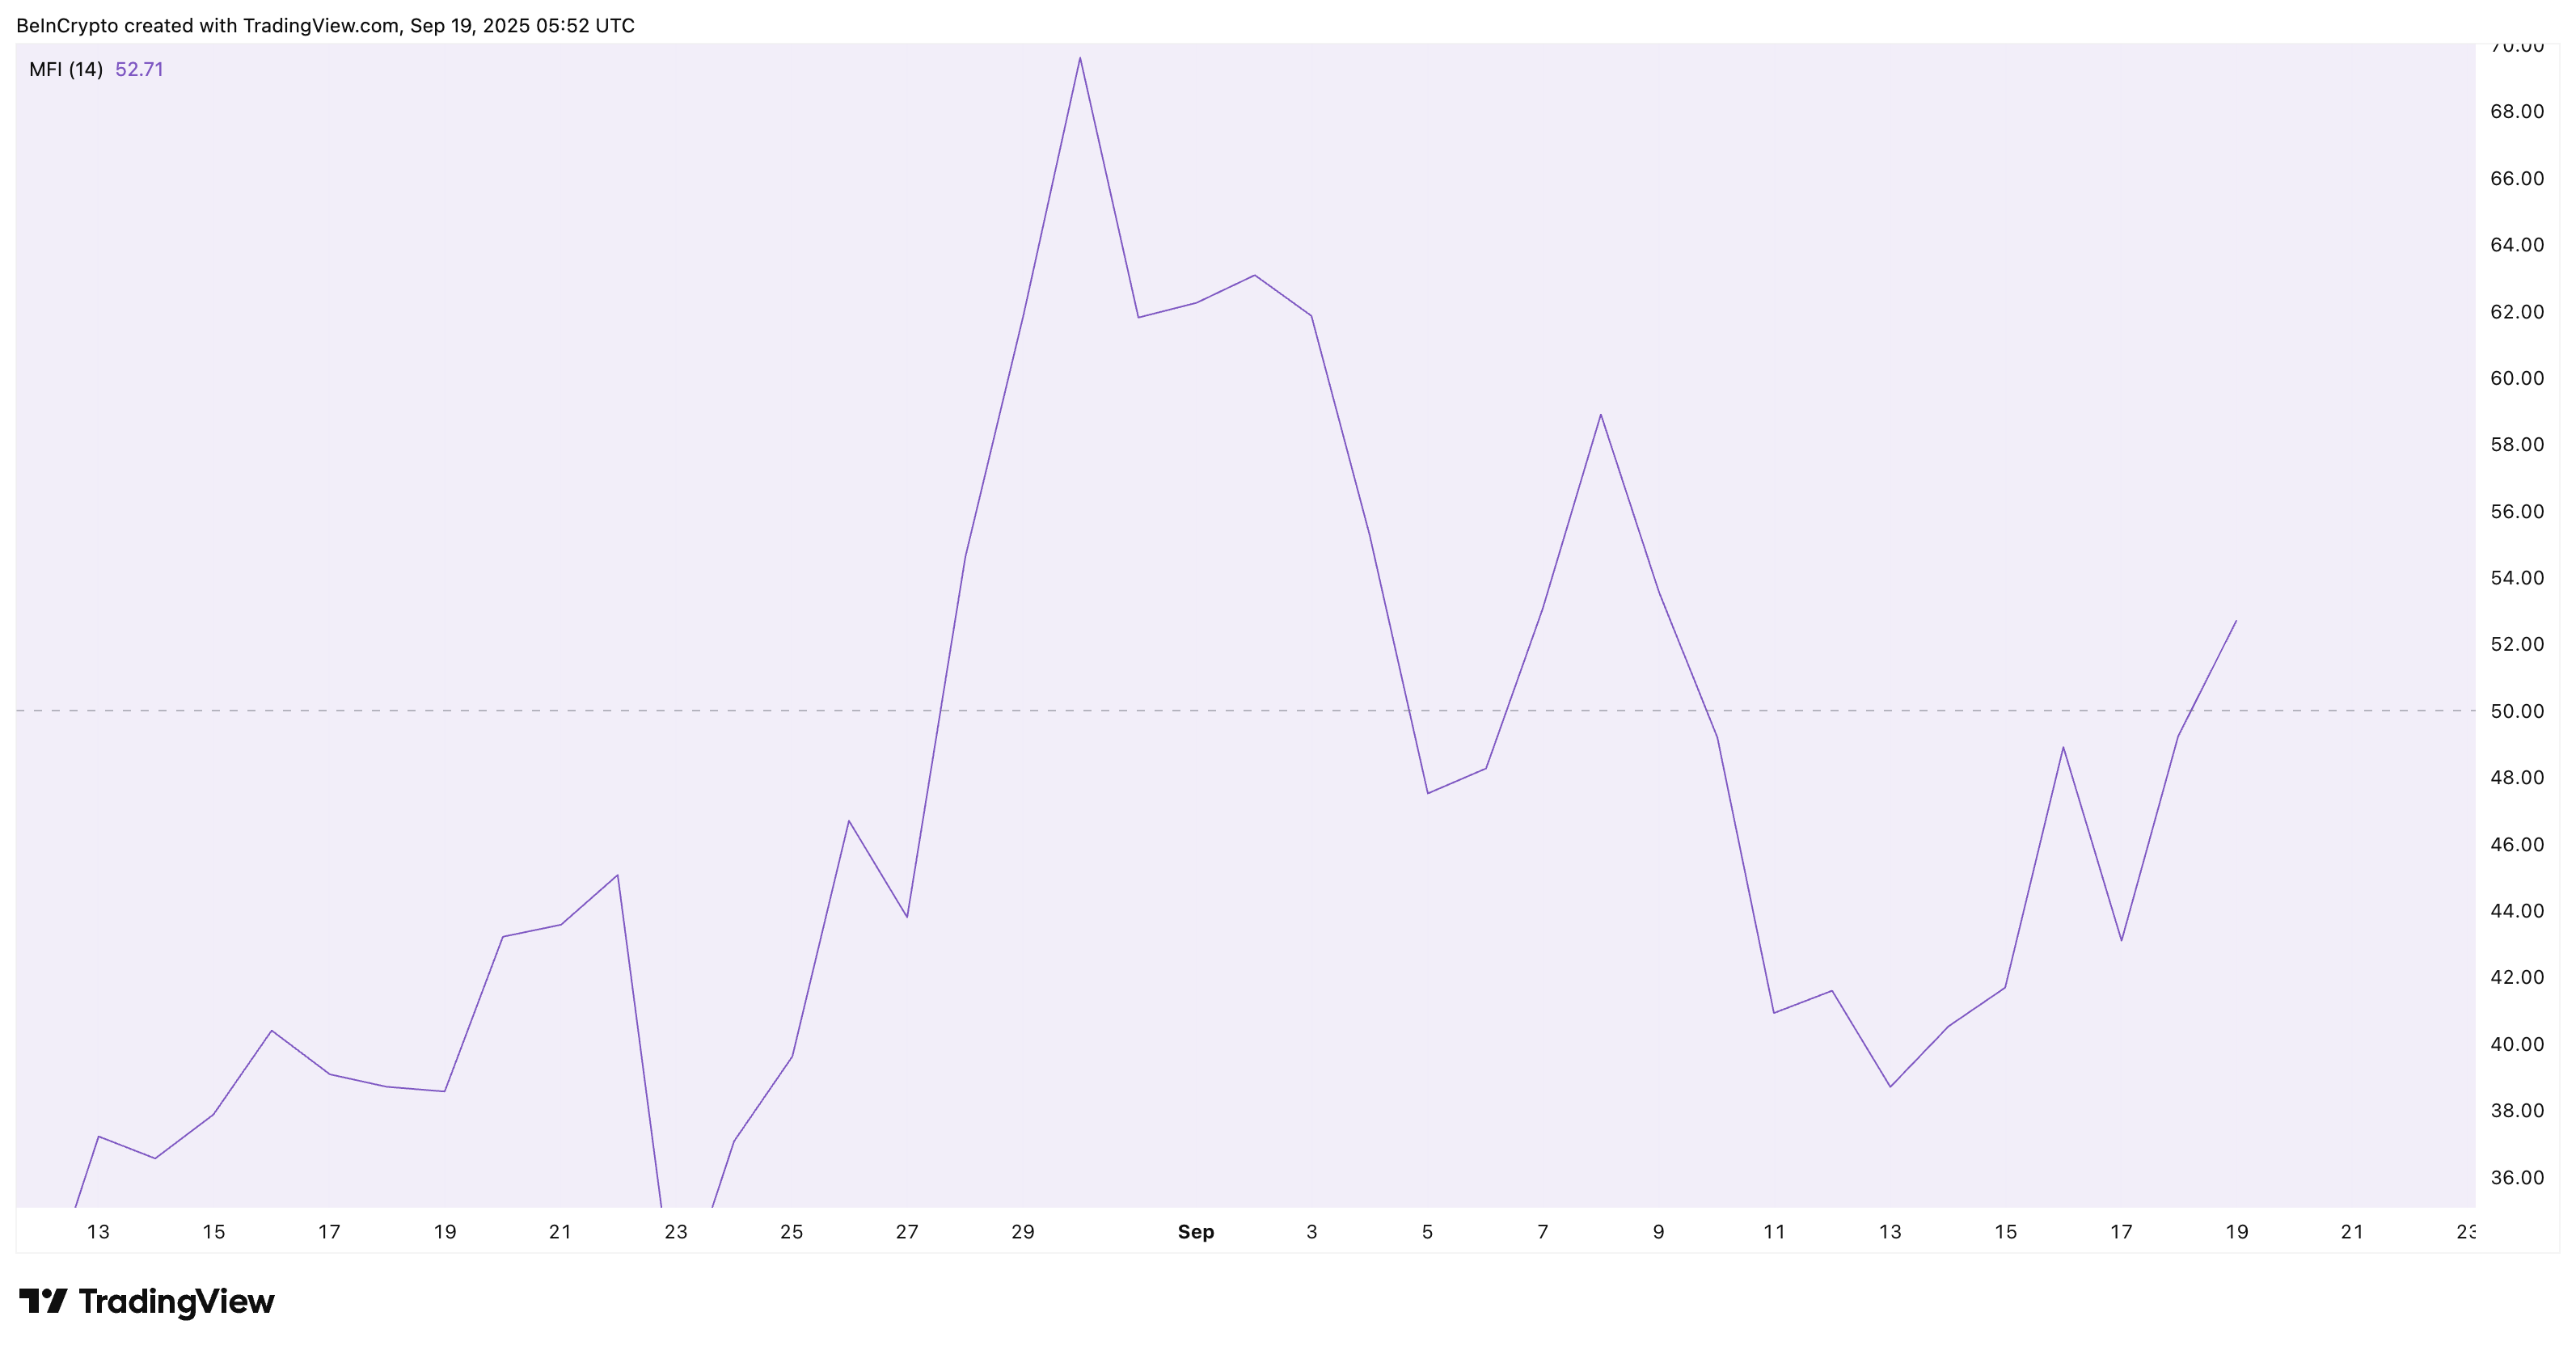
At the same time, the Money Flow Index (MFI), which tracks trading volumes and buying pressure, has gone in the opposite direction. It climbed from 43.11 to 52.71 in the same period. This is a strong signal that retail traders, who often act in smaller bursts, might still be putting money in and buying the Pi Coin price dip.
Sign up for Editor Harsh Notariya’s Daily crypto Newsletter here.
The divergence between CMF and MFI is at the Core of the buyer-seller stalemate. Large wallets are stepping back, but retail activity is keeping the price afloat. The Bull-Bear Power indicator (BBP), which tracks the balance between buying and selling pressure, confirms this tug of war by staying close to neutral.
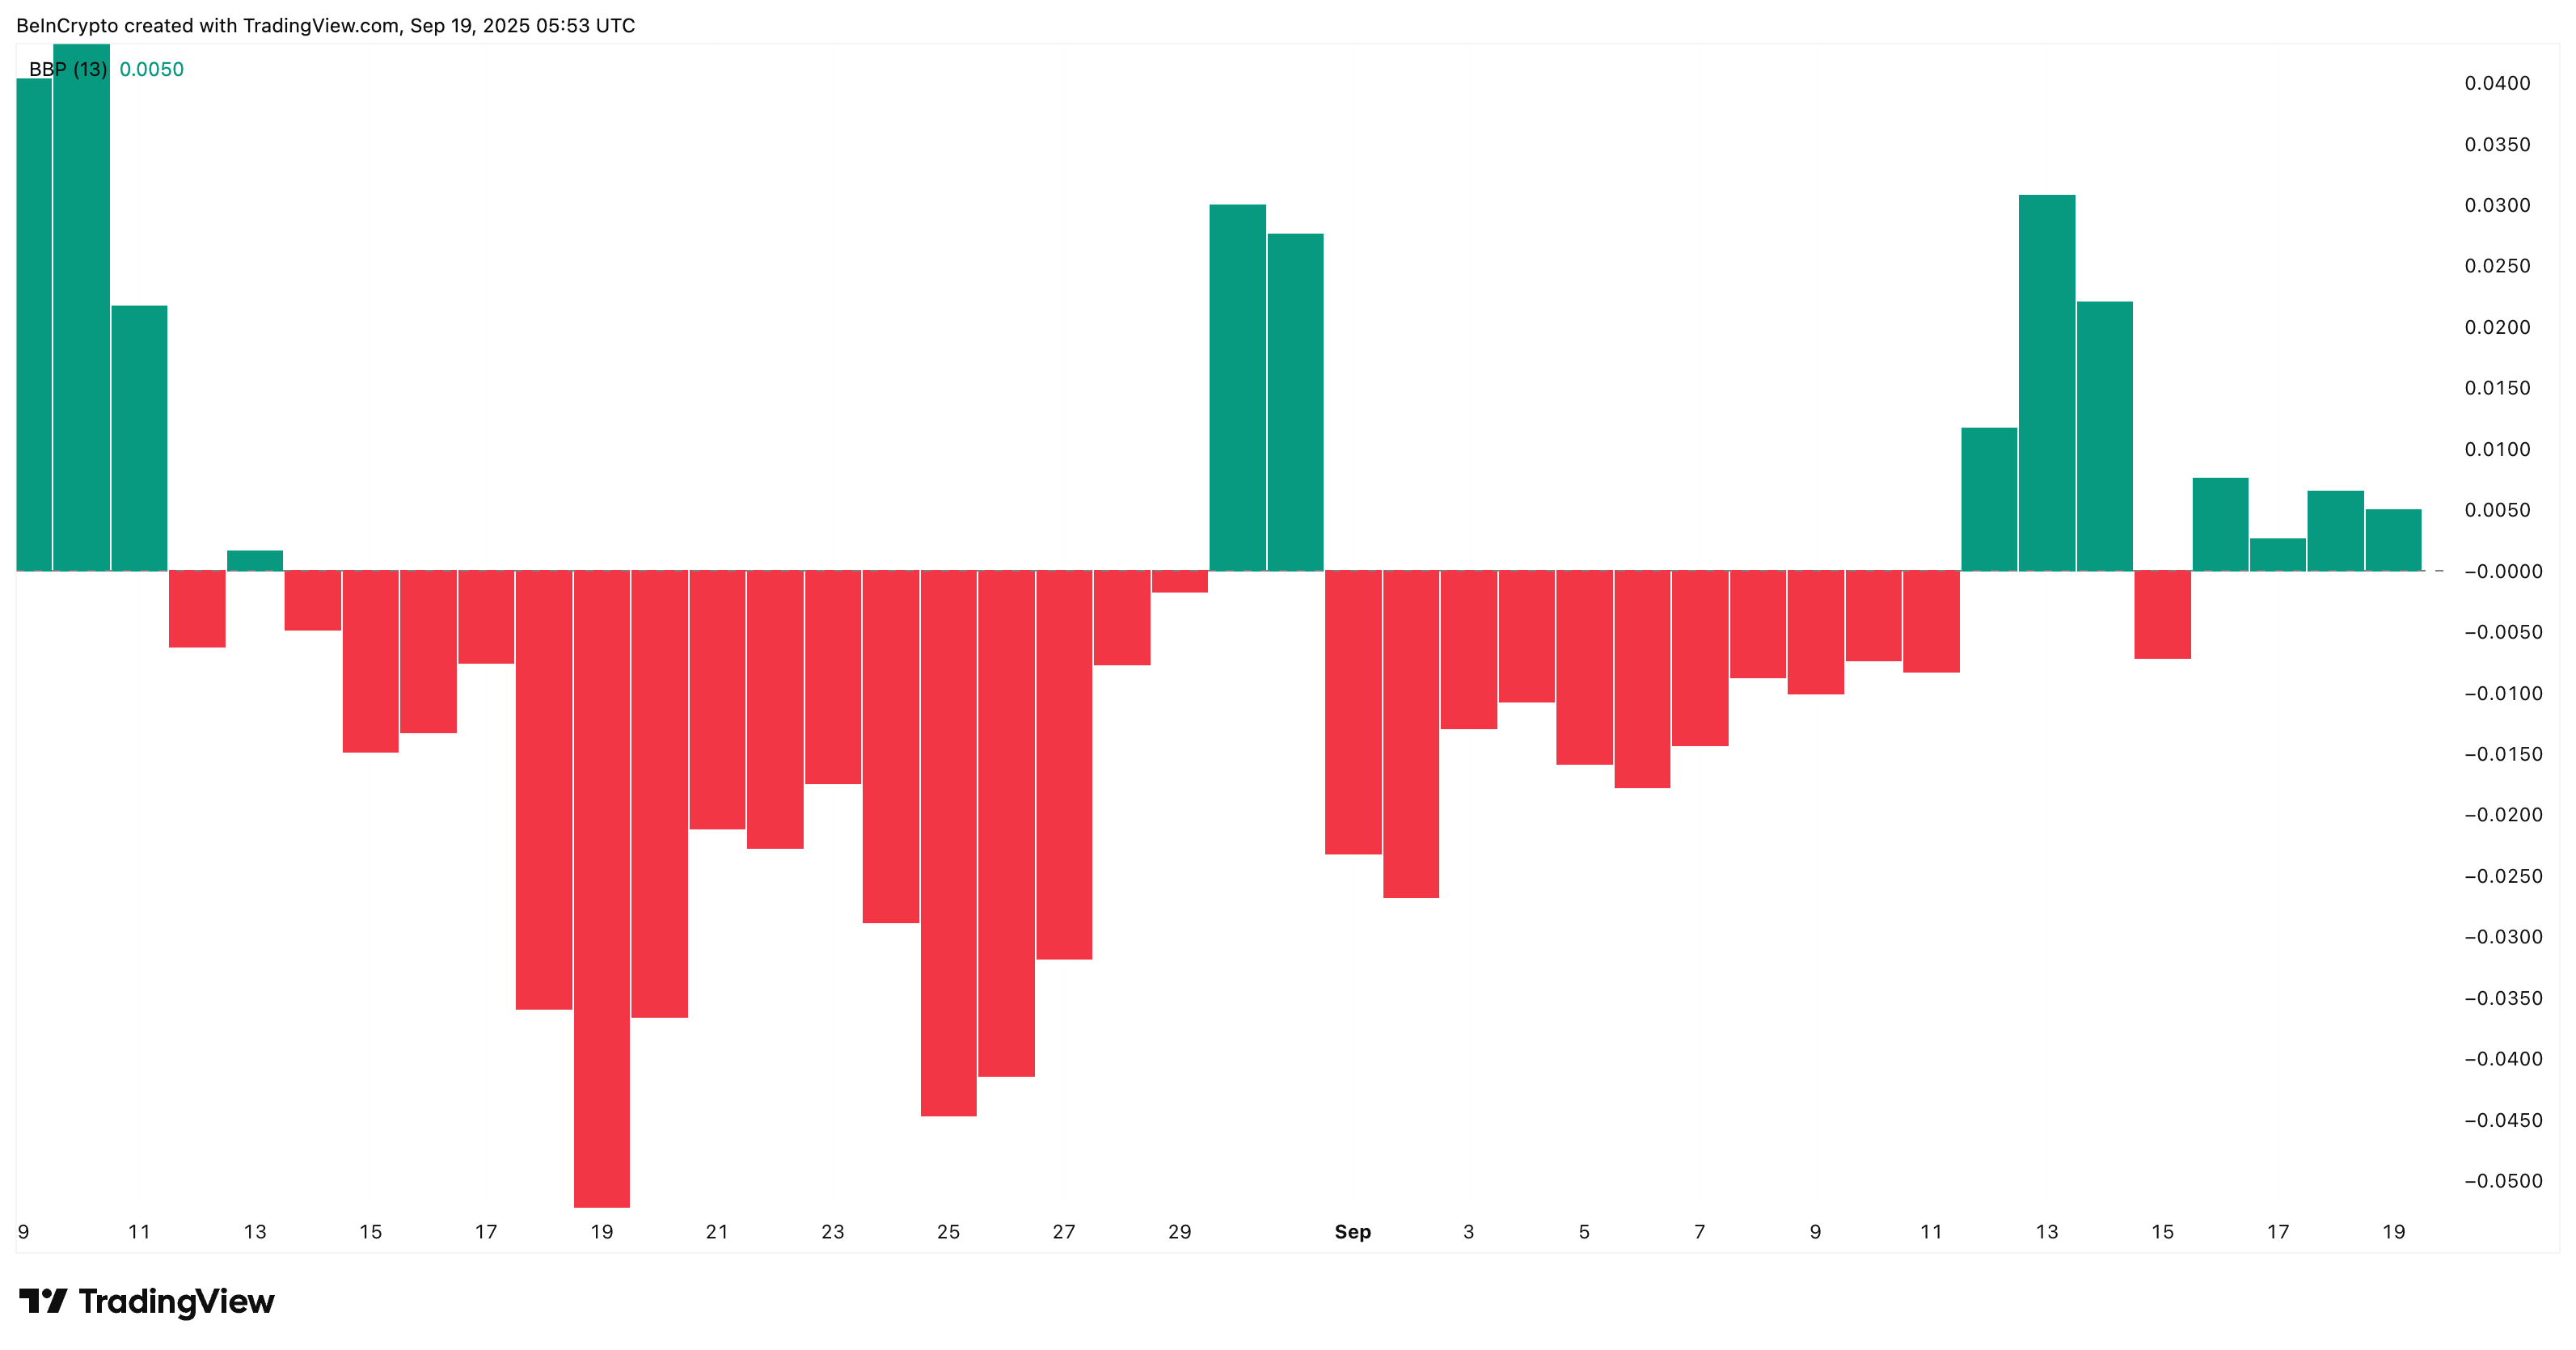
For now, it seems retail buying is winning over large wallet outflows as the BBP indicator still flashes green, but the balance could shift quickly. If outflows continue, bulls may lose their edge.
Pi Coin Price Chart Shows What Breaks the Stalemate
The price structure also reflects the standoff. PI Coin price has been moving inside a symmetrical triangle since August 25, compressing toward a breakout point. The range-bound trading at $0.360, even with small gains, shows how locked the market is.
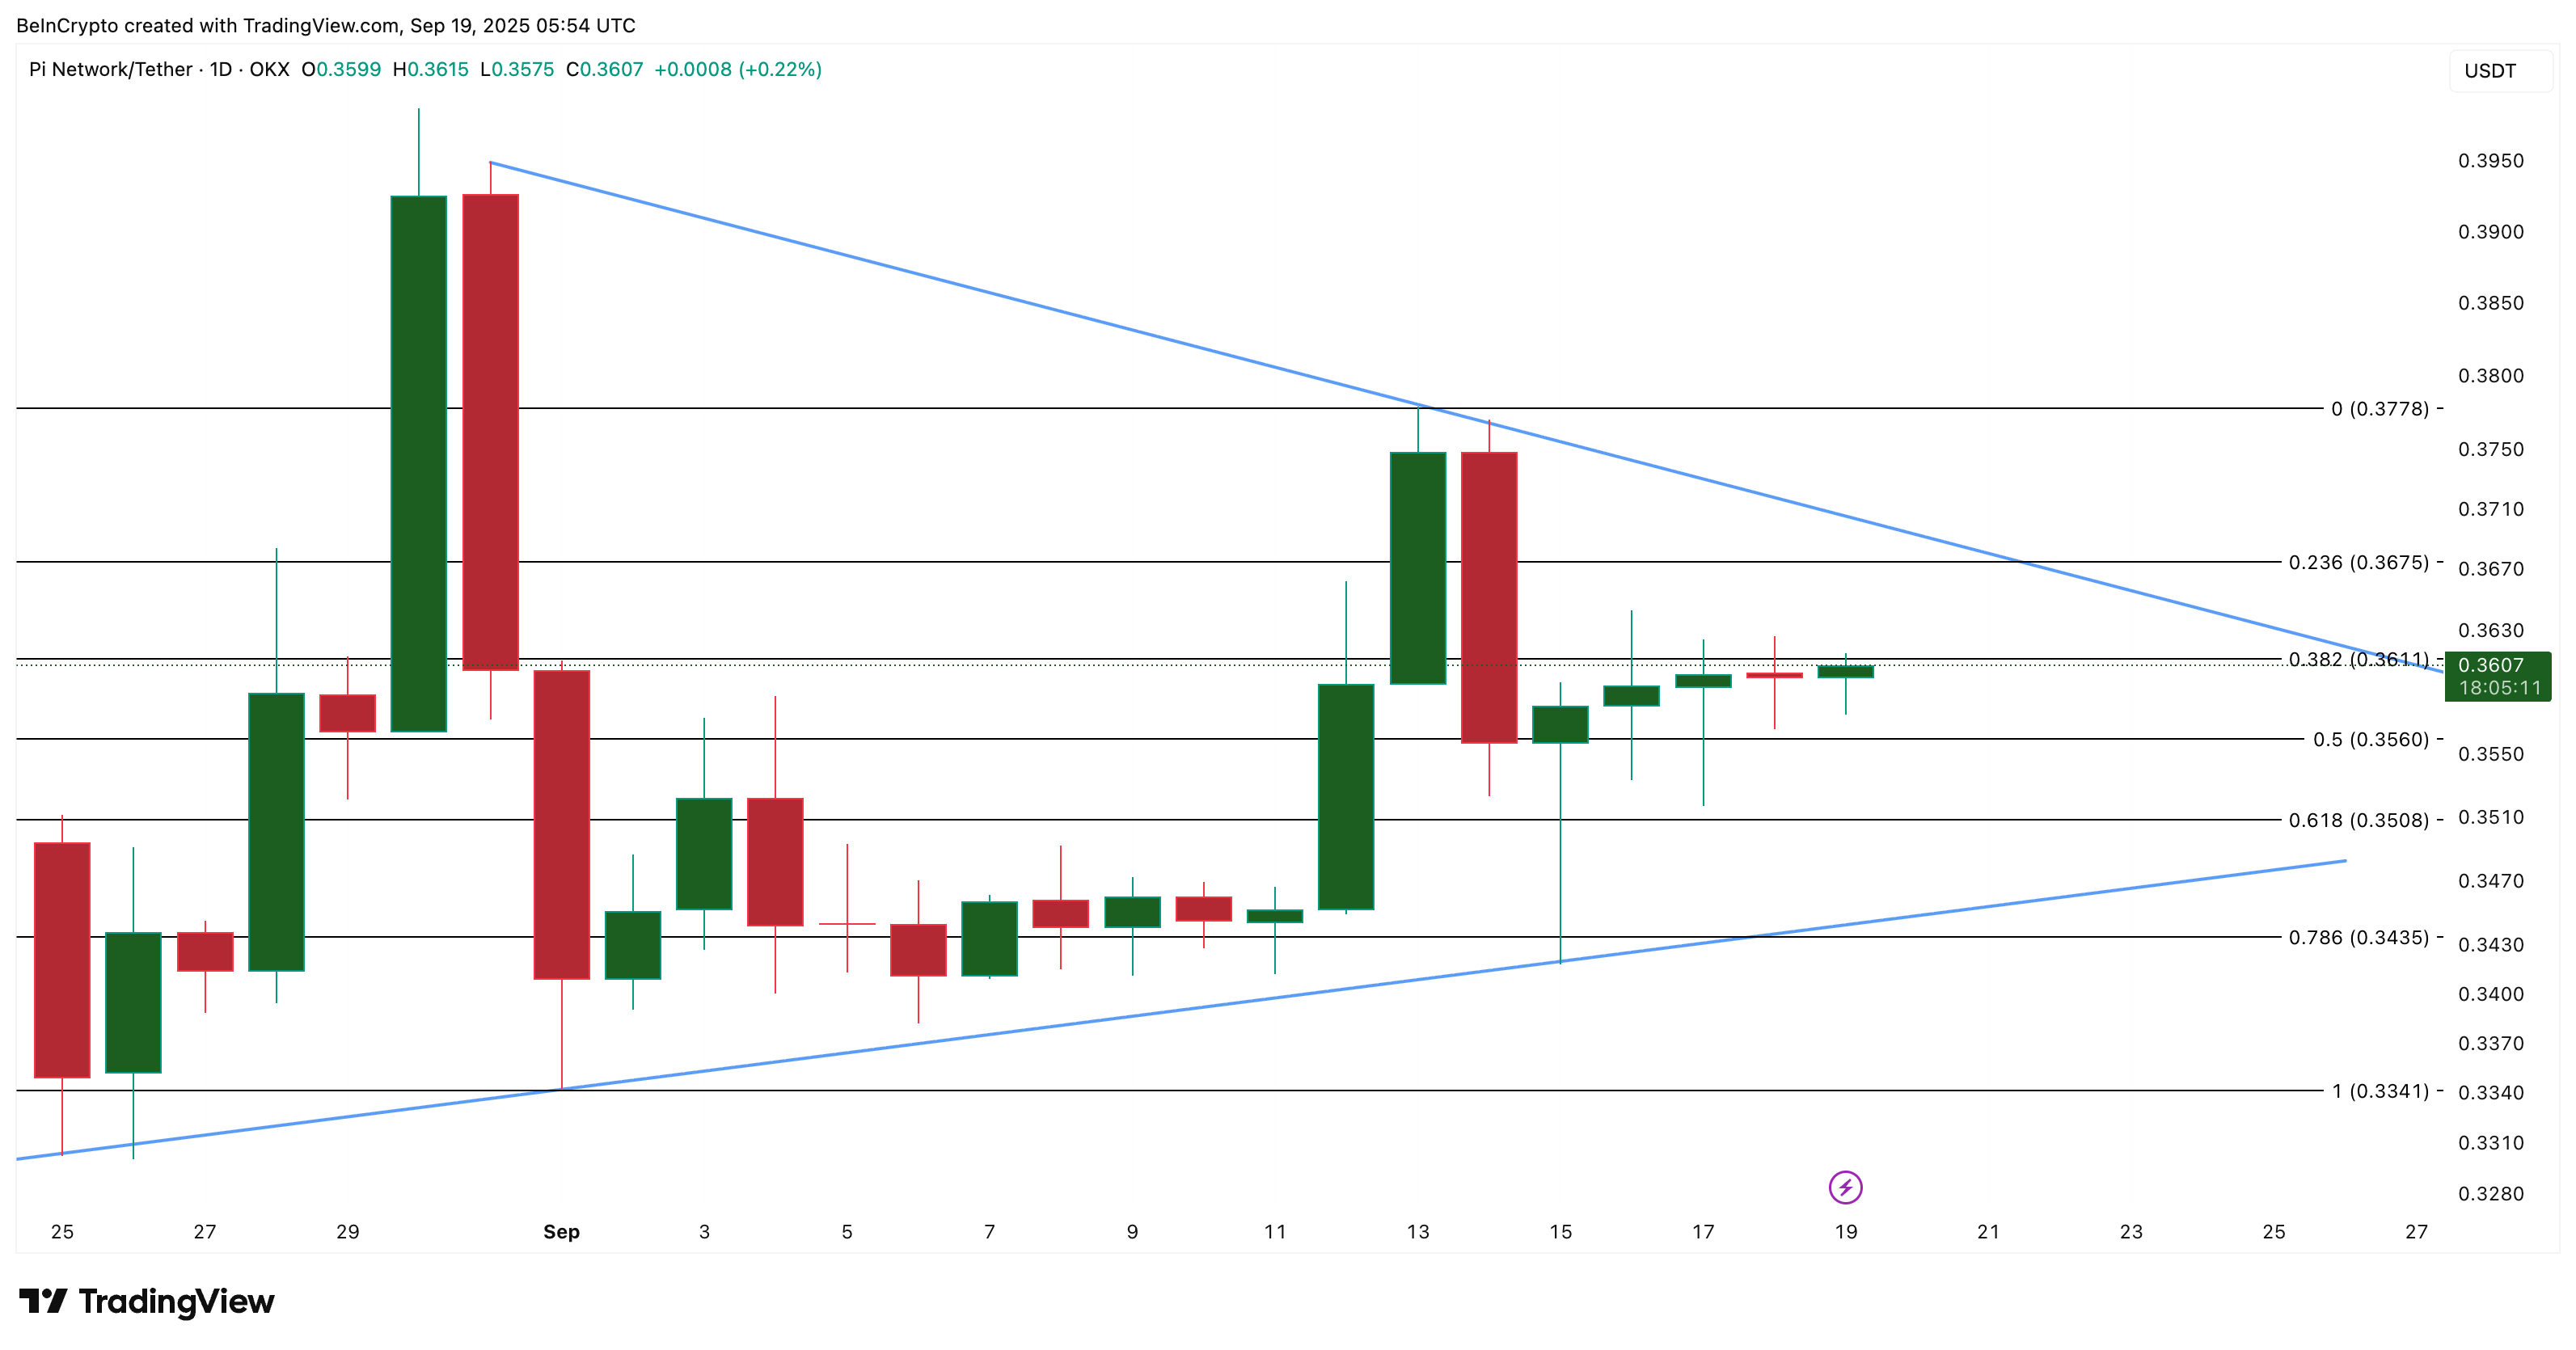
A daily close above $0.367 WOULD be enough for a clean breakout on the upper trendline, a 2% upmove from the current level. That would put Pi on track for $0.377, a short-term bullish target, which might happen if the retail demand stays strong.
On the downside, however, risks remain. A break under $0.343 (a 5% fall) would weaken the structure, and falling below $0.334 could send Pi toward fresh all-time lows.
The tug of war between buyers and sellers has kept Pi Coin price stuck, but the symmetrical triangle shows this won’t last.
A MOVE either way is likely soon. With retail holding firm but whales reducing exposure, the breakout/breakdown direction will depend on whether smaller buyers can keep overpowering larger outflows.
