Bitcoin’s 2% Dip: The Final Pause Before Soaring Past $120,000?

Bitcoin flashes a classic bull-market breather—just enough to shake out weak hands before the next leg up.
The Setup
A fleeting 2% pullback hardly qualifies as a correction in crypto terms. It's more like a market taking a deep breath before sprinting. Historical patterns suggest these micro-dips often precede major breakouts—not breakdowns.
Institutional accumulation continues behind the scenes. Whale wallets are loading up, not cashing out. Meanwhile, retail traders panic-sell over a minor blip—classic behavior.
The Trajectory
All signs point toward the $120,000 target holding firm. Macro tailwinds, adoption milestones, and sheer momentum override short-term noise. This isn't speculation; it's probability.
Traditional finance still doesn't get it—they’re busy over-analyzing quarterly reports while missing the digital revolution happening right under their spreadsheets. Bitcoin doesn’t need their approval to keep climbing.
Ready or not, here it comes.
Selling Pressure Builds From Large Balance Groups
Two of Bitcoin’s biggest wallet groups have trimmed their holdings since September 15. These groups are often referred to as “whales” and “sharks” — wallets holding 1,000–10,000 BTC and 10,000–100,000 BTC, respectively.
- The 1,000–10,000 BTC group dropped their holdings from 4.35 million BTC to 4.33 million BTC.
- The 10,000–100,000 BTC group fell from 2.17 million BTC to 2.16 million BTC.
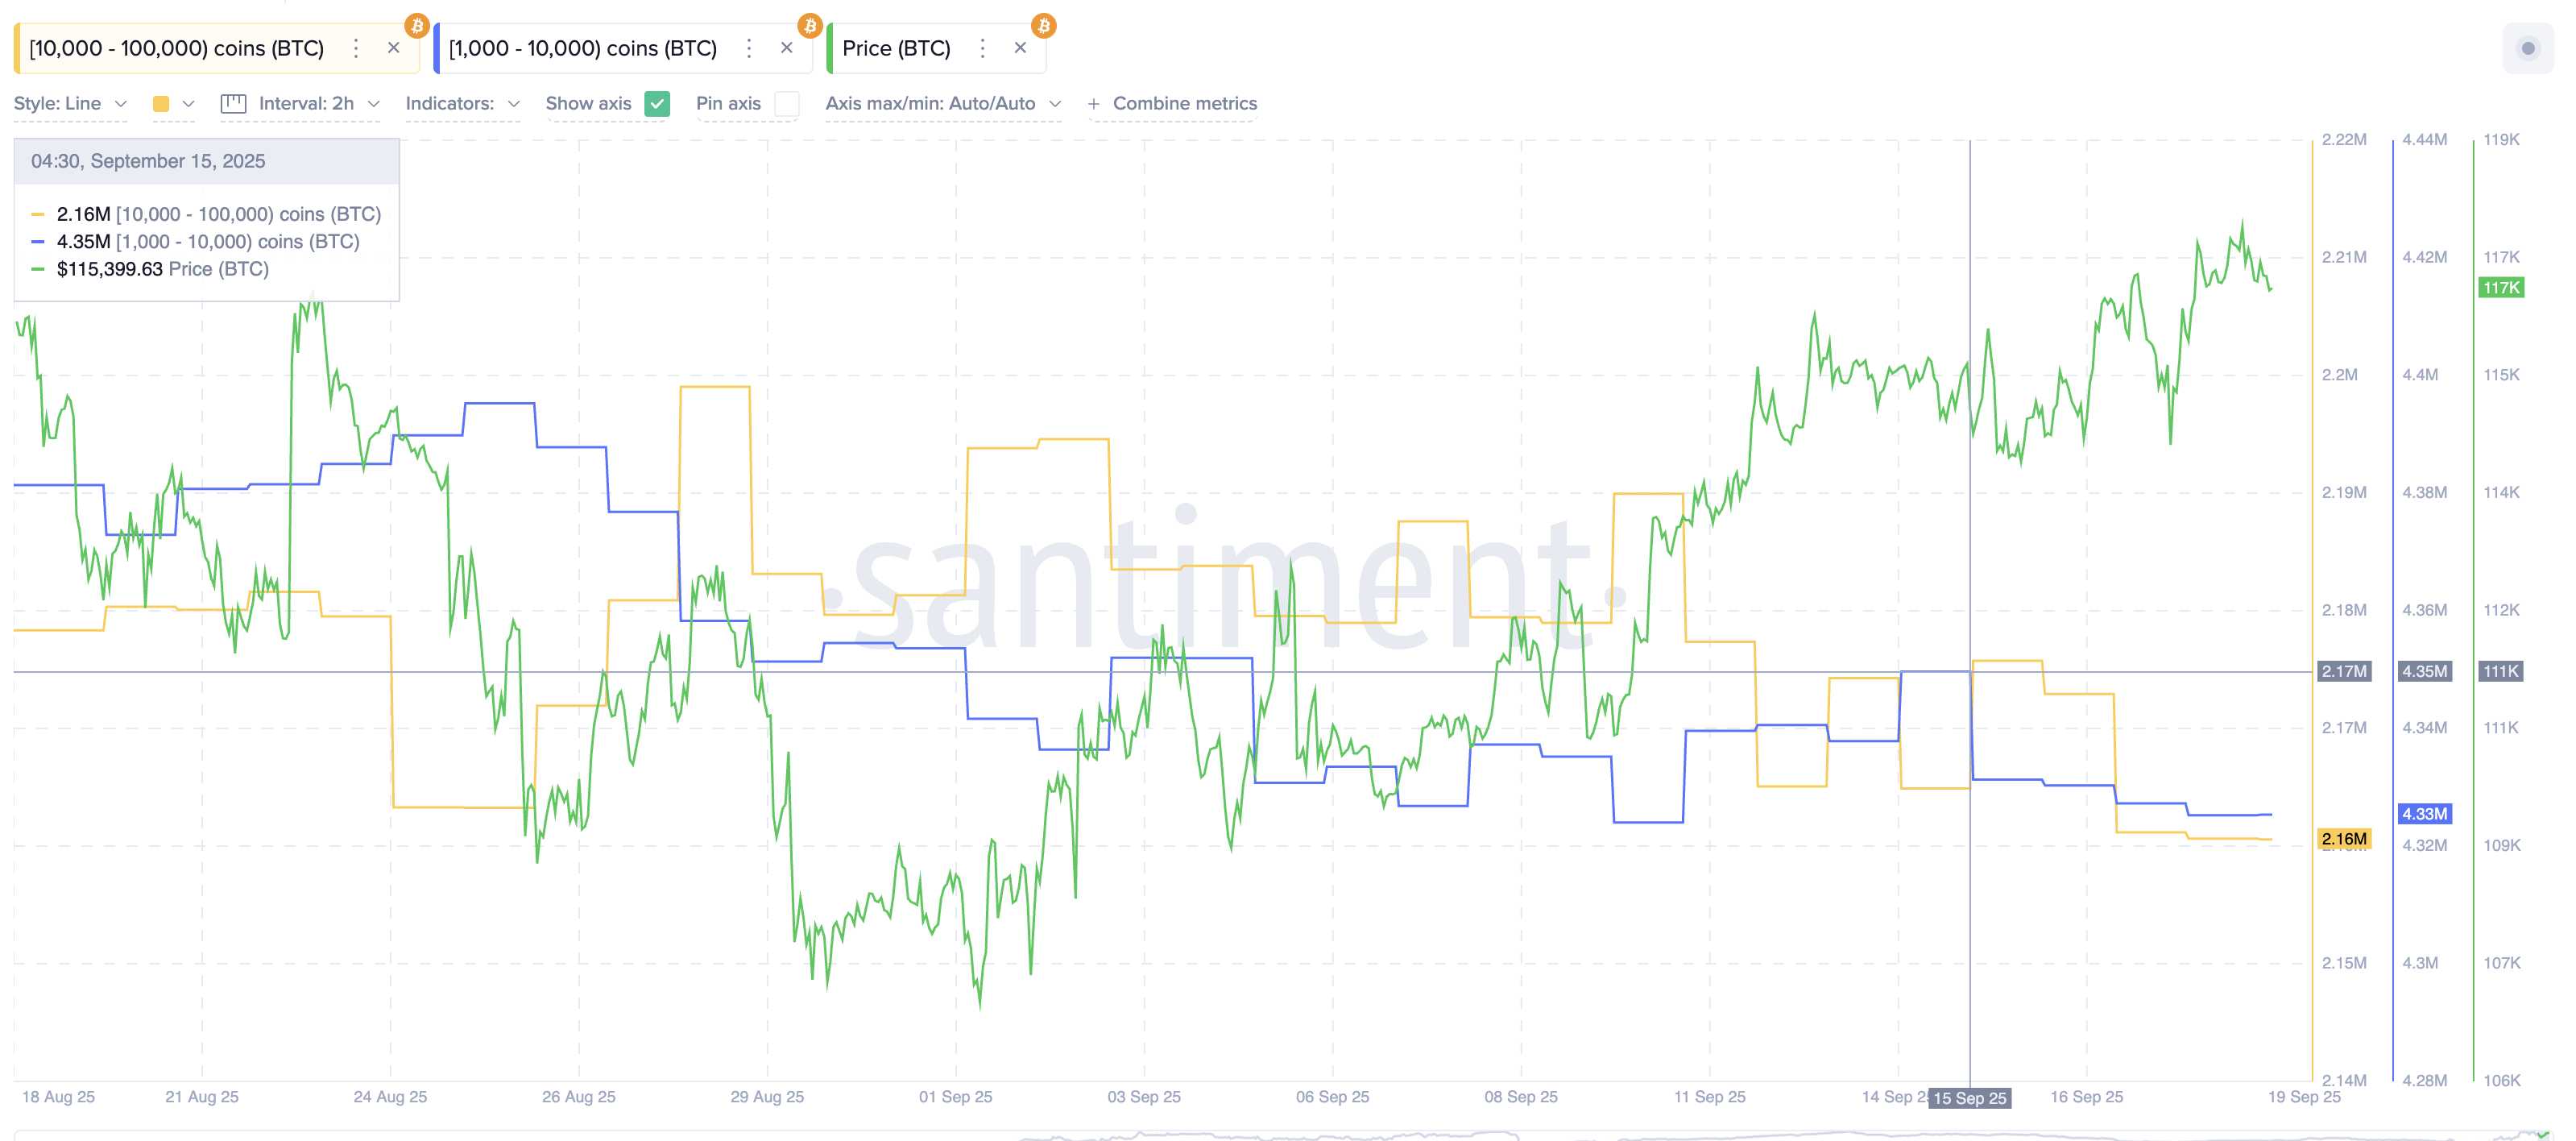
That’s a net outflow of about 30,000 BTC in just four days. With today’s Bitcoin price above $117,000, nearly $3.5 billion worth of BTC has been trimmed from holdings.
Sign up for Editor Harsh Notariya’s Daily crypto Newsletter here.
Such drops often signal that large investors are booking profits or preparing for volatility.
Younger Coins Show Fresh Selling
Another key on-chain signal confirms the picture: Spent Output Age Bands. This metric shows what percentage of coins from different “age groups” are being moved or sold. In other words, it tracks how much of the supply last moved weeks or months ago is now being spent again.
Over the past two weeks, every younger age cohort has increased its share of spent coins:
- 1 week to 1 month holders: rose from 8.72% to 9.78%.
- 1 to 3 month holders: rose from 3.67% to 6.08%.
- 3 to 6 month holders: rose from 2.04% to 3.26%.
- 6 to 12 month holders: rose from 1.64% to 3.18%. (relatively younger considering BTC’s history)
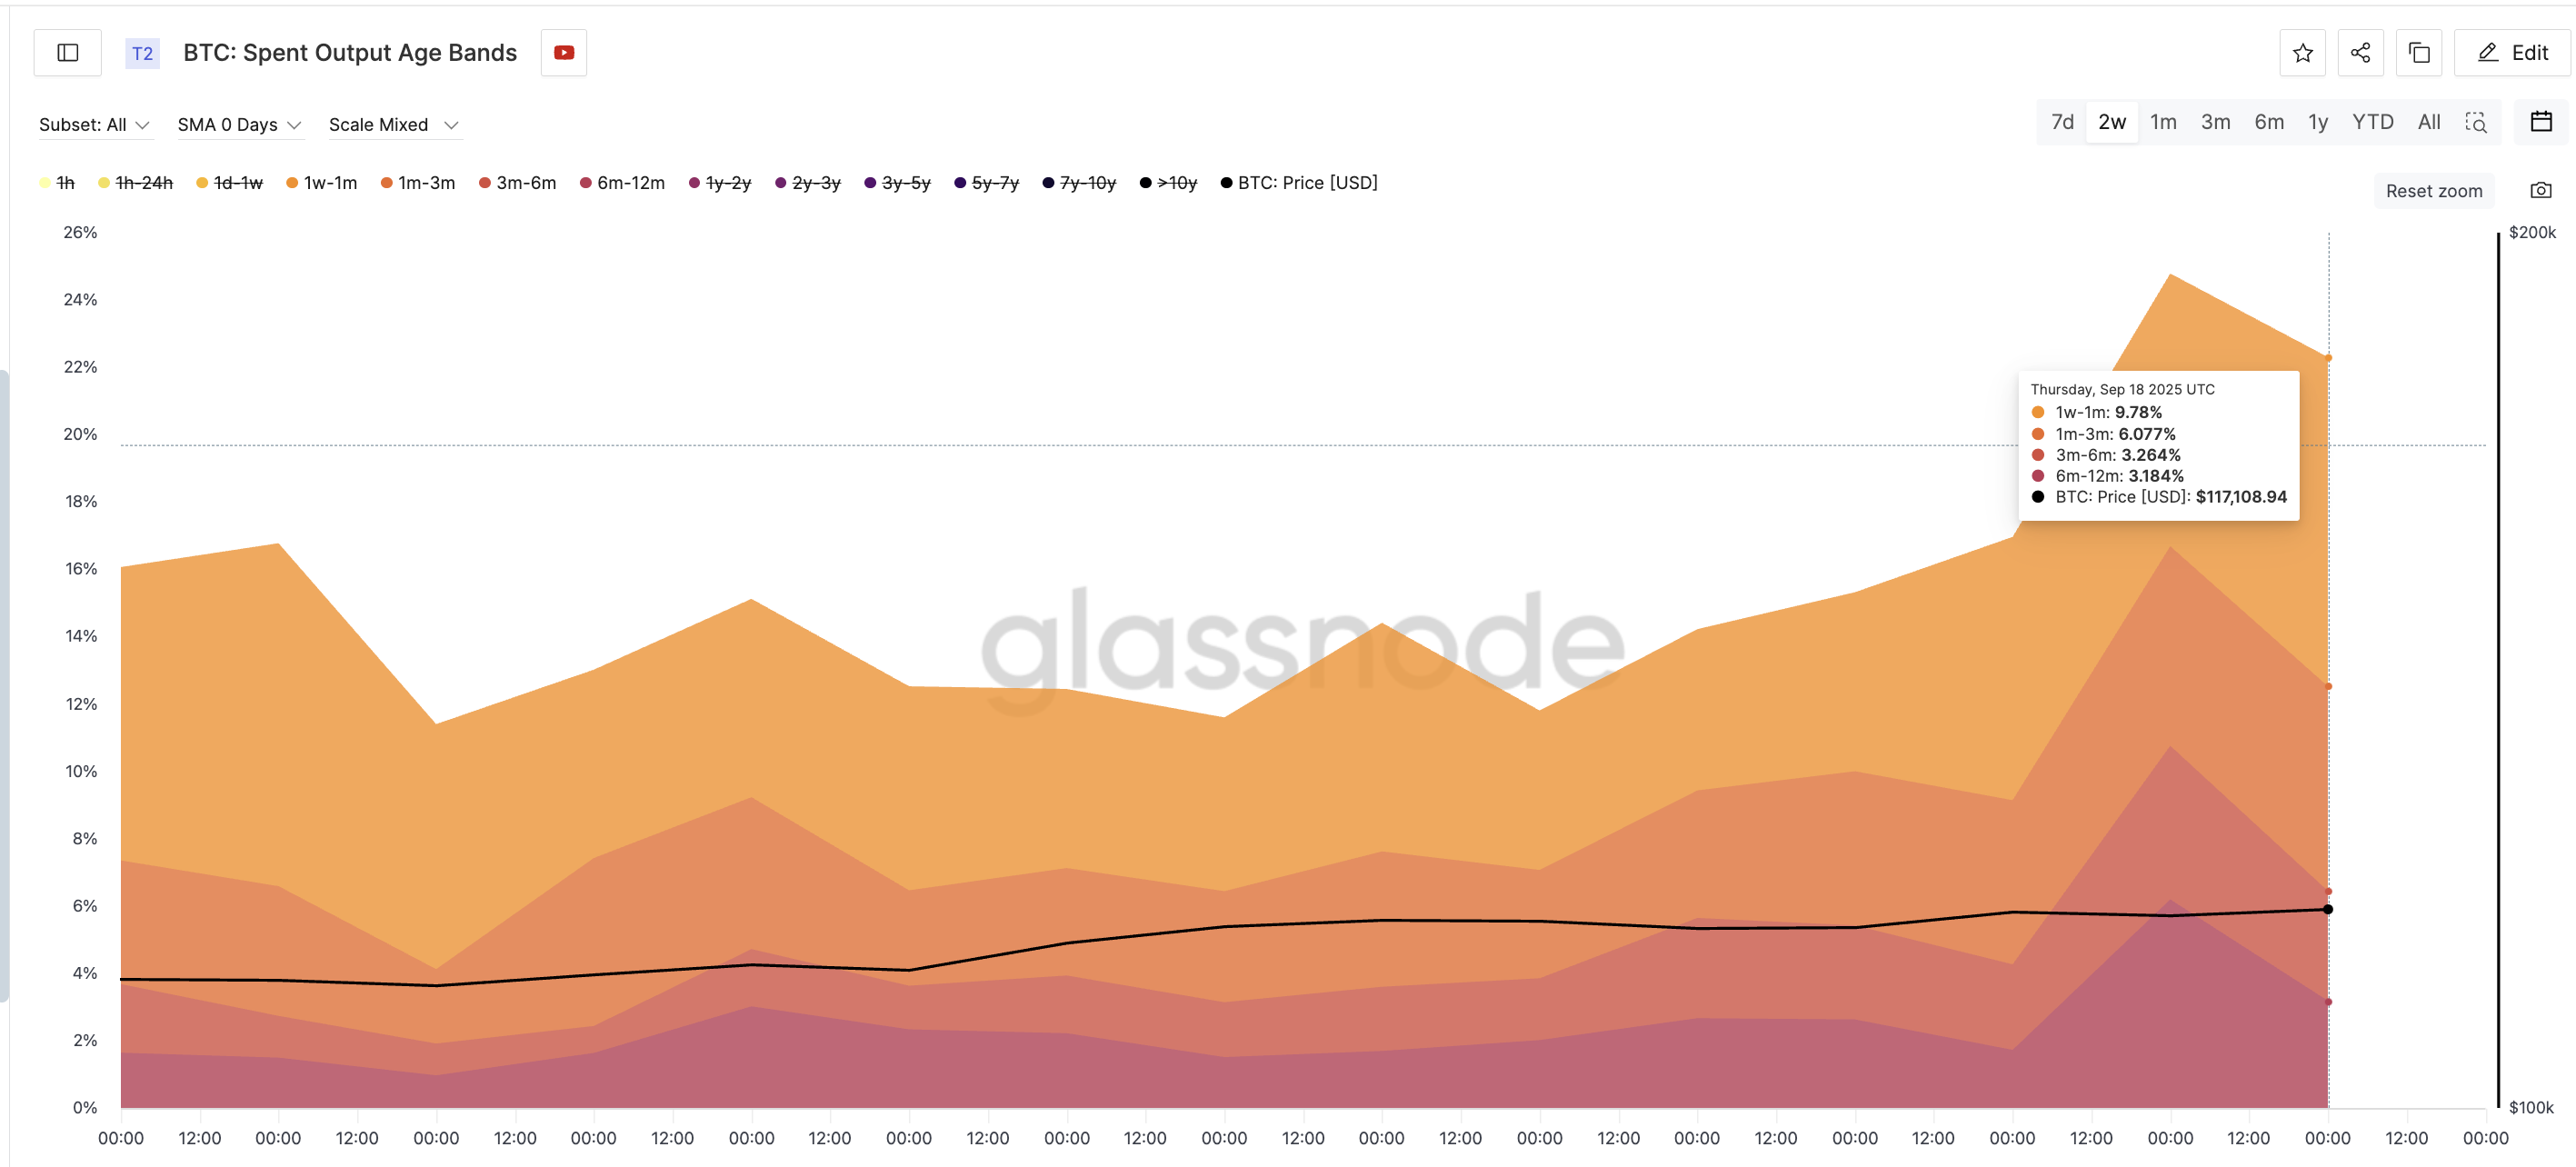
These cohorts are considered “younger” because they bought or moved their coins within the last year. Unlike long-term holders who keep Bitcoin for multiple years, younger holders are quicker to sell into bitcoin price rallies.
The rise across all four bands means more short- to mid-term holders might be cashing out. This aligns with the selling already visible from the big balance groups, forming a clear picture of near-term supply pressure.
Bitcoin Price Chart Still Points Higher, But With Risks
Despite the selling signs, the broader technical setup remains bullish. bitcoin broke above an inverse head-and-shoulders pattern on September 10, and the breakout level has held since then. As long as the Bitcoin price stays above $114,900, the immediate upside target remains at $120,800.
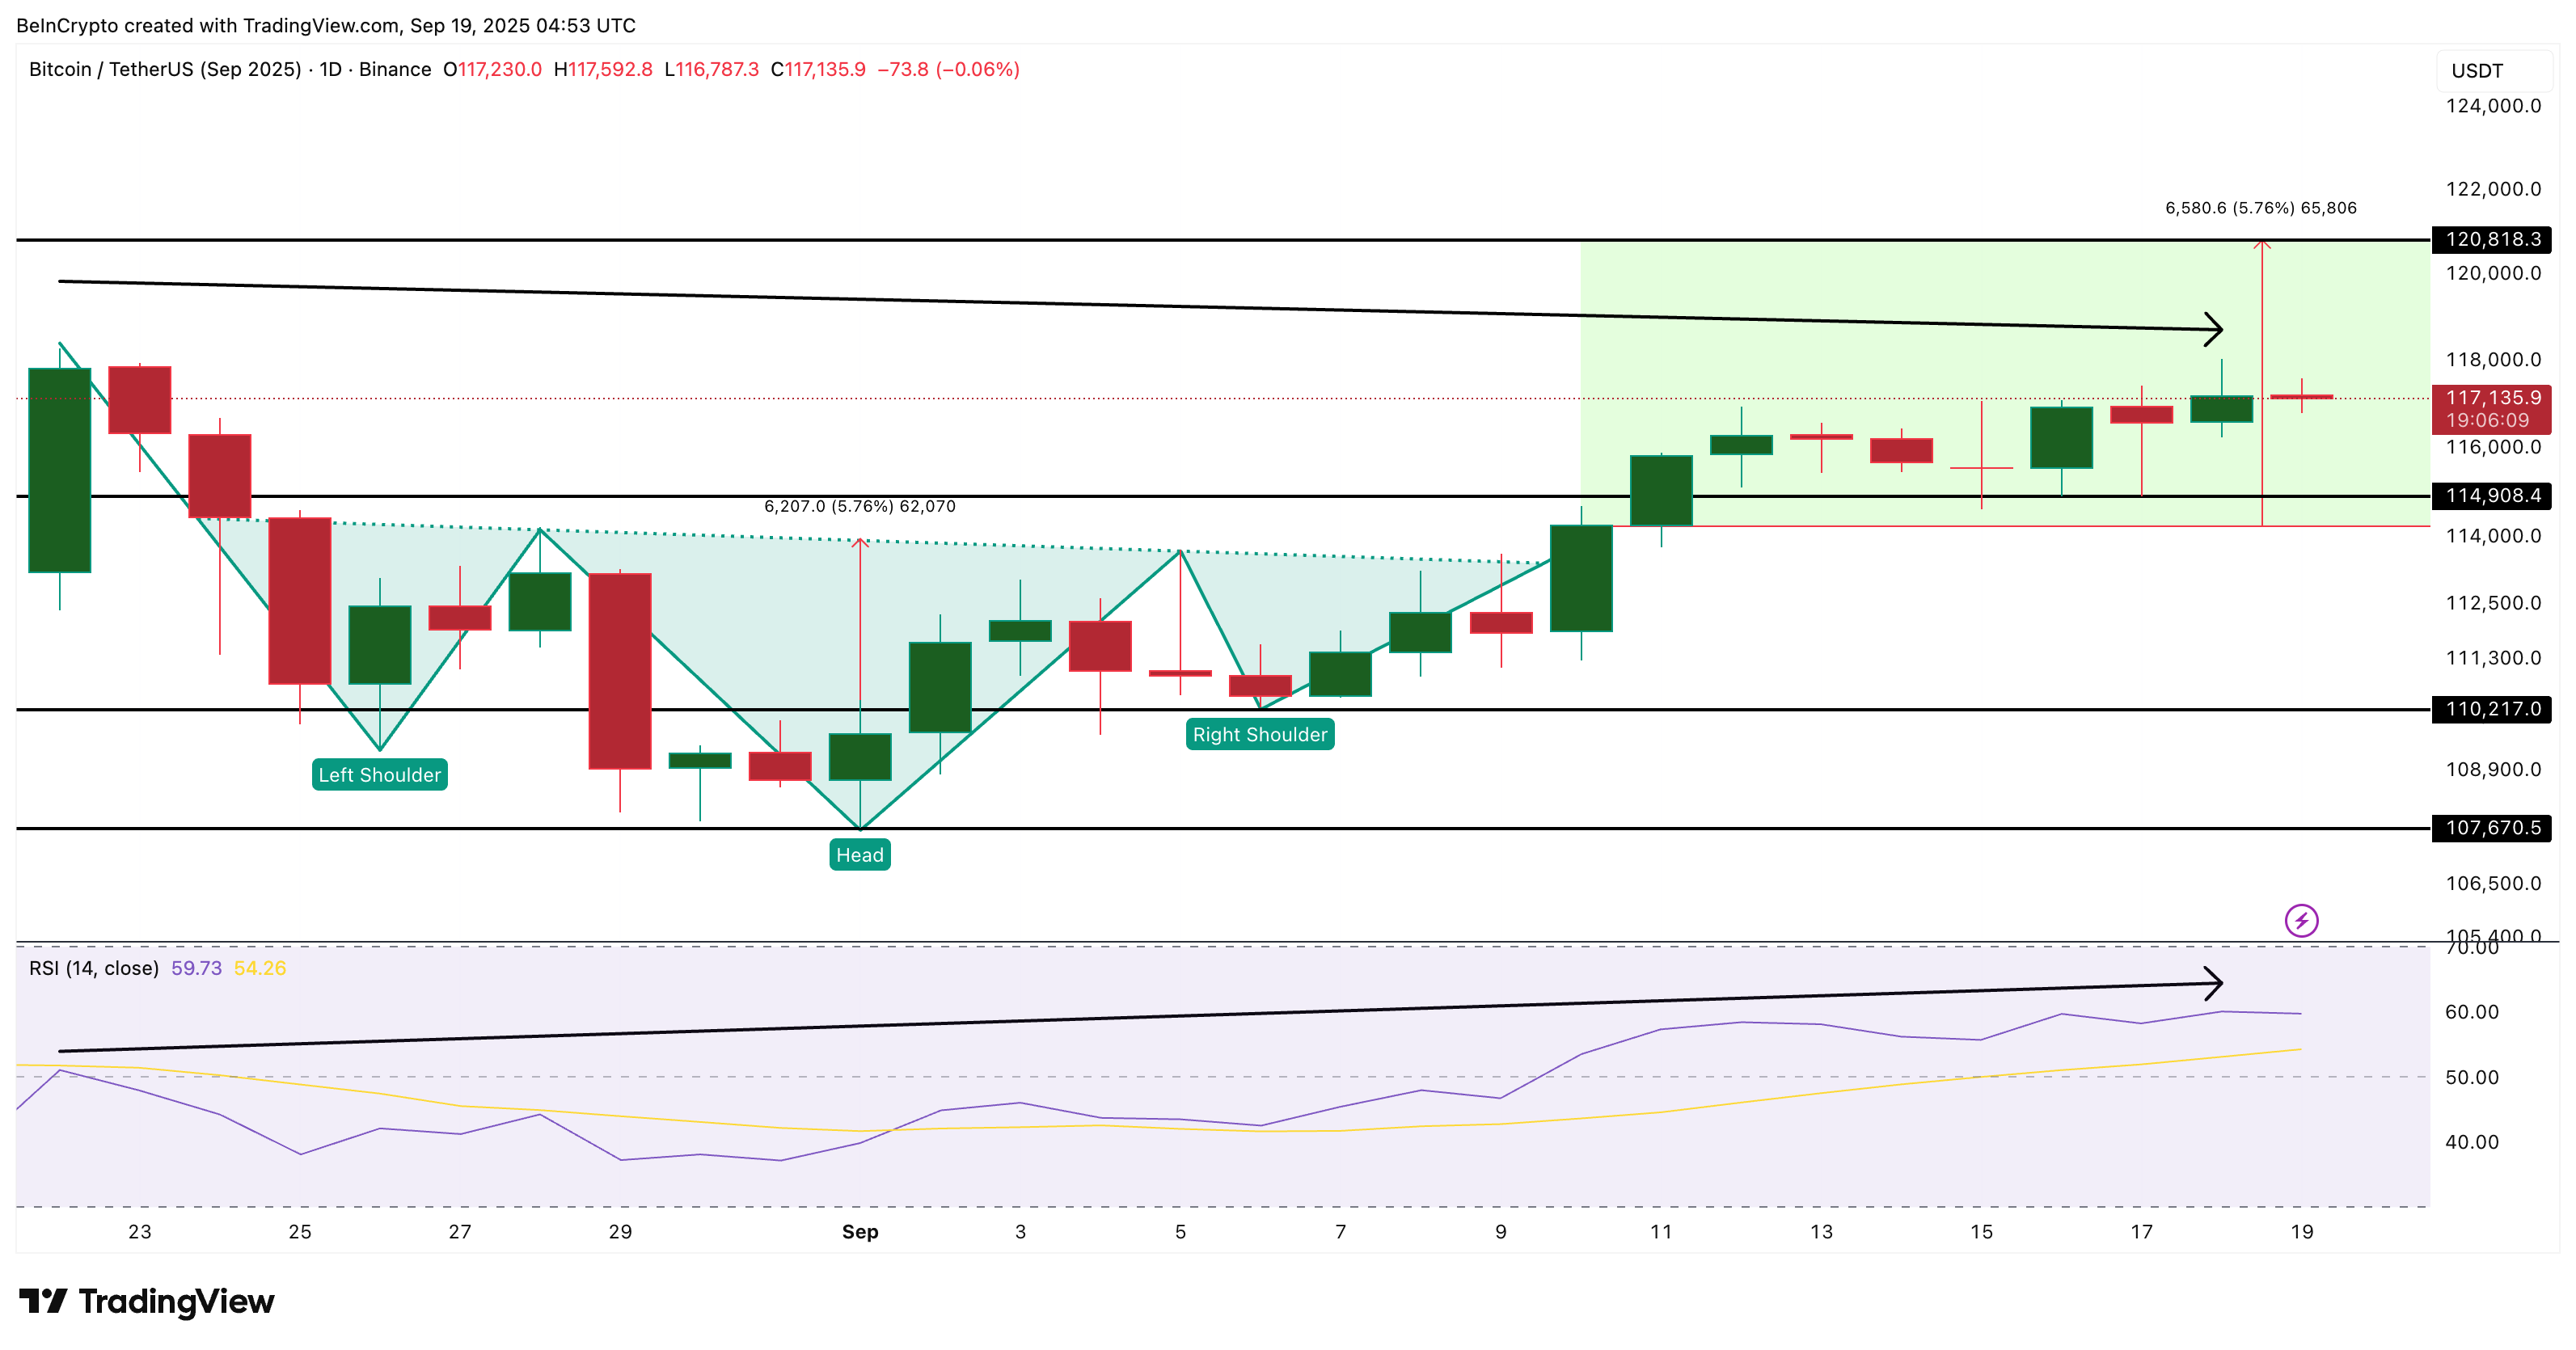
However, a dip toward $114,900 looks more realistic in the short term, as RSI data has flashed another risk. Between August 22 and September 18, Bitcoin’s price formed lower highs while RSI made higher highs.
This hidden bearish divergence often signals that momentum is slowing, leaving room for a brief 2% pullback (the immediate and strongest support level).
Yet, if the Bitcoin price dips under $114,900, the pullback could stretch further toward $110,000. A daily close under that level WOULD weaken the bullish structure.
