Ethereum Price Flashes New $5,400+ Target As Key Metric Drops To 6-Month Low

Ethereum's price trajectory just got a major boost—targeting $5,400+ as a critical on-chain metric hits its lowest point in half a year.
Breaking Down the Momentum
The network's key indicator plummeting to a six-month low signals reduced selling pressure, fueling bullish sentiment across crypto markets. Traders are repositioning, derivatives volumes are surging, and institutional interest refuses to fade—even as traditional finance scrambles to keep up.
Why This Rally Feels Different
Unlike past pumps driven purely by retail hype, this move combines technical strength with fundamental network activity. DeFi protocols are buzzing, NFT volumes are creeping upward, and Layer-2 adoption keeps accelerating. It’s almost like building actual utility matters—who knew?
Where Ethereum Goes From Here
With the $5,400 target in sight, resistance levels look increasingly fragile. The market’s pricing in continued momentum, though a word of caution: in crypto, even the surest bets come with a side of volatility. After all, what’s a 20% dip between friends?
Closing Thought: Wall Street might still be debating whether crypto is ‘real,’ but Ethereum’s chart isn’t asking for permission—it’s charging ahead. Maybe the suits will catch up eventually. Or not.
Selling Pressure Falls To A Six-Month Low
The clearest sign of reduced selling came from the “Spent Coins Age Band.” This metric tracks how many coins are leaving wallets to be sold on the blockchain. When the number falls, it means fewer holders are cashing out.
On September 17, the total number of coins spent across all bands stood at about 257,000 ETH. By today, that number had dropped to just 42,700 ETH, a fall of almost 83.5% and the lowest level in six months.
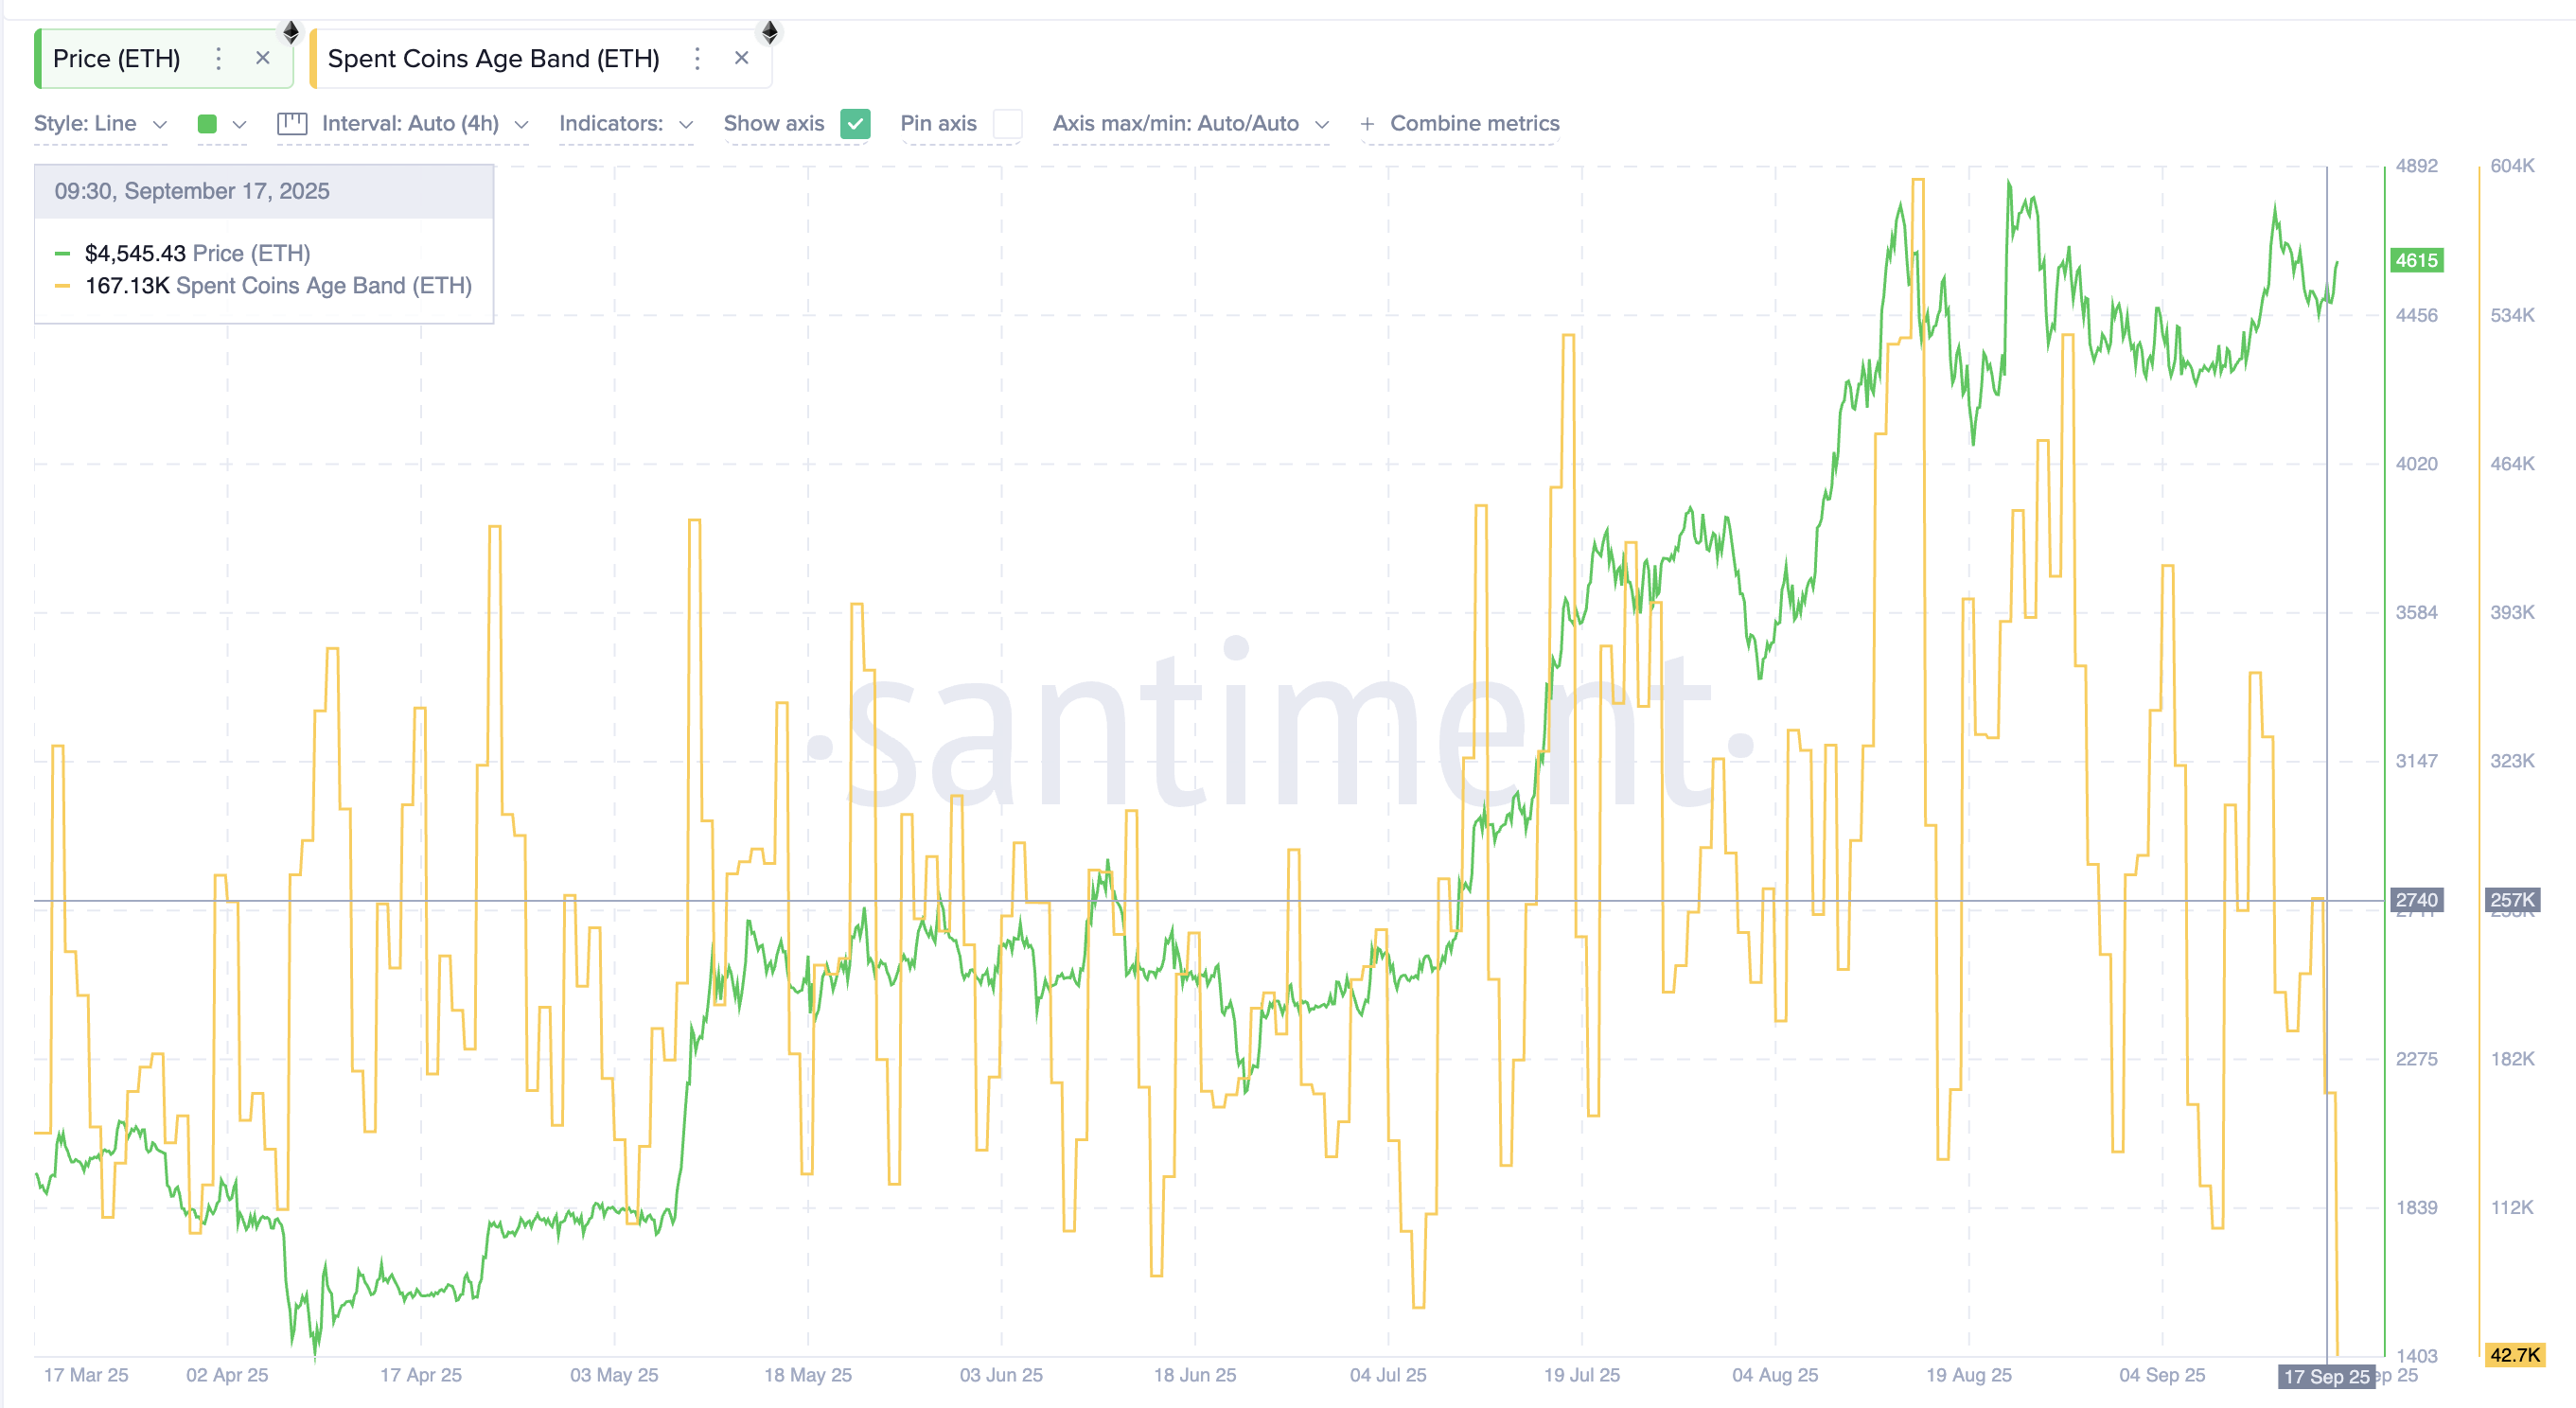
Such a steep drop suggests that many holders who could have sold are instead holding back. This sharp reduction in supply pressure gives the ETH price more room to move higher if demand continues to build.
Sign up for Editor Harsh Notariya’s Daily crypto Newsletter here.
Profits And Exchange Flows Confirm The Drop In Selling Pressure
The sharp fall in spent coins is not alone. Two other on-chain metrics — NUPL and exchange flows — show the same direction.
NUPL, or Net Unrealized Profit and Loss, tracks how many wallets are showing paper profits or losses. On September 16, NUPL made a local low. It has since curled up to above $0.50, now at almost the same level as seen on September 11. This pattern led Ethereum’s price to rise close to 6% then.
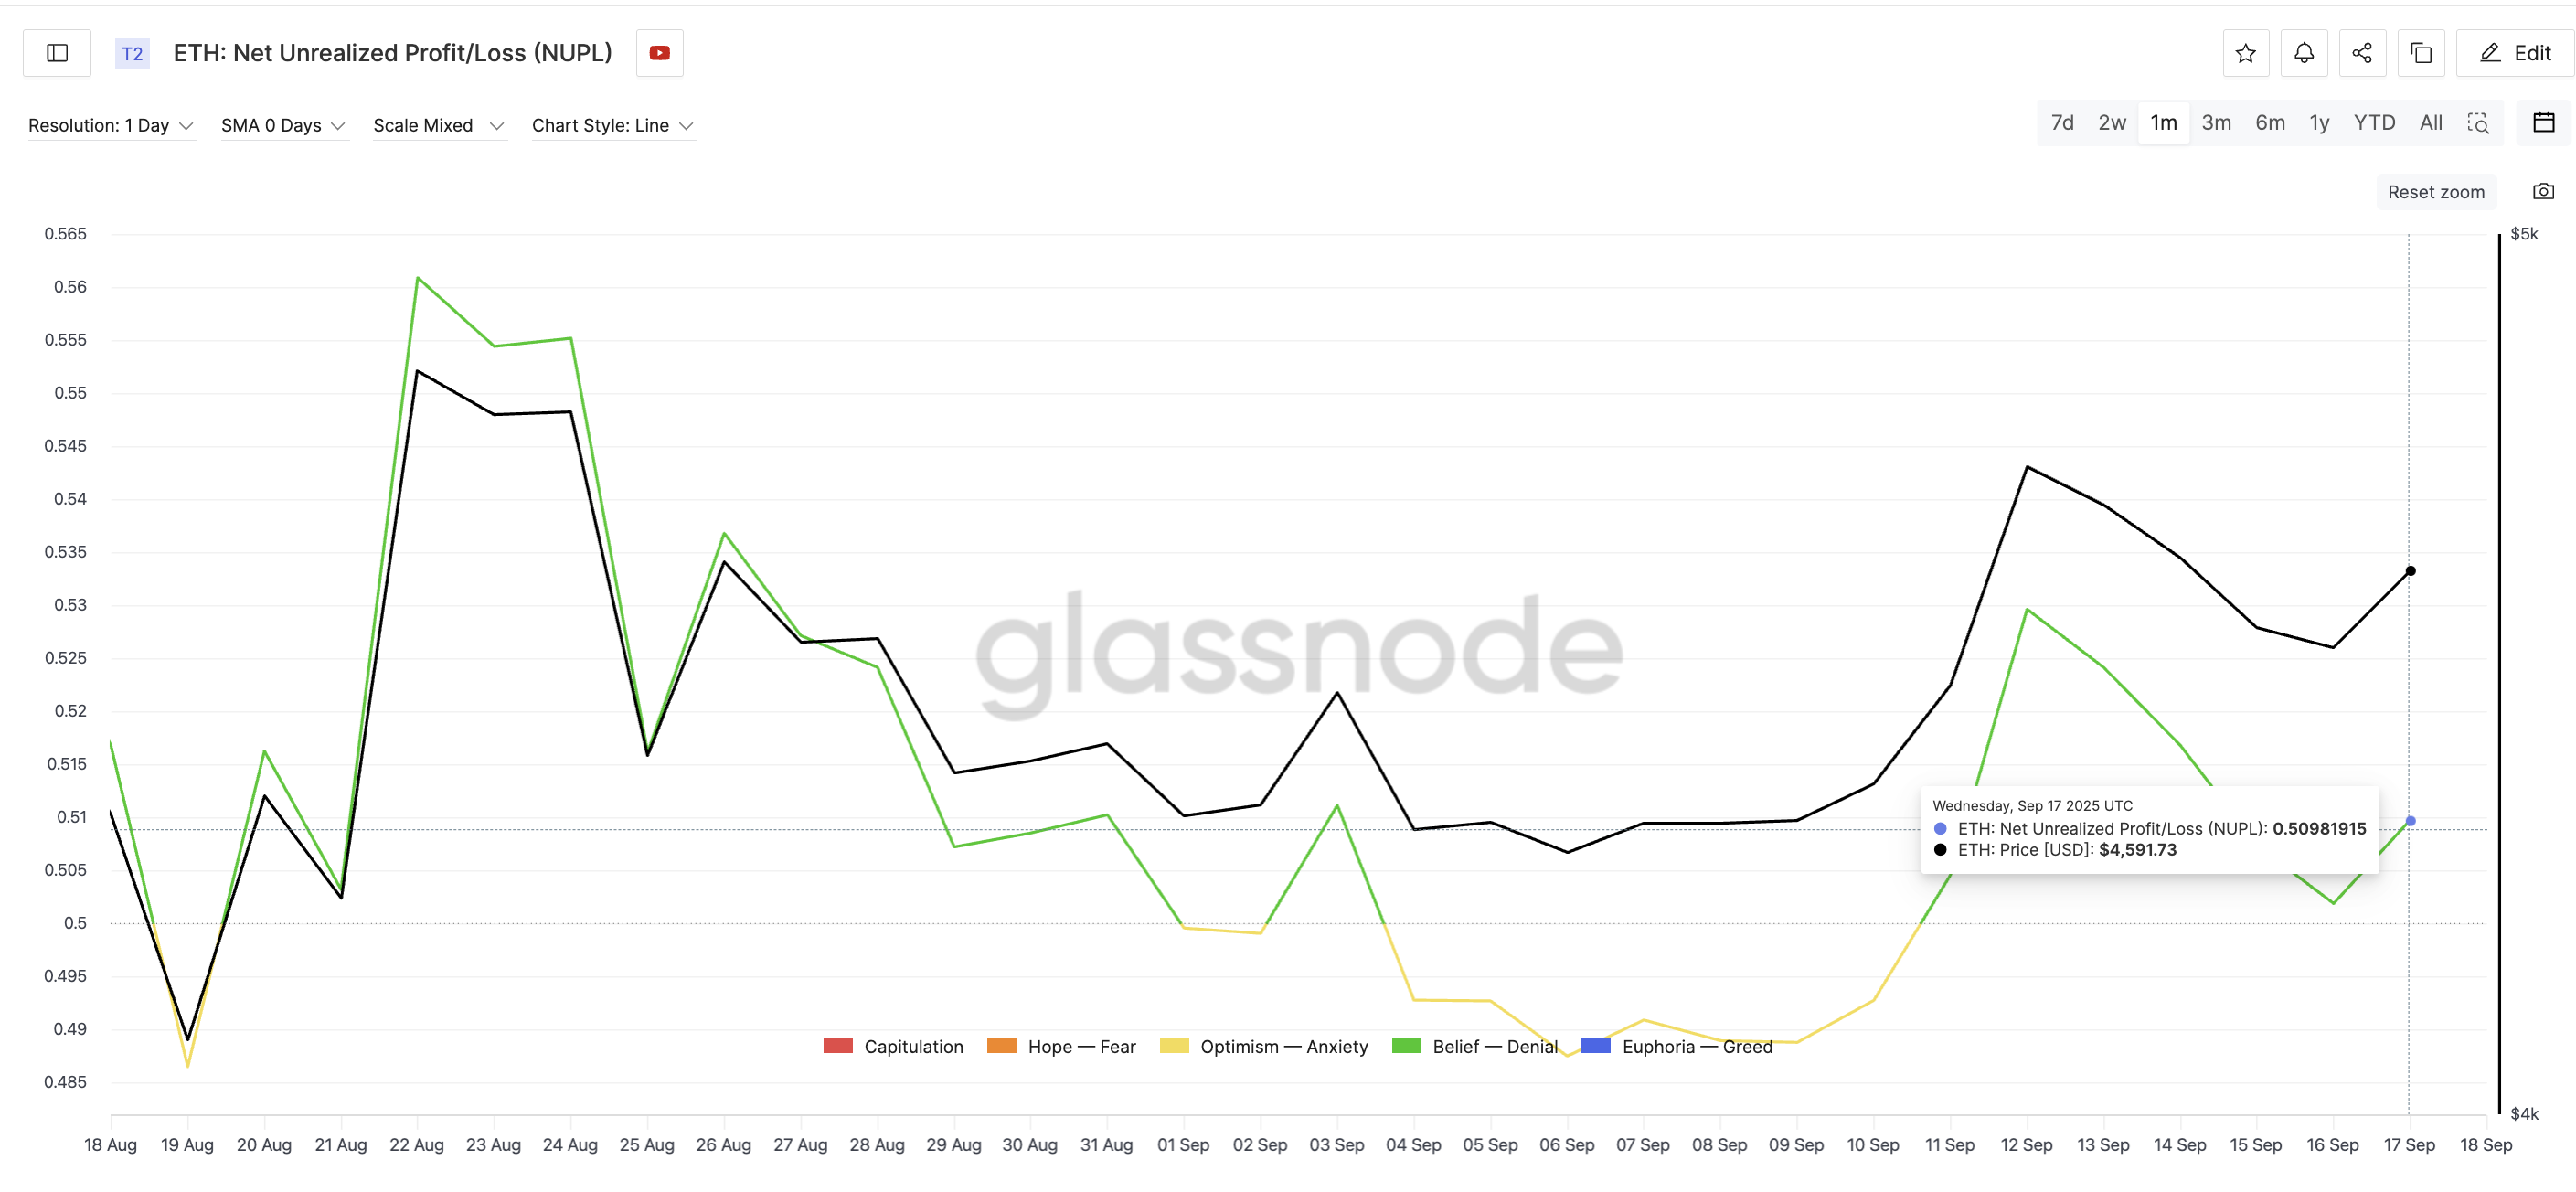
A dip in NUPL at higher price levels means fewer wallets are sitting on easy profits. That usually happens because short-term traders might have already sold, leaving behind stronger holders who are less likely to sell their coins during every rally.
This view is backed by exchange net position change, which shows whether coins are moving into or out of exchanges. More coins on exchanges often mean more selling, while outflows mean accumulation.
Since September 14, outflows have grown from about –147,600 ETH to –159,000 ETH, an 8% rise. This confirms that more Ethereum is leaving trading platforms, a sign of steady buying pressure.
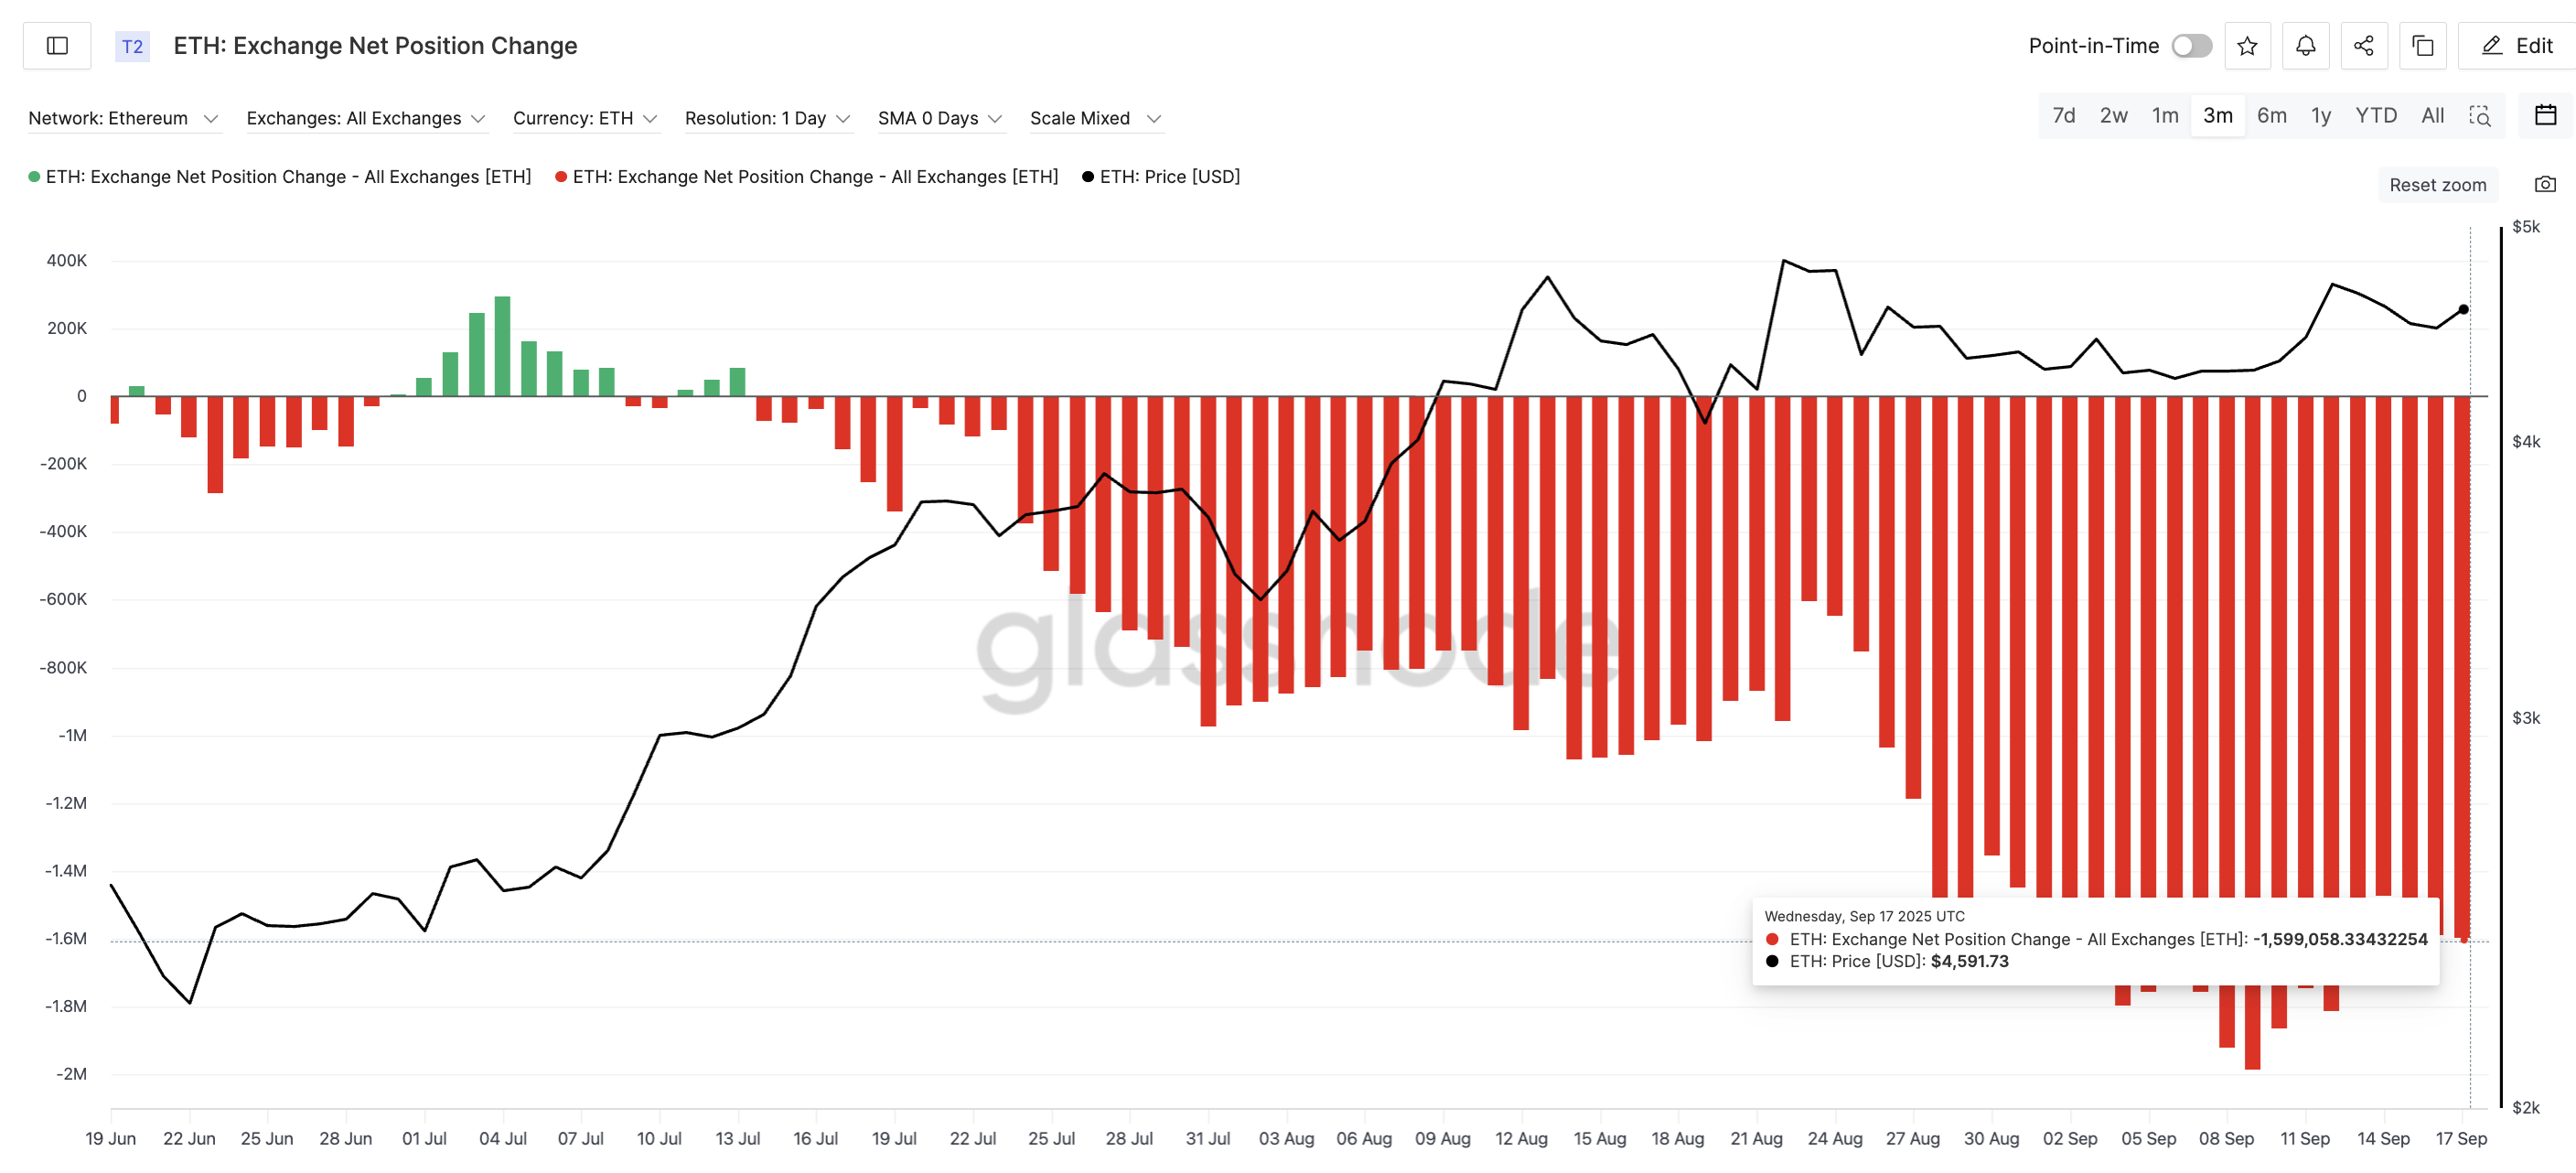
These trends reveal the same story: weak hands are out, selling pressure is fading, and buyers are quietly taking control.
Ethereum Price Chart Points To $5,430 Target
Ethereum has now broken out of a bullish cup-and-handle formation. Breaking out of the handle often means that selling pressure has eased because short-term holders who were selling into rallies are mostly gone.
The neckline of this pattern sits near $4,765. If the ethereum price closes above that line, the breakout target stretches toward $5,430, which would be a fresh yearly high.
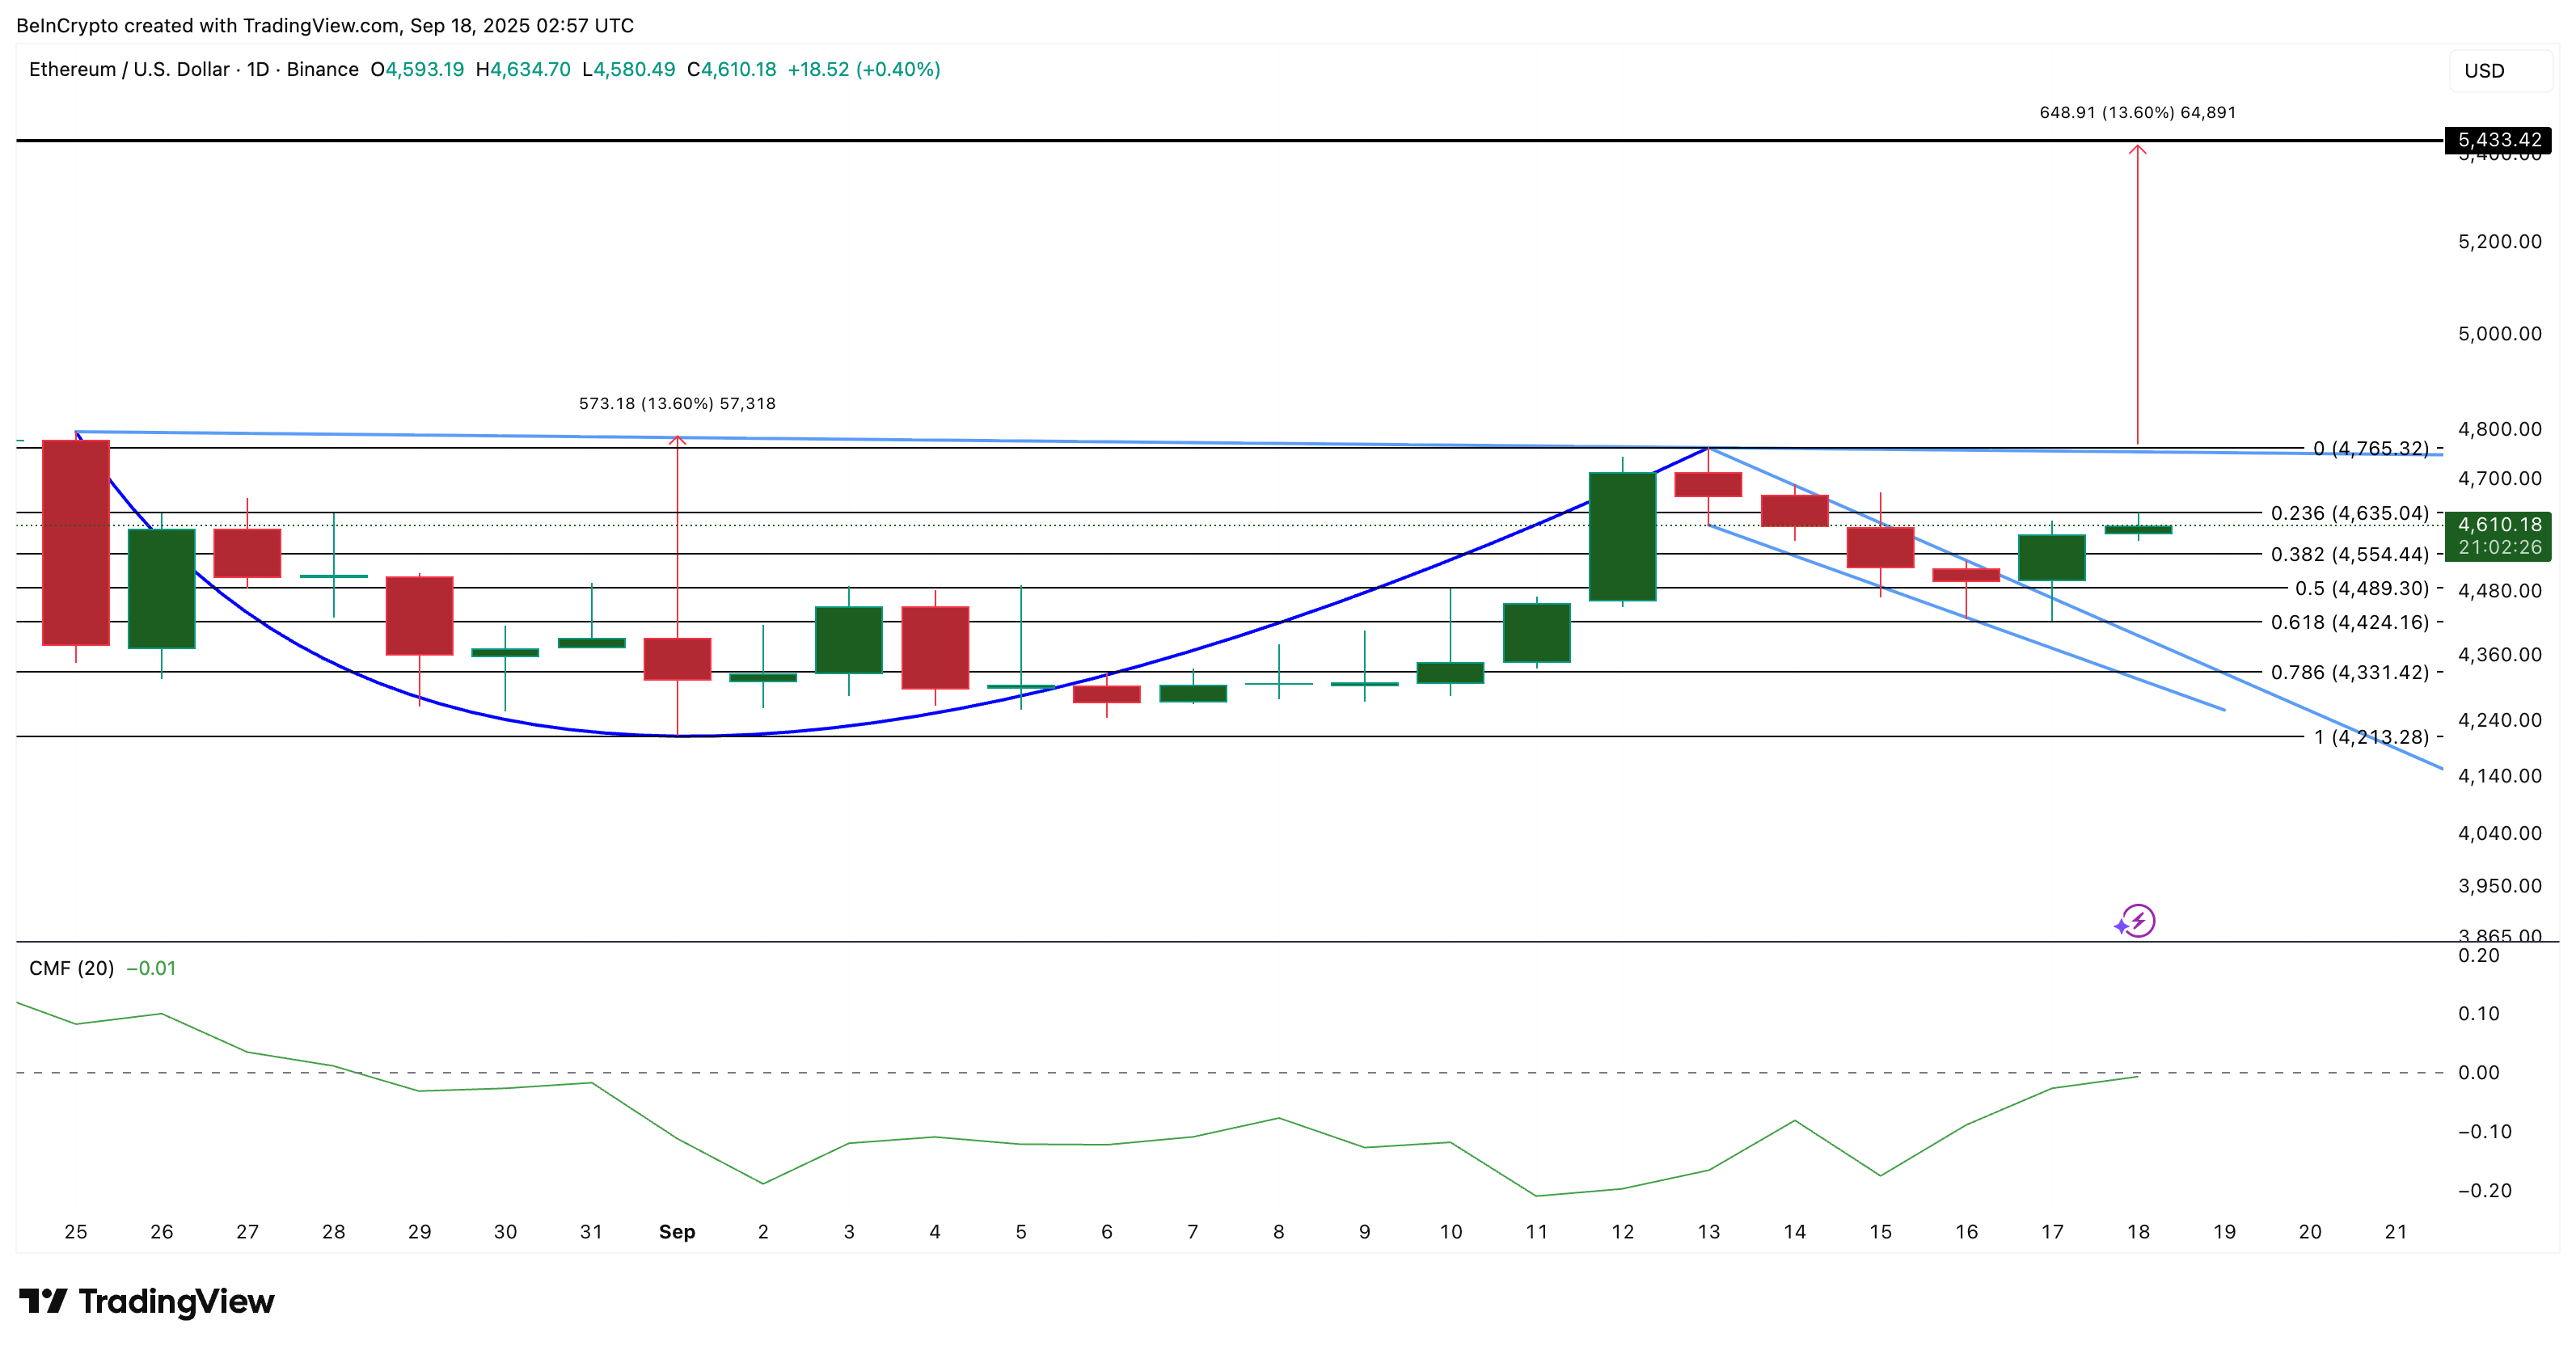
Another key sign is the Chaikin Money Flow (CMF), which tracks whether money is moving into or out of the market. CMF has climbed from -0.18 on September 15 and is now close to the zero line as the handle breakout happened. If it crosses into positive territory, it WOULD confirm that new money is entering alongside the chart breakout.
Support remains firm at $4,489 and $4,424. If Ethereum falls below $4,213, the bullish setup would be invalidated, and buyers may need to wait for a new pattern to form.
