HBAR Tumbles From 20-Day Peak as Liquidity Evaporates and Bears Seize Control

Just when HBAR bulls thought they had momentum, the rug got pulled—hard. The token's retreat from its 20-day high signals more than just profit-taking; it's a liquidity crisis in the making.
Money flow metrics have flatlined. Trading volumes dried up faster than a puddle in the desert, and the bears aren't just lurking—they're running the show now. Remember when 'number go up' was the mantra? Yeah, those days feel like a distant memory.
Here's the kicker: the so-called 'smart money'? They've already jumped ship, leaving retail bag-holders staring at red candles. Classic crypto—where the only thing more volatile than the charts are the excuses from the 'HODL forever' crowd.
Don't expect a miracle rebound. Without fresh capital, HBAR's looking at a classic crypto comedown. But hey, in a market where 'fundamentals' are just something to ignore until they're not, who knows? Maybe another Elon tweet will save the day. Sure it will.
HBAR’s Rally Stalls as Traders Exit and Short Positions Surge
Since its price decline began on Sunday, HBAR’s Money FLOW Index (MFI) has also trended downward slowly, highlighting the slowdown in token accumulation across the market.
: Want more token insights like this? Sign up for Editor Harsh Notariya’s Daily crypto Newsletter here.
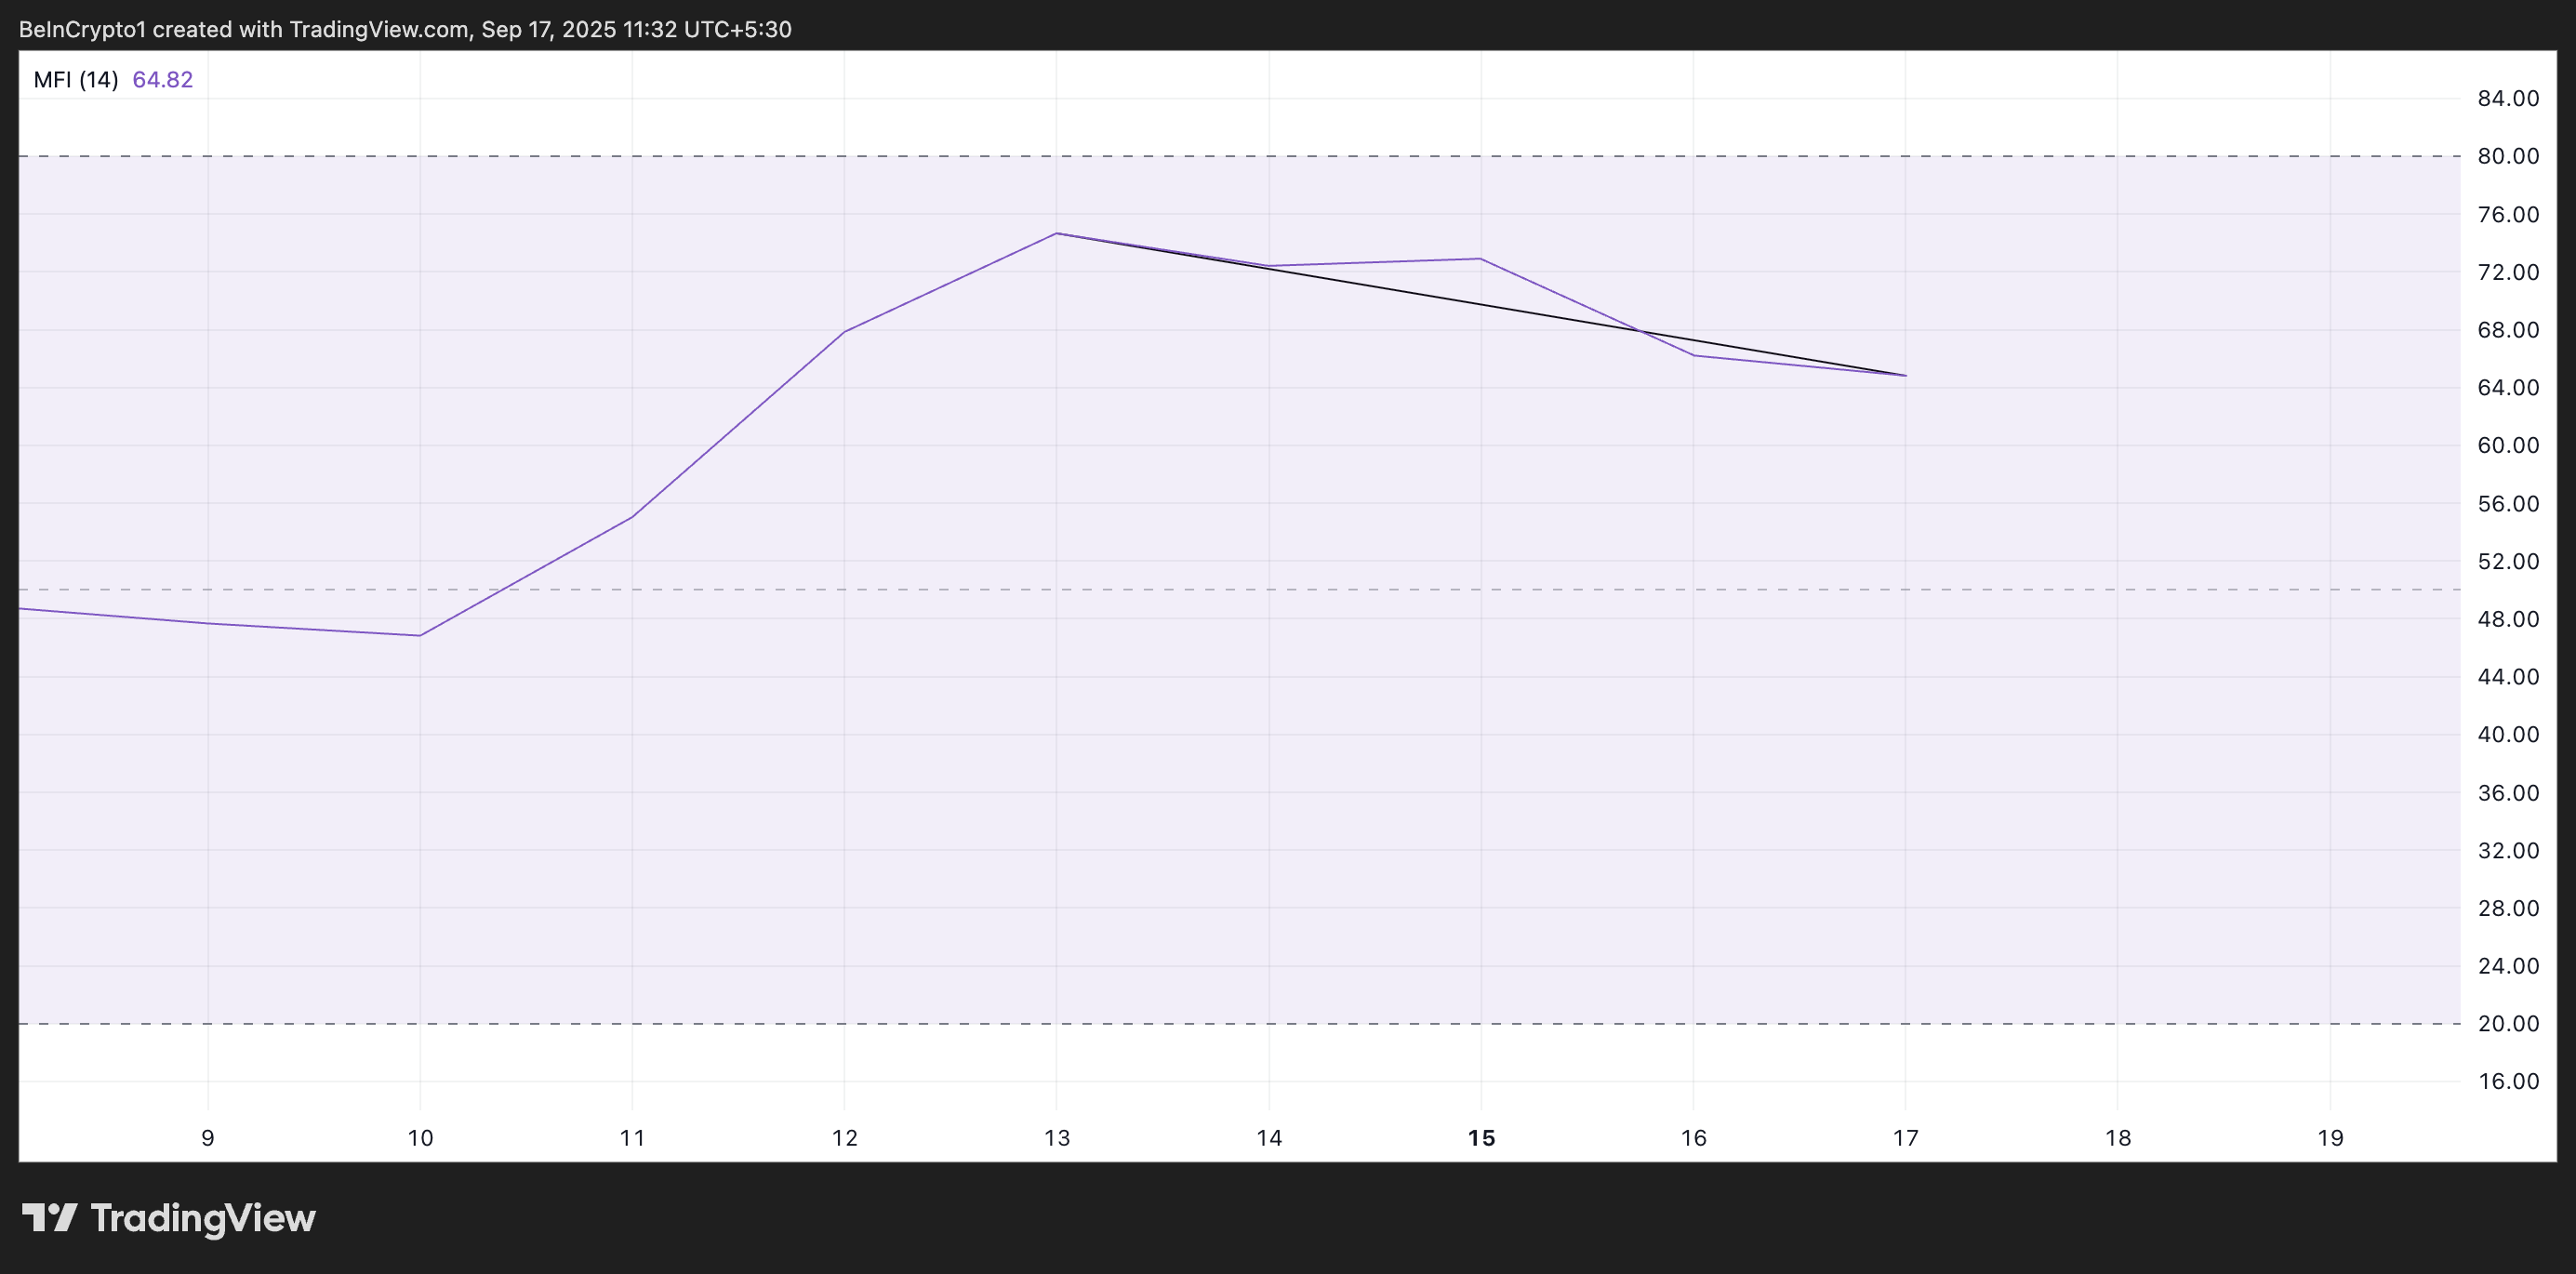
The MFI indicator gauges the strength of capital inflows into an asset by tracking its price and trading volume. It climbs when traders are actively accumulating, signaling increased liquidity and stronger buy-side demand.
In contrast, a falling MFI reflects weakening inflows as investors scale back their exposure. Therefore, HBAR’s falling MFI shows that accumulation has slowed significantly since its 20-day peak, exposing the altcoin to additional downside pressure.
Moreover, data from Coinglass shows a bearish tilt in derivatives positioning, supporting the negative outlook above.
According to the on-chain data provider, HBAR’s long/short ratio continues to fall, signaling that traders are increasingly betting against the token. As of this writing, this is at 0.86.
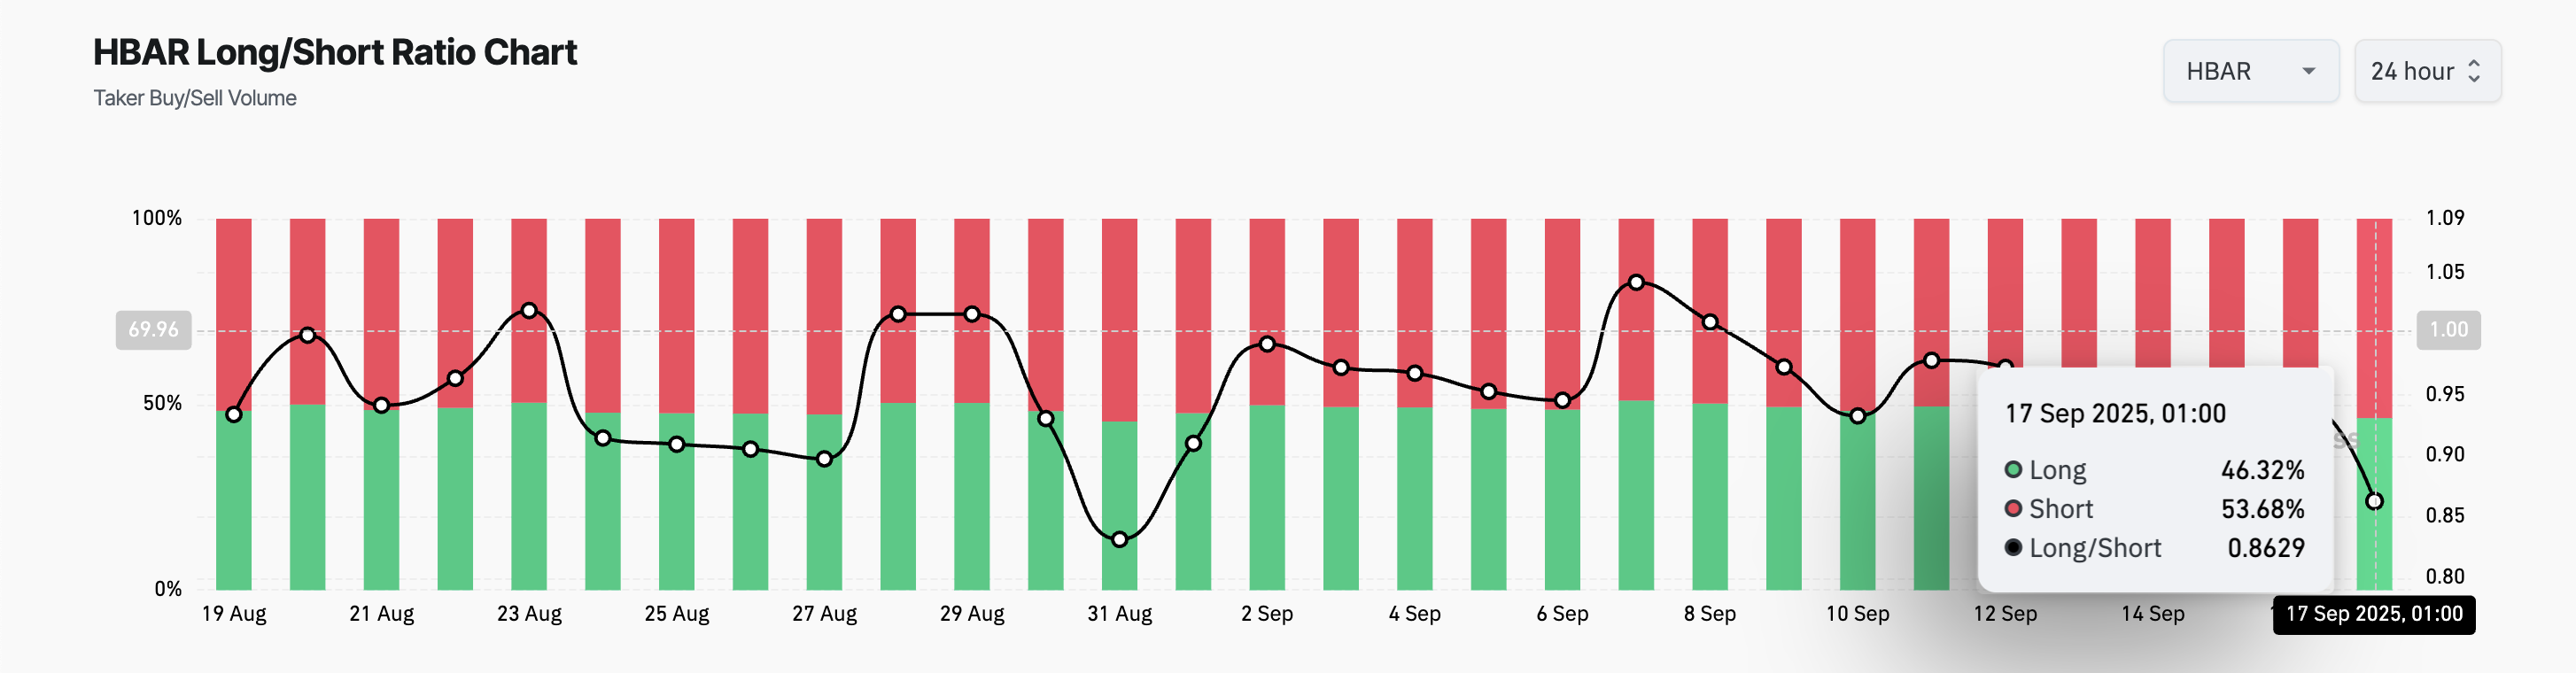
The long/short ratio measures the balance between bullish and bearish positions. A reading above one means more traders expect prices to rise, while a ratio below 1, as with HBAR, shows most are betting on further declines.
This points to stronger bearish sentiment and expectations of continued downside.
HBAR Bears Tighten Grip, But $0.2762 Rebound Still in Play
With capital inflows drying up and short demand climbing, HBAR appears vulnerable to further losses in the NEAR term. Unless new buying support emerges to offset the bearish trend, the token’s price could fall to $0.2123 over the next few trading sessions.
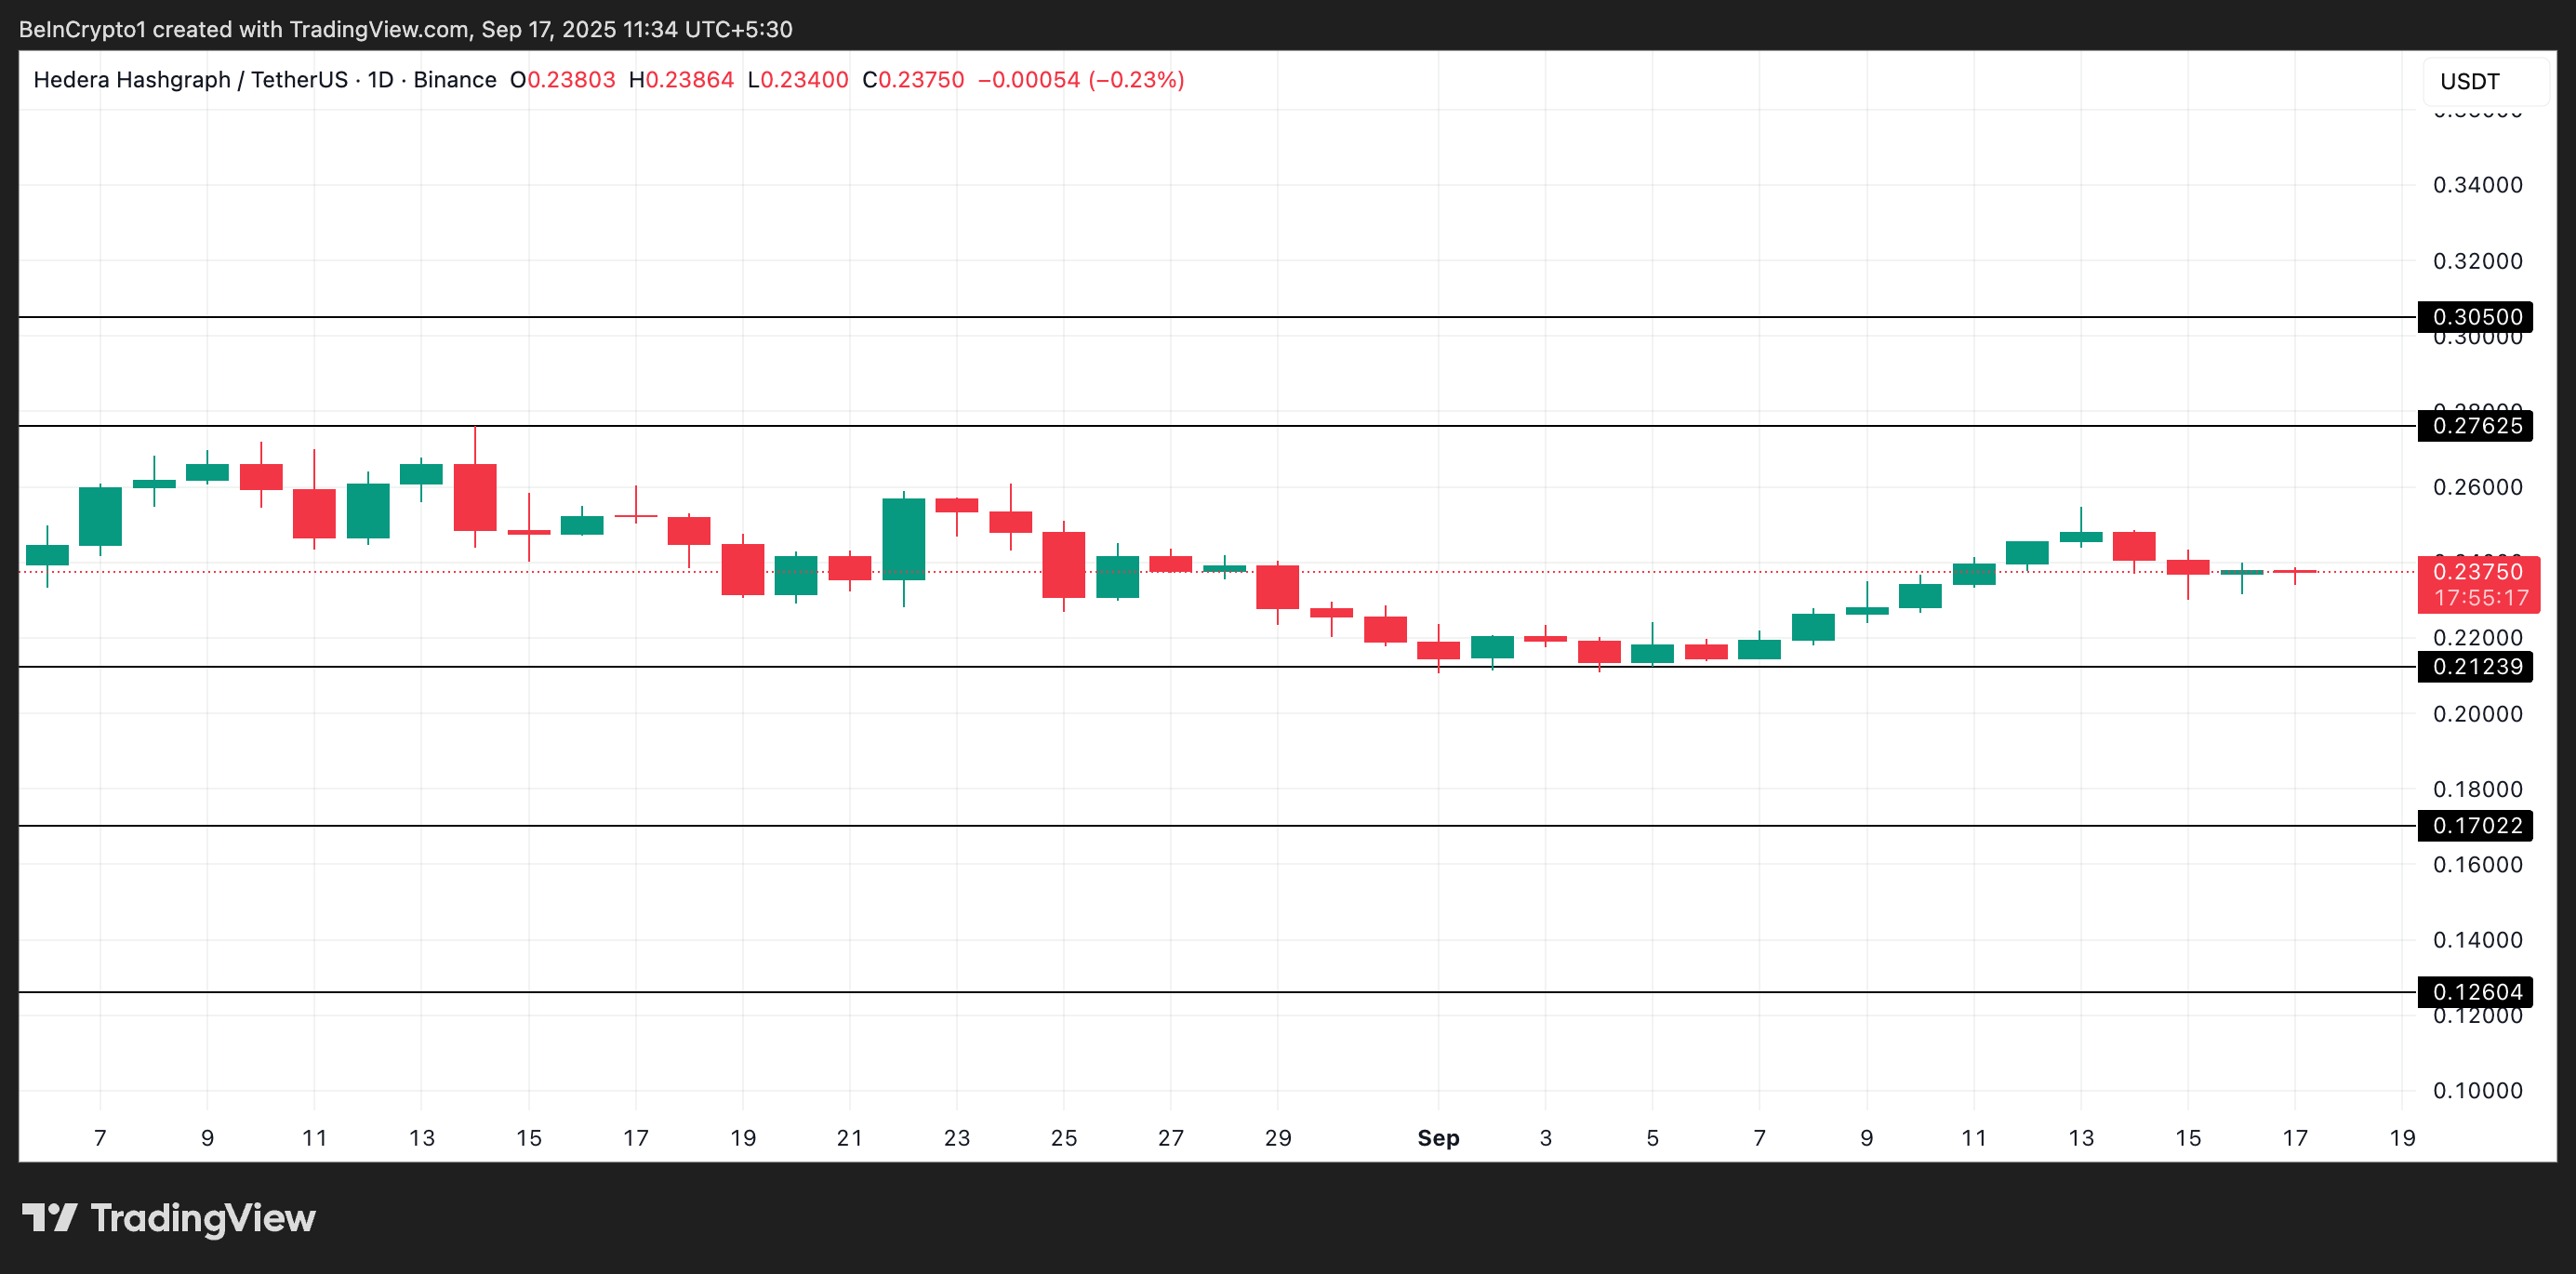
However, if the bulls regain control and accumulation resumes, HBAR could reverse its decline and rally toward $0.2762.
