Solana’s Rally Targets $284 Amid Pullback Warnings - Here’s What Traders Are Watching

Solana bulls charge toward $284 as momentum builds—but warning signs flash at local resistance levels.
Technical Tensions Mount
The push toward $284 isn't coming easy. Resistance patterns suggest a classic 'two steps forward, one step back' scenario might unfold. Traders eye key support levels while hedging against potential downside moves.
Market Psychology in Play
Every rally breeds both FOMO and skepticism. Current price action shows retail piling in while whales quietly take profits—because nothing says 'crypto markets' like the little guy buying what the big players are selling.
Volume and volatility tell the real story here. Liquidity clusters near $284 create a magnetic price target, but getting there requires clearing several technical hurdles first.
Whether this becomes another 'number goes up' story or a lesson in resistance depends entirely on whether buyers can sustain momentum through the current turbulence.
Overheating Signals Point to Only A Pullback as Accumulation Stays Strong
One reason to expect a pause is Solana’s MVRV Z-Score, a valuation metric that compares market value to realized value.
A higher score suggests the asset is leaning toward overvaluation or a local top. On September 12, the MVRV Z-Score spiked to 1.34, its highest in six months. Local peaks in July and August triggered double-digit corrections as they aligned with local Solana price tops.
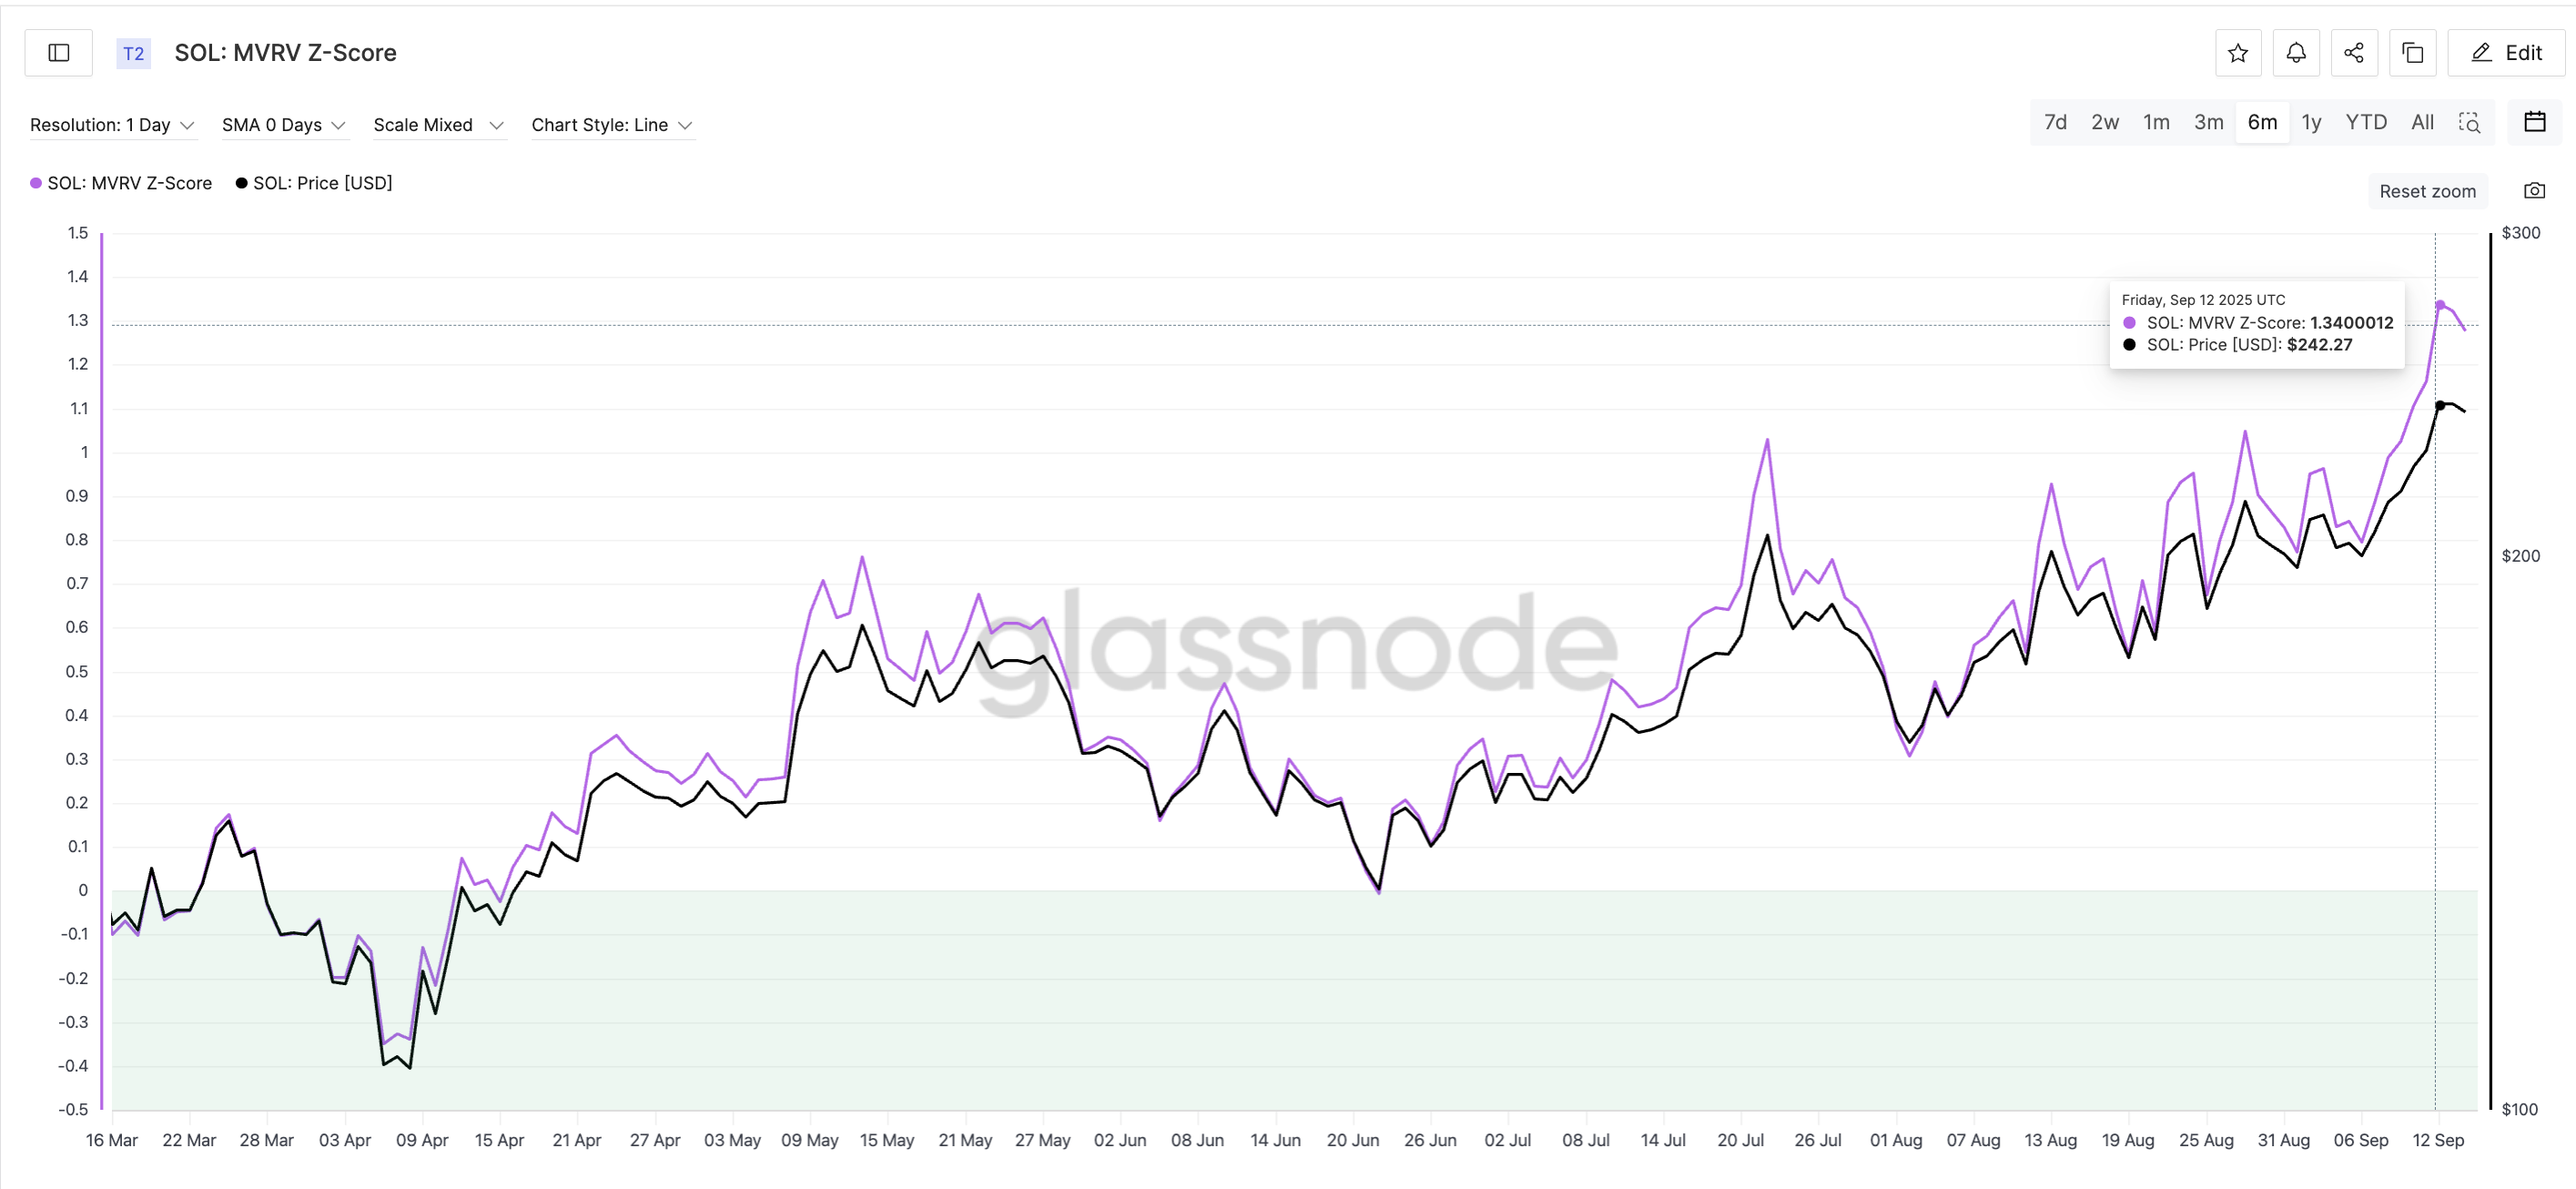
- July 22: MVRV hit 1.03 when SOL was $205. Solana price later corrected to $158, a drop of about 23%.
- August 13: MVRV peaked at 0.92 when SOL was $201, and price slid to $176, a 12% dip.
Sign up for Editor Harsh Notariya’s Daily crypto Newsletter here.
This makes the latest high concerning. But the context today is different.
During those earlier local top-induced drops, the exchange net position change turned strongly positive, showing tokens being sent onto exchanges, adding selling pressure.
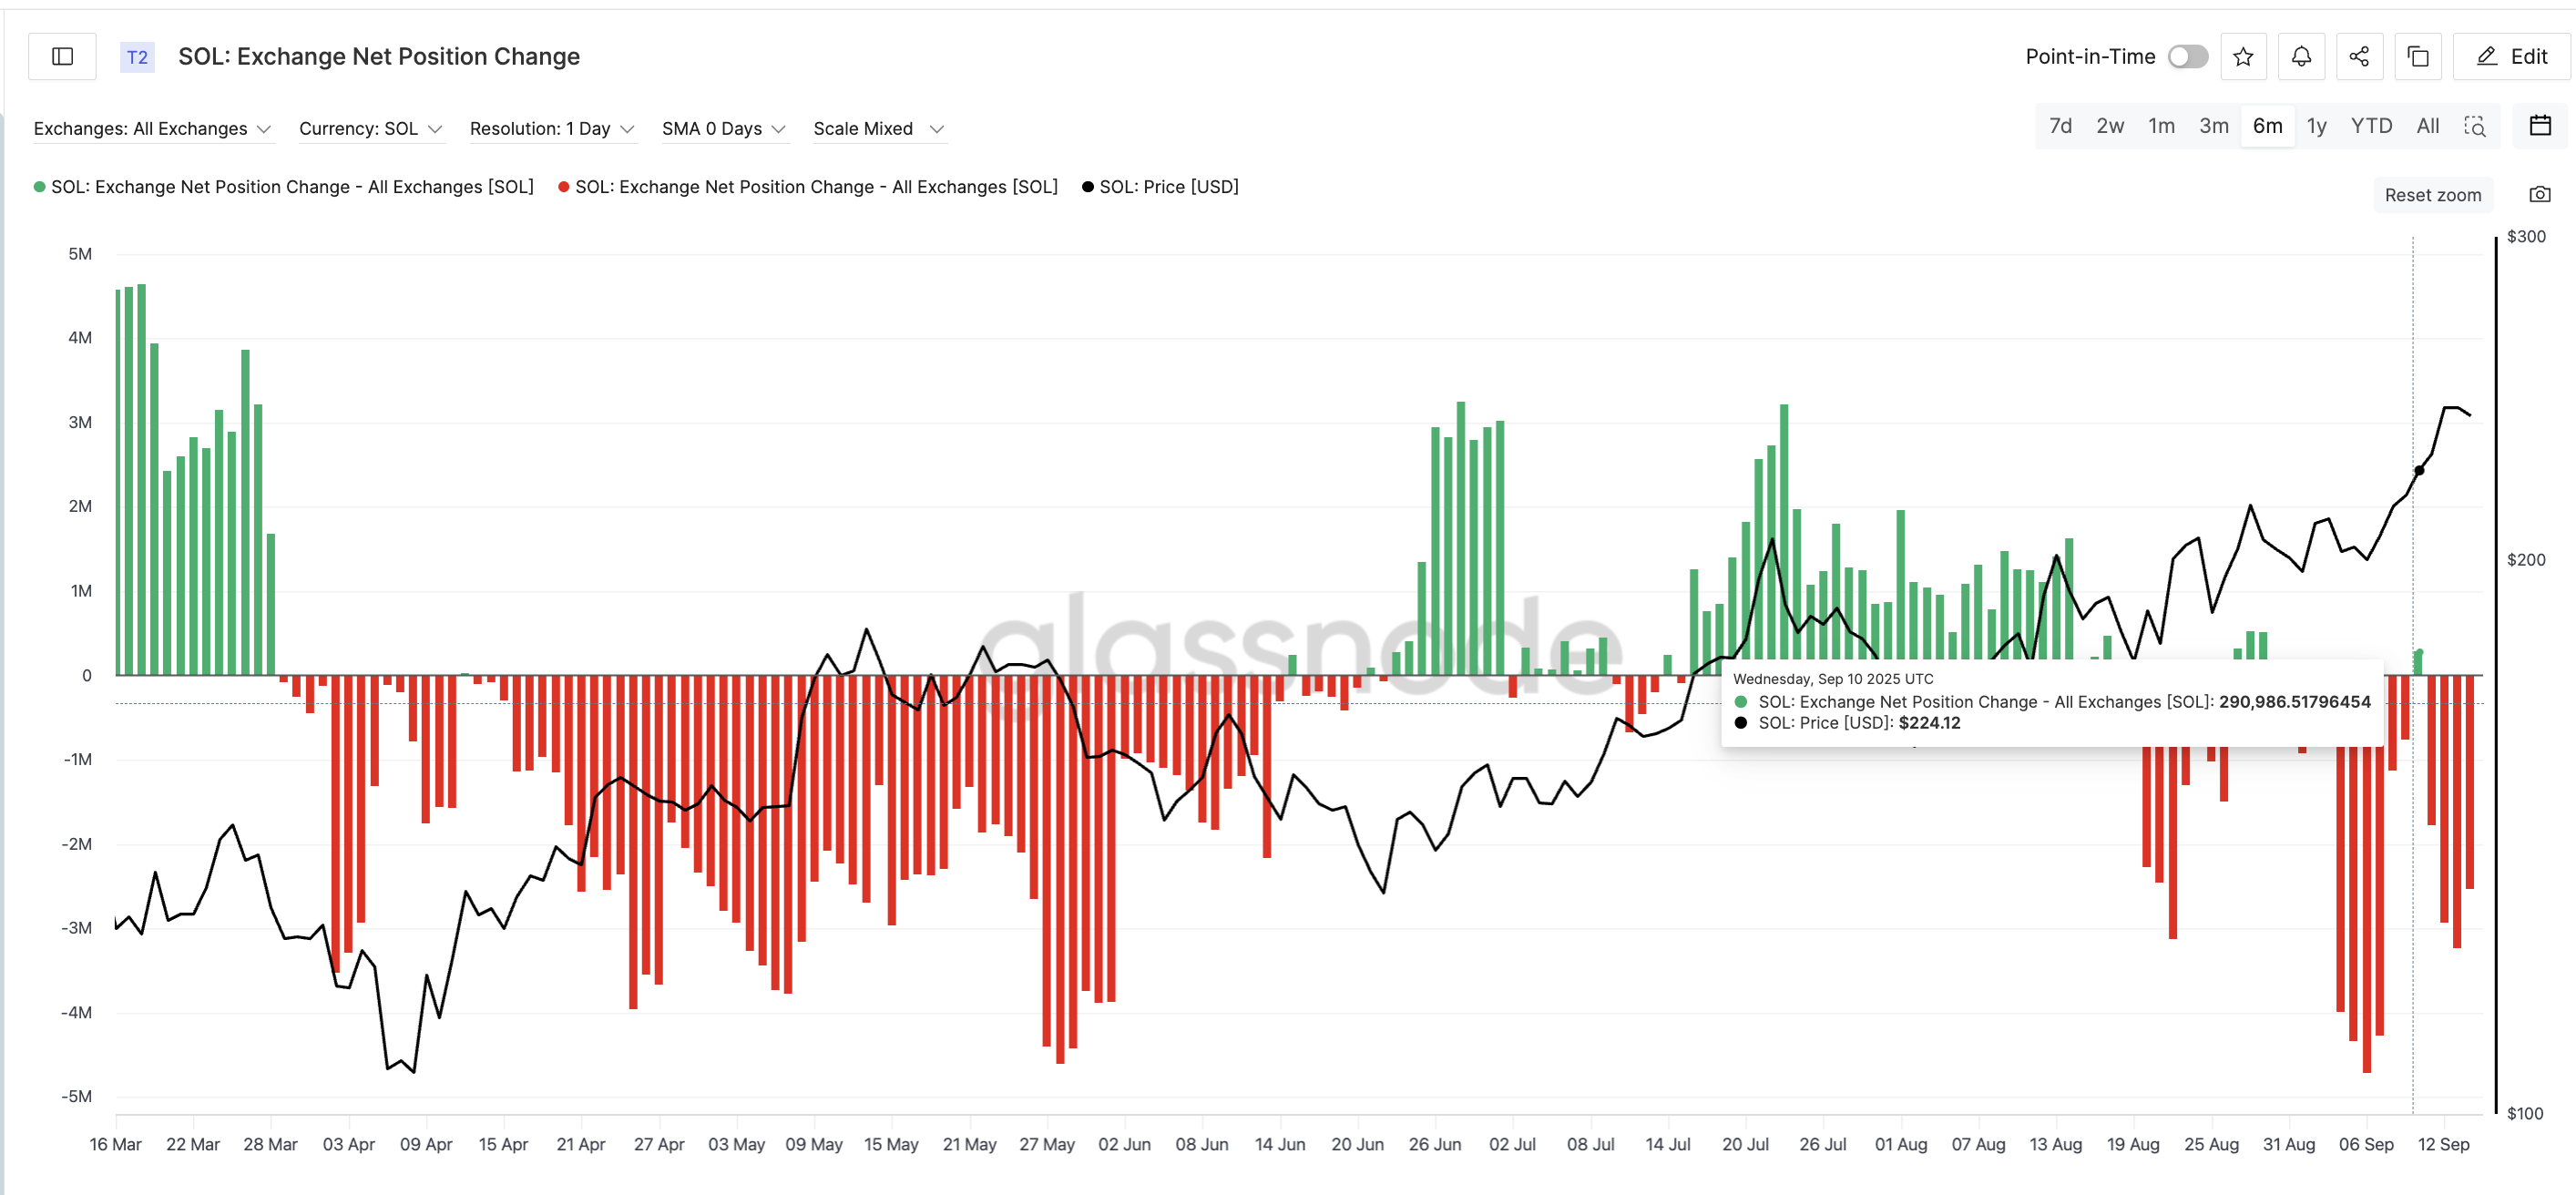
This time, the opposite is true. Since September 10, exchange balances have been deep in the red, meaning SOL continues to FLOW off exchanges. Persistent outflows suggest accumulation, not panic selling, which may cushion any pullback.
Bearish Pattern Hints at a Solana Price Dip, but the $284 Path Remains Intact
Technical charts add another layer. On the 4-hour chart, Solana shows bearish divergence — price made higher highs, while the RSI (Relative Strength Index), which tracks momentum, made lower highs. On higher timeframes, this pattern often signals trend reversal, but on shorter charts, it usually points to a pullback.
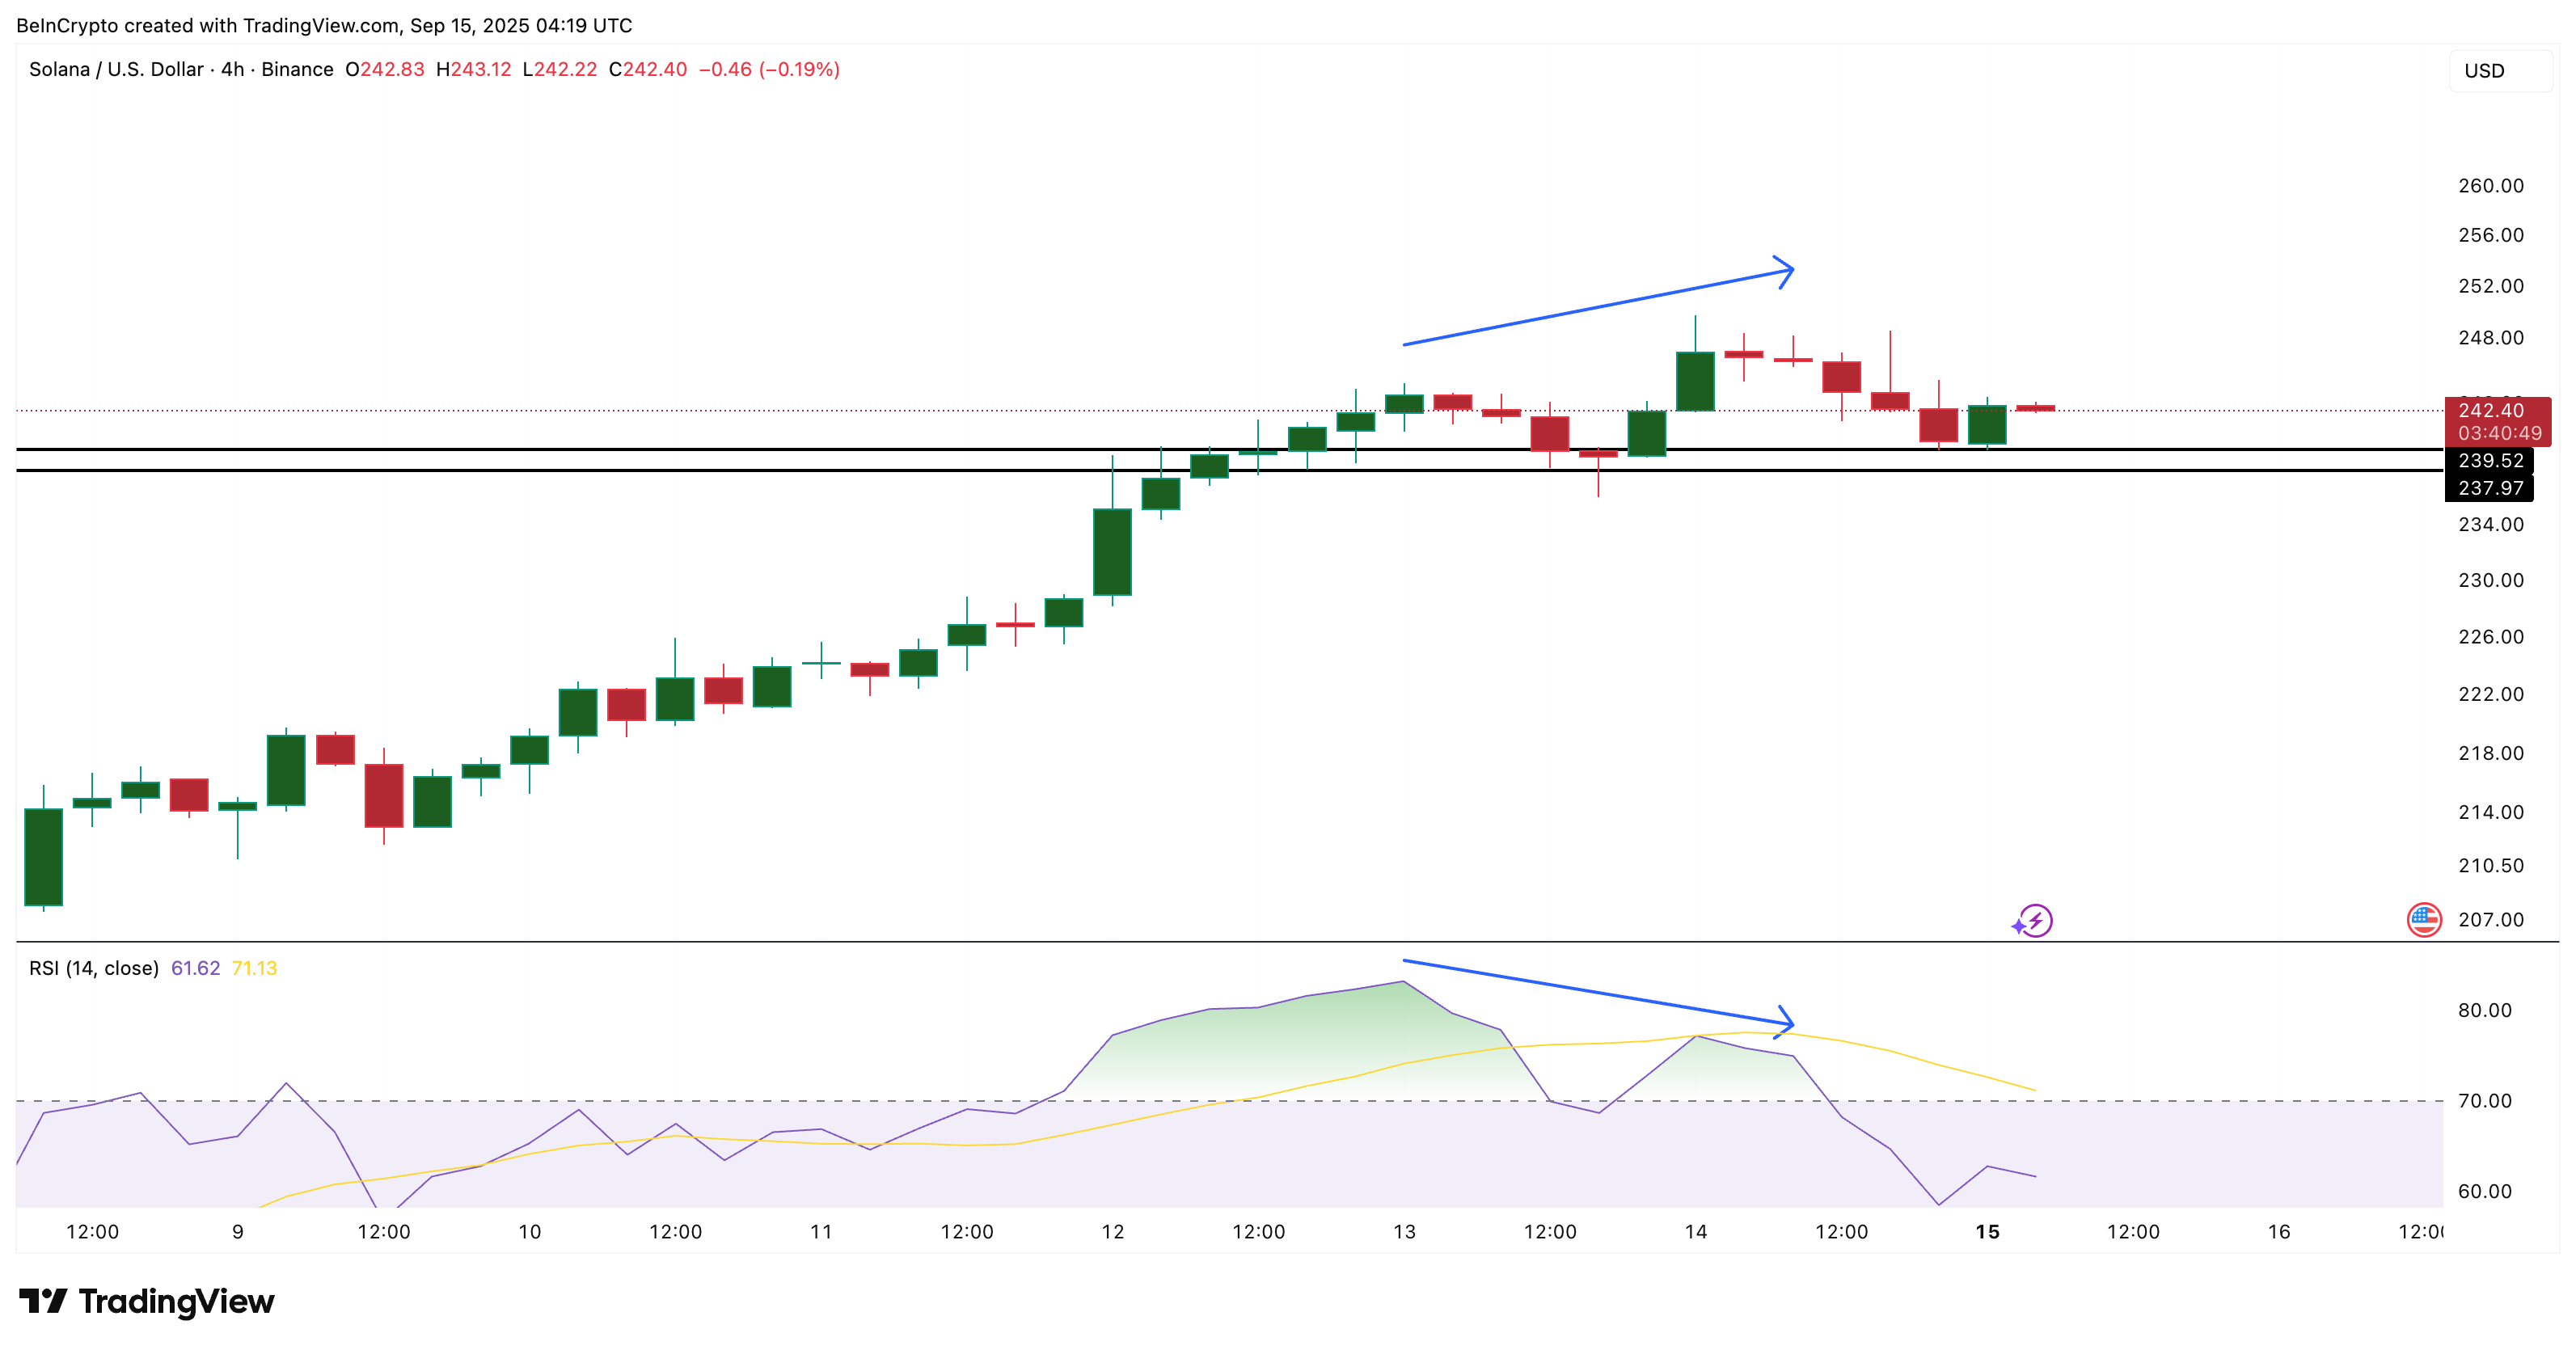
The levels to watch are $239 and $237, which align as supports on both 4-hour and daily charts. Now that the MVRV-Z spike and RSI divergence point to a pullback, it is time to check the daily chart closely for key levels.
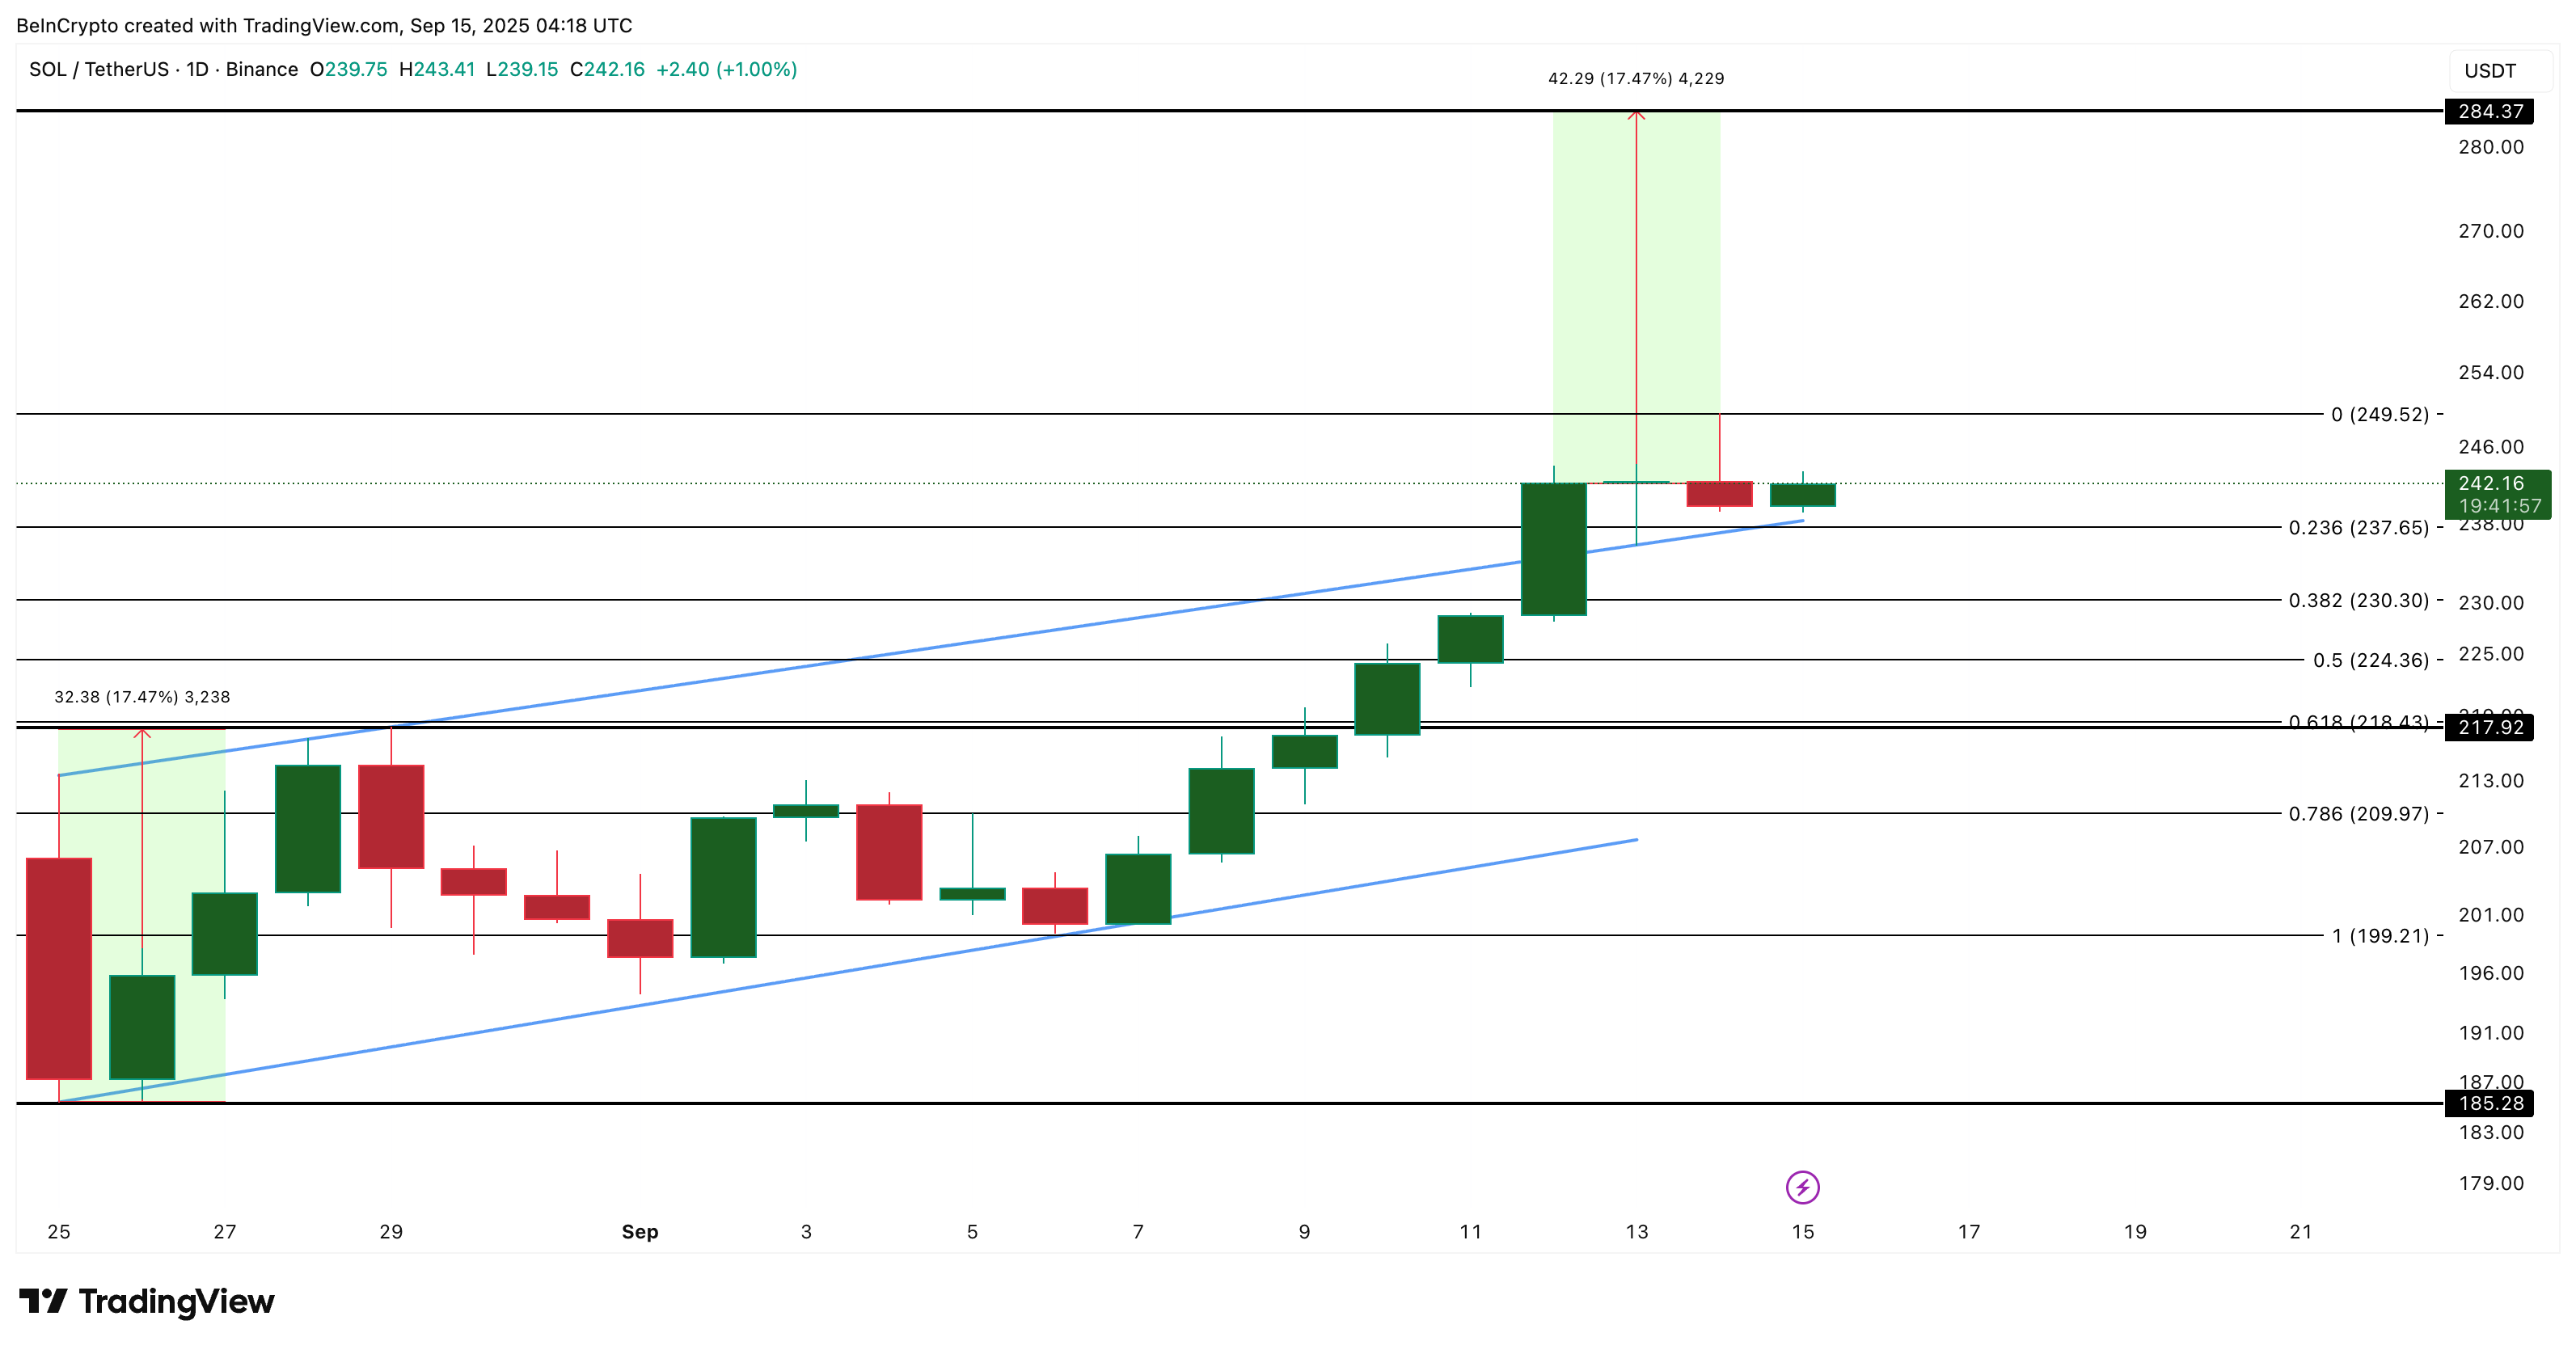
A slip under $237 could bring $230 and $224 into play. Still, the larger breakout remains valid. The solana price already broke cleanly above its channel, validating the bullish setup we tracked earlier.
The breakout target sits NEAR $284 per the ascending channel target (a 17% rise from the current levels), and unless SOL falls below $199, that target remains intact.
In other words, a dip here may be less of a threat and more of a reset. For now, Solana’s short-term momentum appears to be strained, but the broader rally toward $284 still looks on track.
