Hedera’s HBAR Soars 15%—But Diverging Flows Hint Bull Run May Be Nearing Exhaustion

HBAR rockets upward as traders pile in—yet underlying metrics whisper caution.
Signs of Fatigue
While retail euphoria fuels the pump, smart money flows tell a different story. Divergences between price action and volume suggest this rally might be running on borrowed time—classic crypto theater where momentum often outlasts logic.
Greed vs. Reality
Fifteen percent jumps make headlines, but seasoned pros watch the tape—not the ticker. When institutional inflows stall while retail FOMO buys the top, you can almost hear the exit liquidity lining up. Another day, another lesson in why crypto moves faster than common sense.
Hedera’s HBAR Climbs, But Weak Money Flows Threaten the Rally
An assessment of the HBAR/USD daily chart shows the Chaikin Money FLOW (CMF) trending downward and slipping below the zero line. This comes even as HBAR’s price has climbed nearly 15% over the past week.
: Want more token insights like this? Sign up for Editor Harsh Notariya’s Daily crypto Newsletter here.
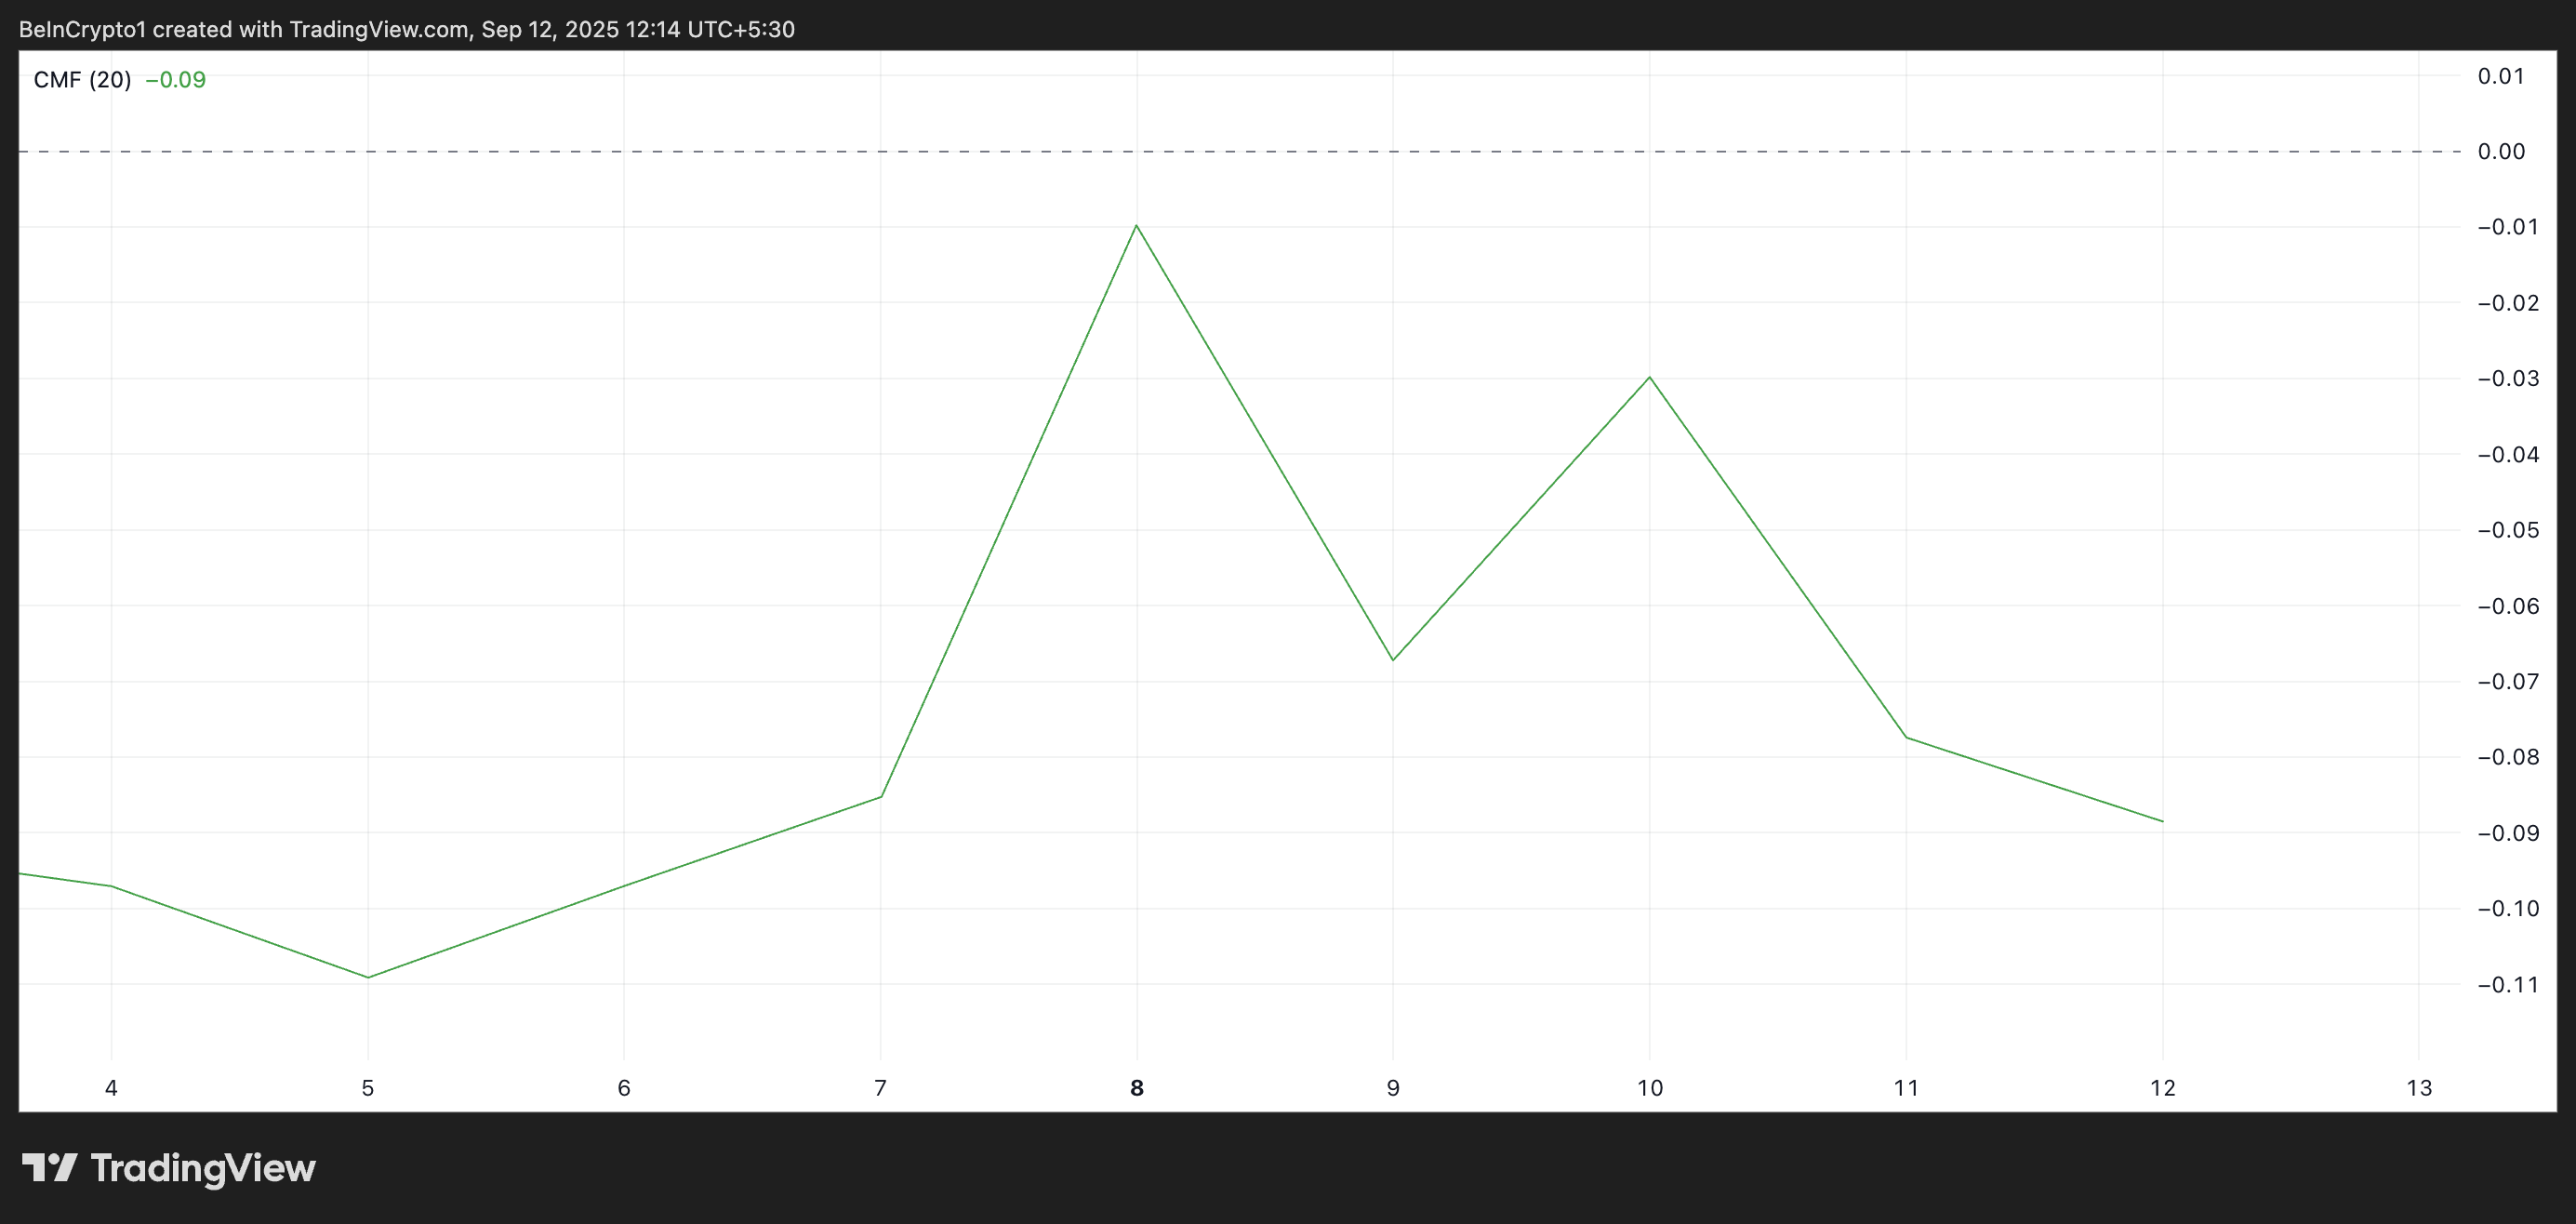
The CMF indicator measures how money flows into and out of an asset. This disconnect between rising prices and weakening money Flow points to a bearish divergence, indicating that the buying momentum is not fully backing the recent rally.
HBAR’s falling CMF suggests that capital inflows are shrinking despite the price increase. This indicates weakening demand and raises the probability of a near-term pullback, as rallies without strong support are often unsustainable.
Furthermore, HBAR continues to trade below its super trend indicator, adding to the bearish outlook. As of this writing, the super trend line forms dynamic resistance above the token’s price at $0.2527, indicating that sell-side pressure is still dominant.
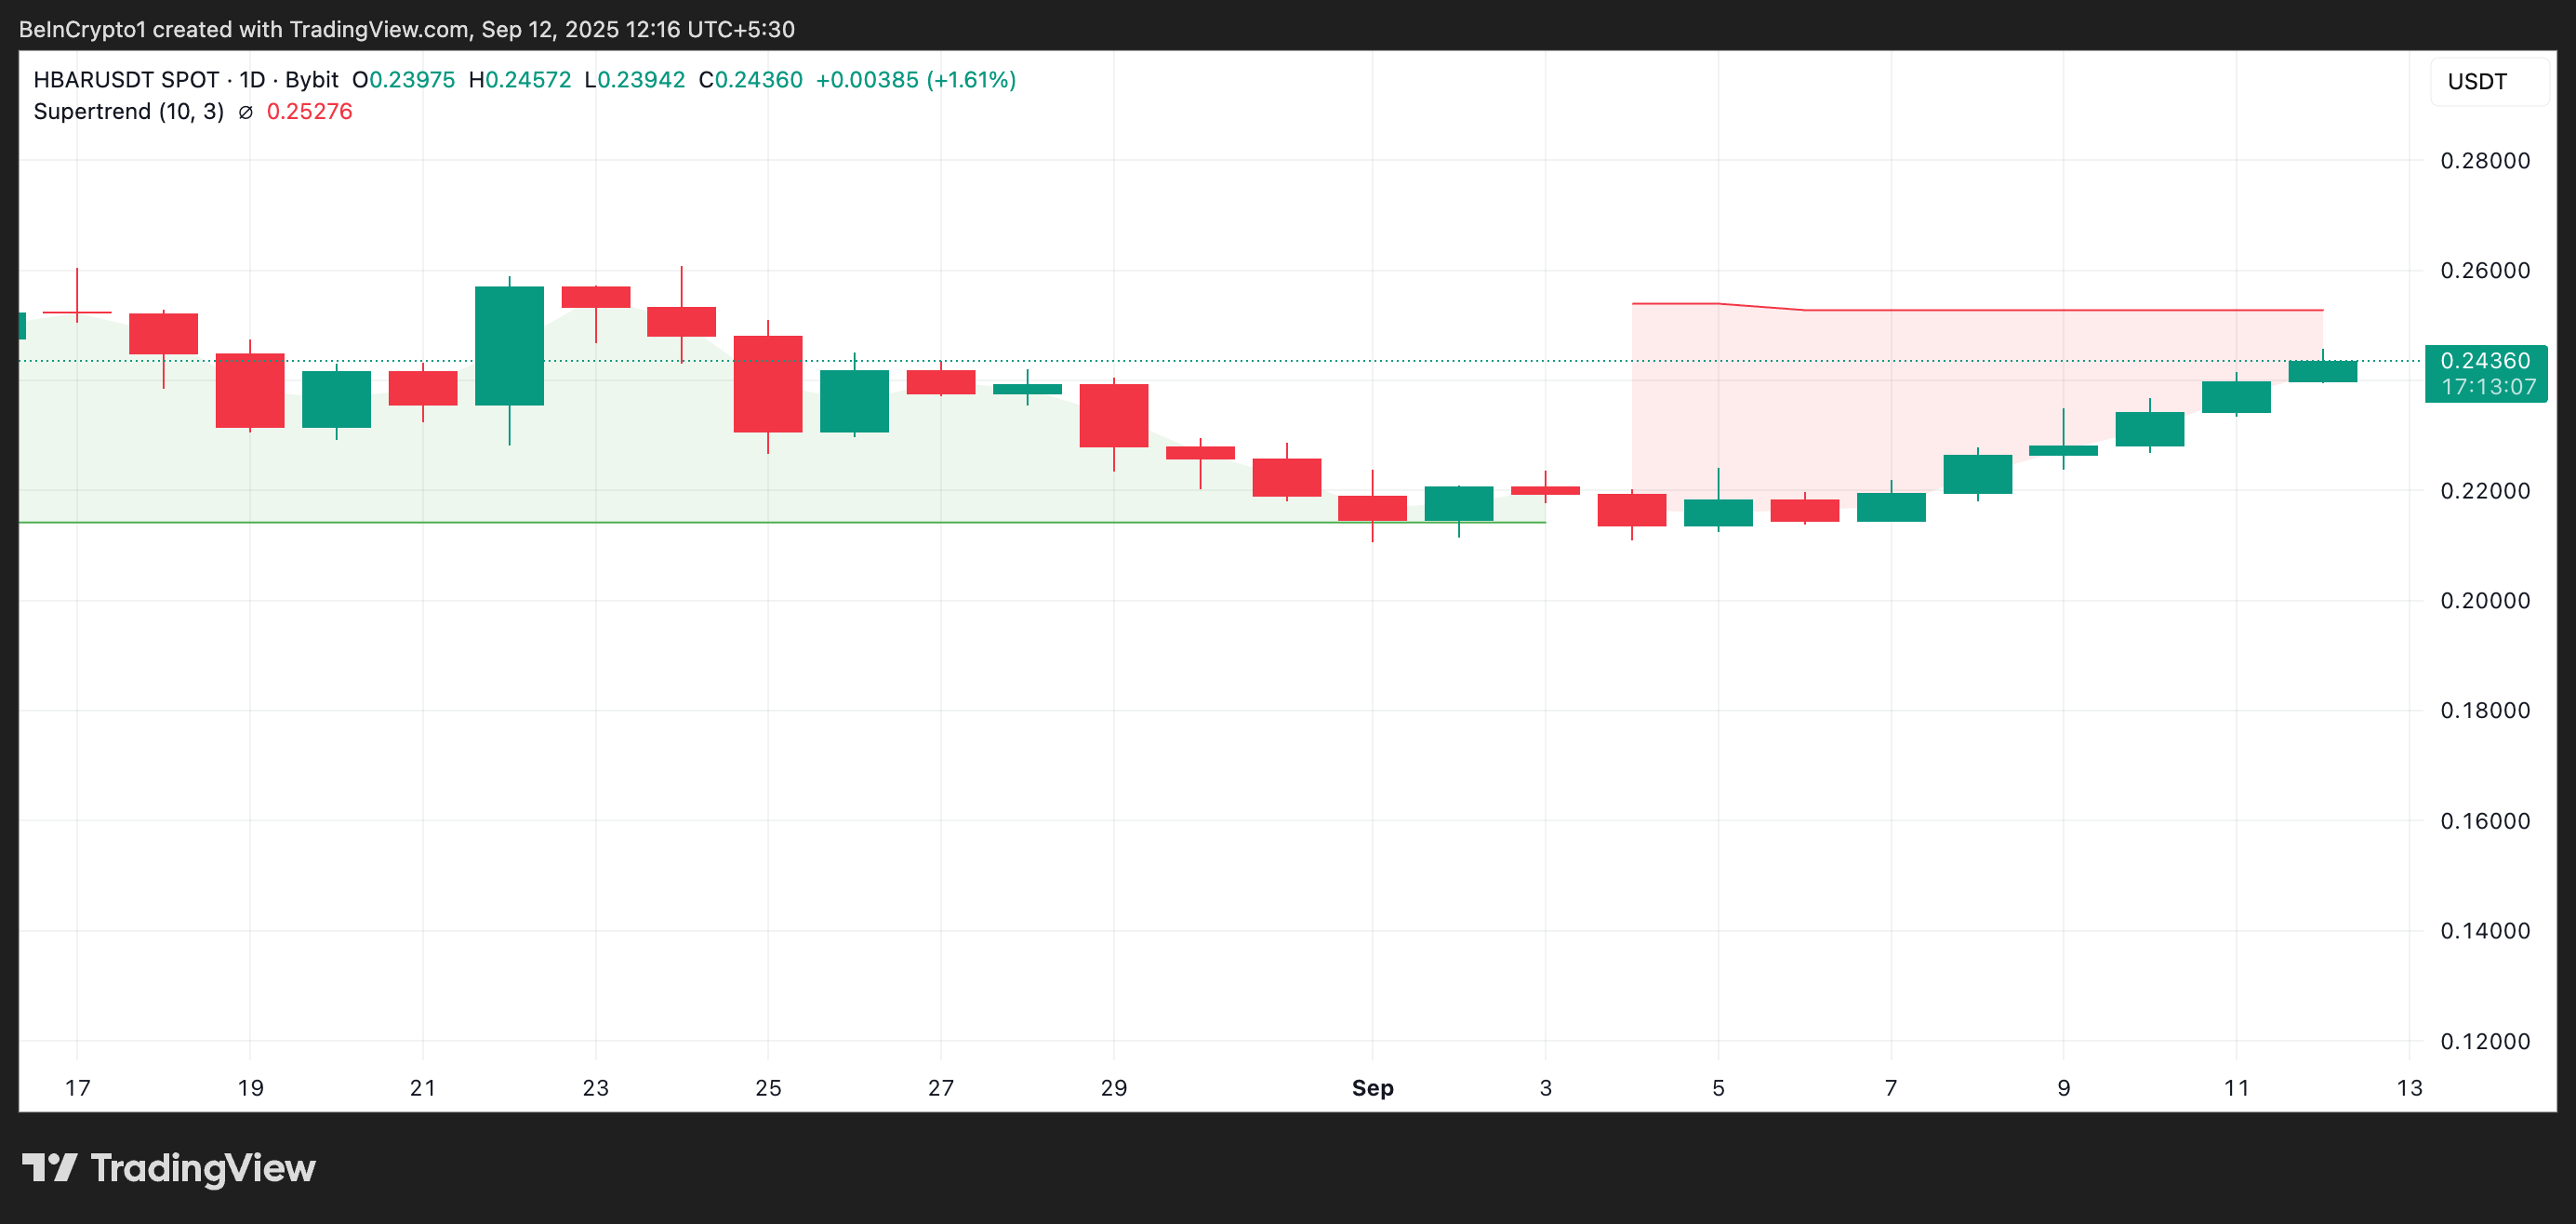
This indicator tracks the direction and strength of an asset’s price trend. It is displayed as a line on the price chart, changing color to signify the trend: green for an uptrend and red for a downtrend.
When an asset’s price trades below its super trend indicator, selling pressure dominates the market. This could make it harder for HBAR bulls to extend the current rally without a significant breakout.
HBAR Faces Crossroads: Support at $0.2368 or Breakout Above $0.2527?
Once buyer exhaustion sets in, HBAR’s upward momentum could weaken, with a reversal toward the $0.2368 support level likely. A breakdown below this floor could open the way for a deeper decline to $0.2156.
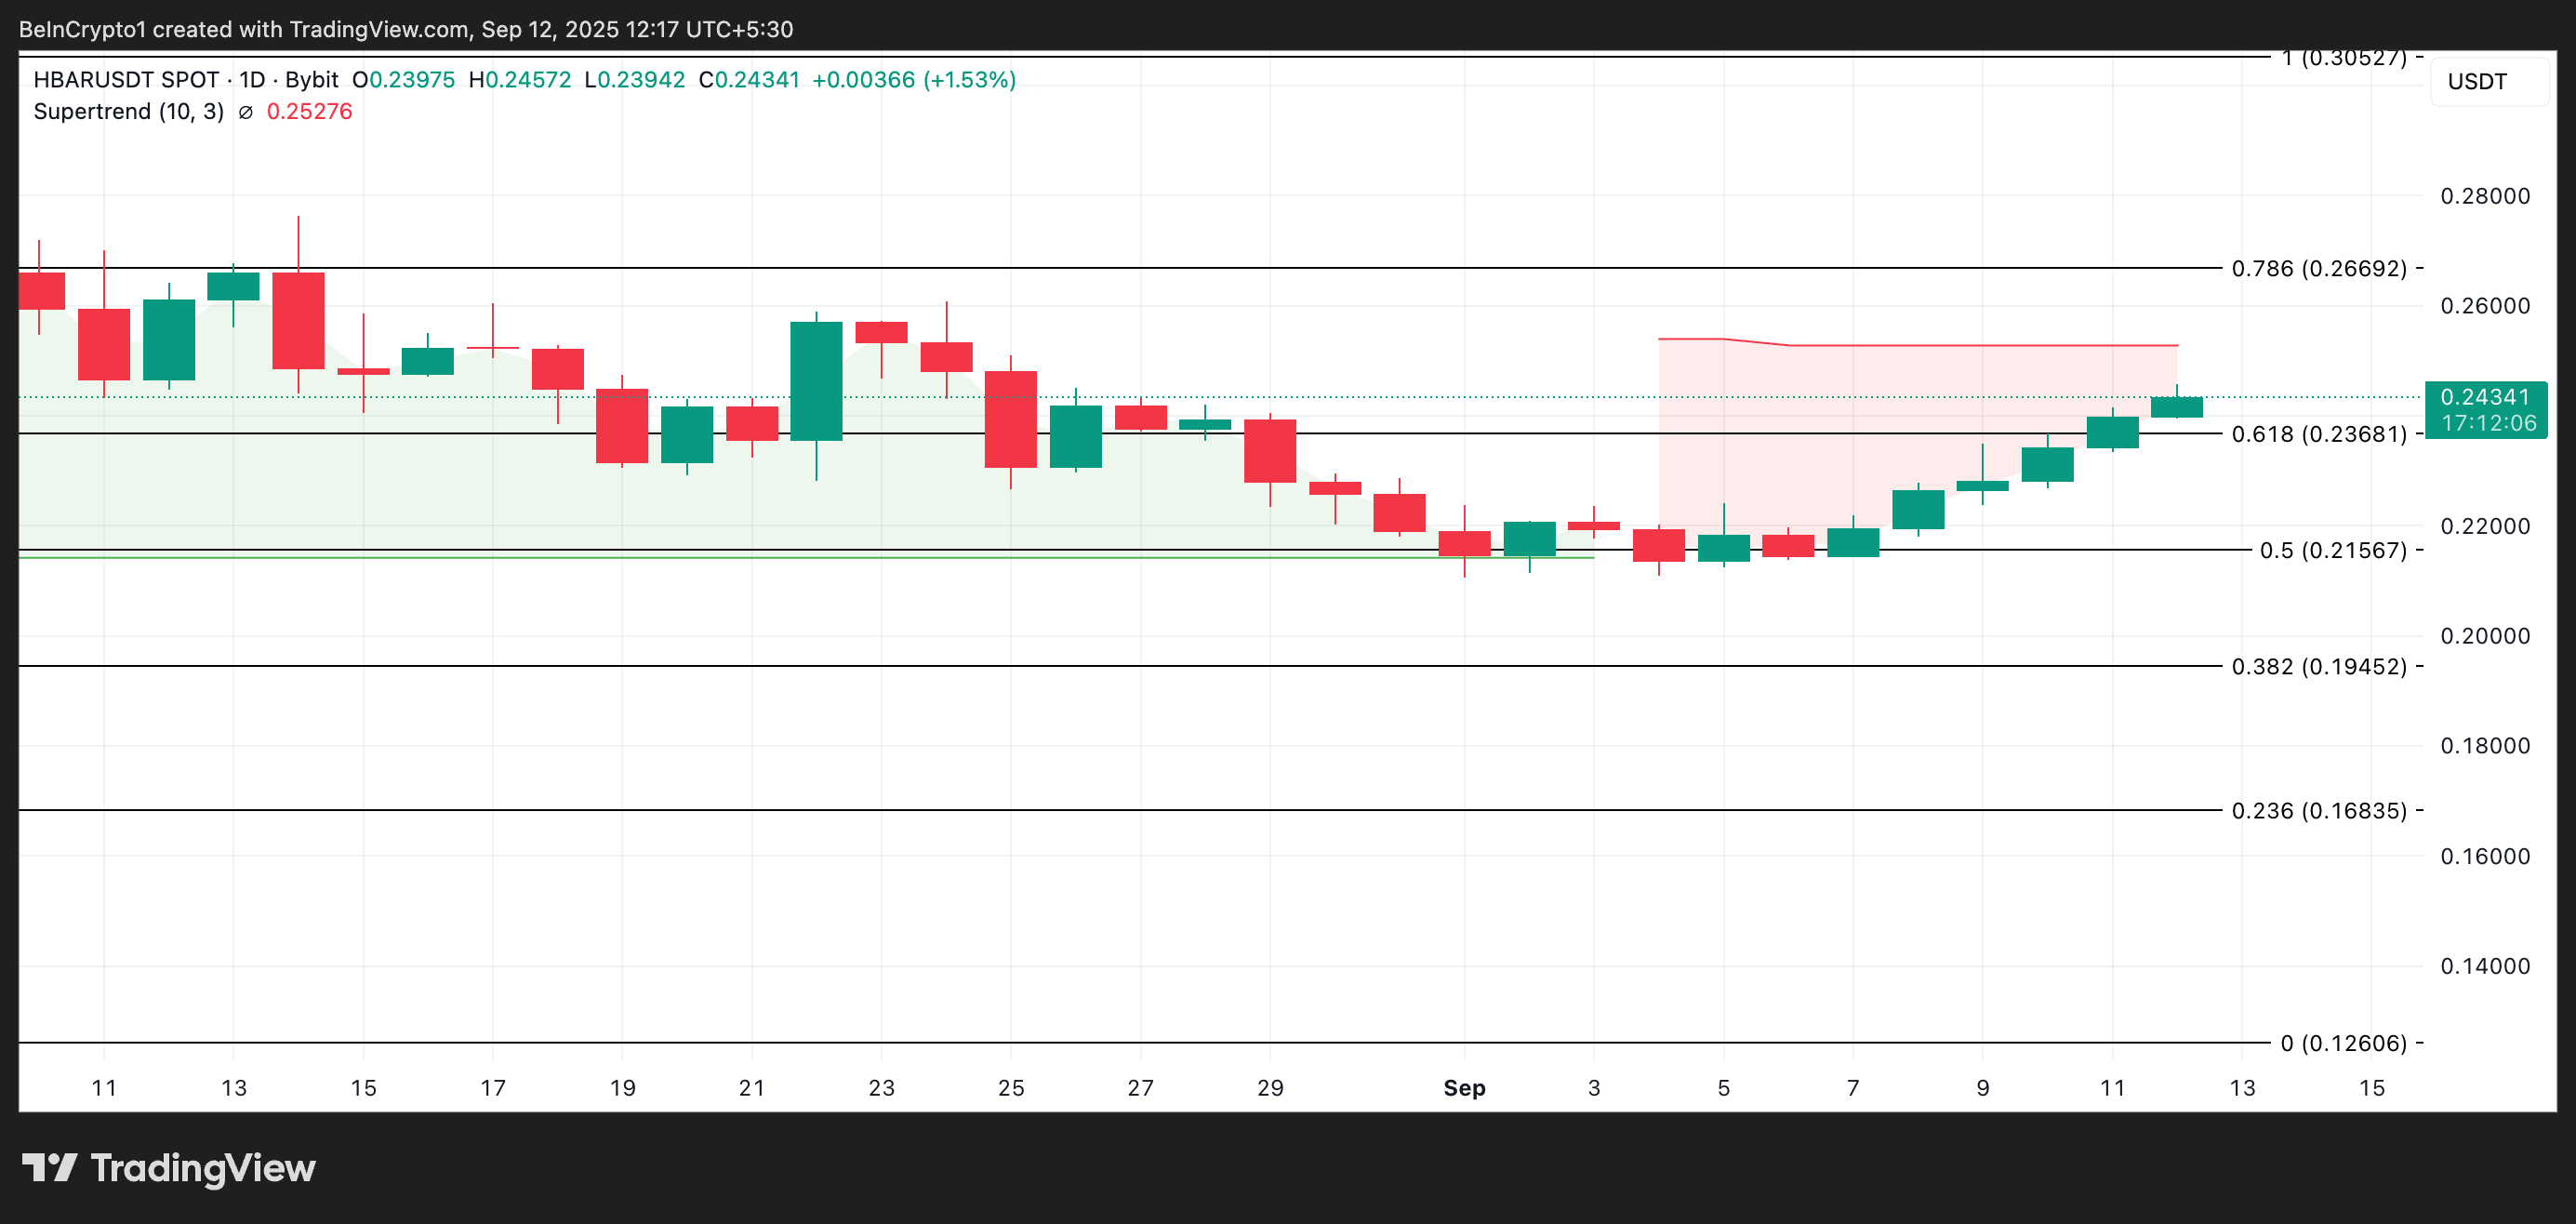
Conversely, if fresh demand enters the market and sustains the rally, HBAR could attempt to break above the dynamic resistance of its super trend indicator at $0.2527. A successful breakout WOULD clear the path for further gains toward $0.2669.
