MYX Correction Ahead? Smart Money Declares It’s Just a Healthy Dip

MYX takes a breather after its explosive rally—but institutional players see opportunity, not panic.
Reading the Tape
Smart money flows suggest this pullback lacks the hallmarks of a true reversal. Large wallets are accumulating, not dumping. The dip-buying frenzy from seasoned traders hints at underlying strength, not weakness.
Market Mechanics at Play
Liquidations cleared out overleveraged longs, creating a cleaner slate for the next leg up. Funding rates normalized, removing short-term pressure. Order books show solid support building at key levels—no vacuum beneath.
The Bigger Picture
Fundamentals remain untouched: adoption metrics keep climbing, network activity hits new highs, and the tokenomics narrative stays intact. This isn't a breakdown—it's a discount.
Of course, in crypto, a 'healthy correction' is just Wall Street speak for 'we bought the dip already.'
Selling Pressure And Technical Weakness Signal A Correction
The first signs of strain have come from whales. Over the past seven days, whale wallets sold about 339,499 MYX, worth close to $5.9 million. Their total holdings now sit at 855,499 MYX.
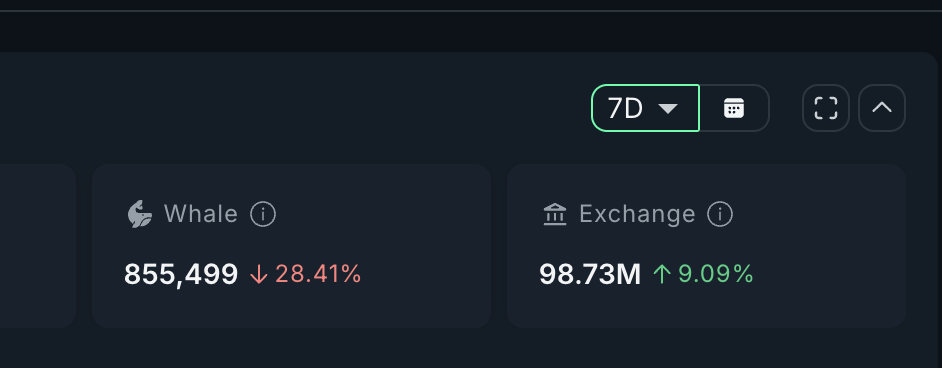
Exchanges have also absorbed new supply, with balances climbing by 8.23 million MYX to a total of 98.73 million tokens — roughly $143.6 million at current prices. Rising exchange balances usually suggest holders are preparing to sell, adding more supply-side pressure.
? Sign up for Editor Harsh Notariya’s Daily crypto Newsletter here.
This selling has already shown up on the charts. On the 12-hour timeframe, MYX price made a higher high while the Relative Strength Index (RSI), which measures momentum, slipped to a lower high.
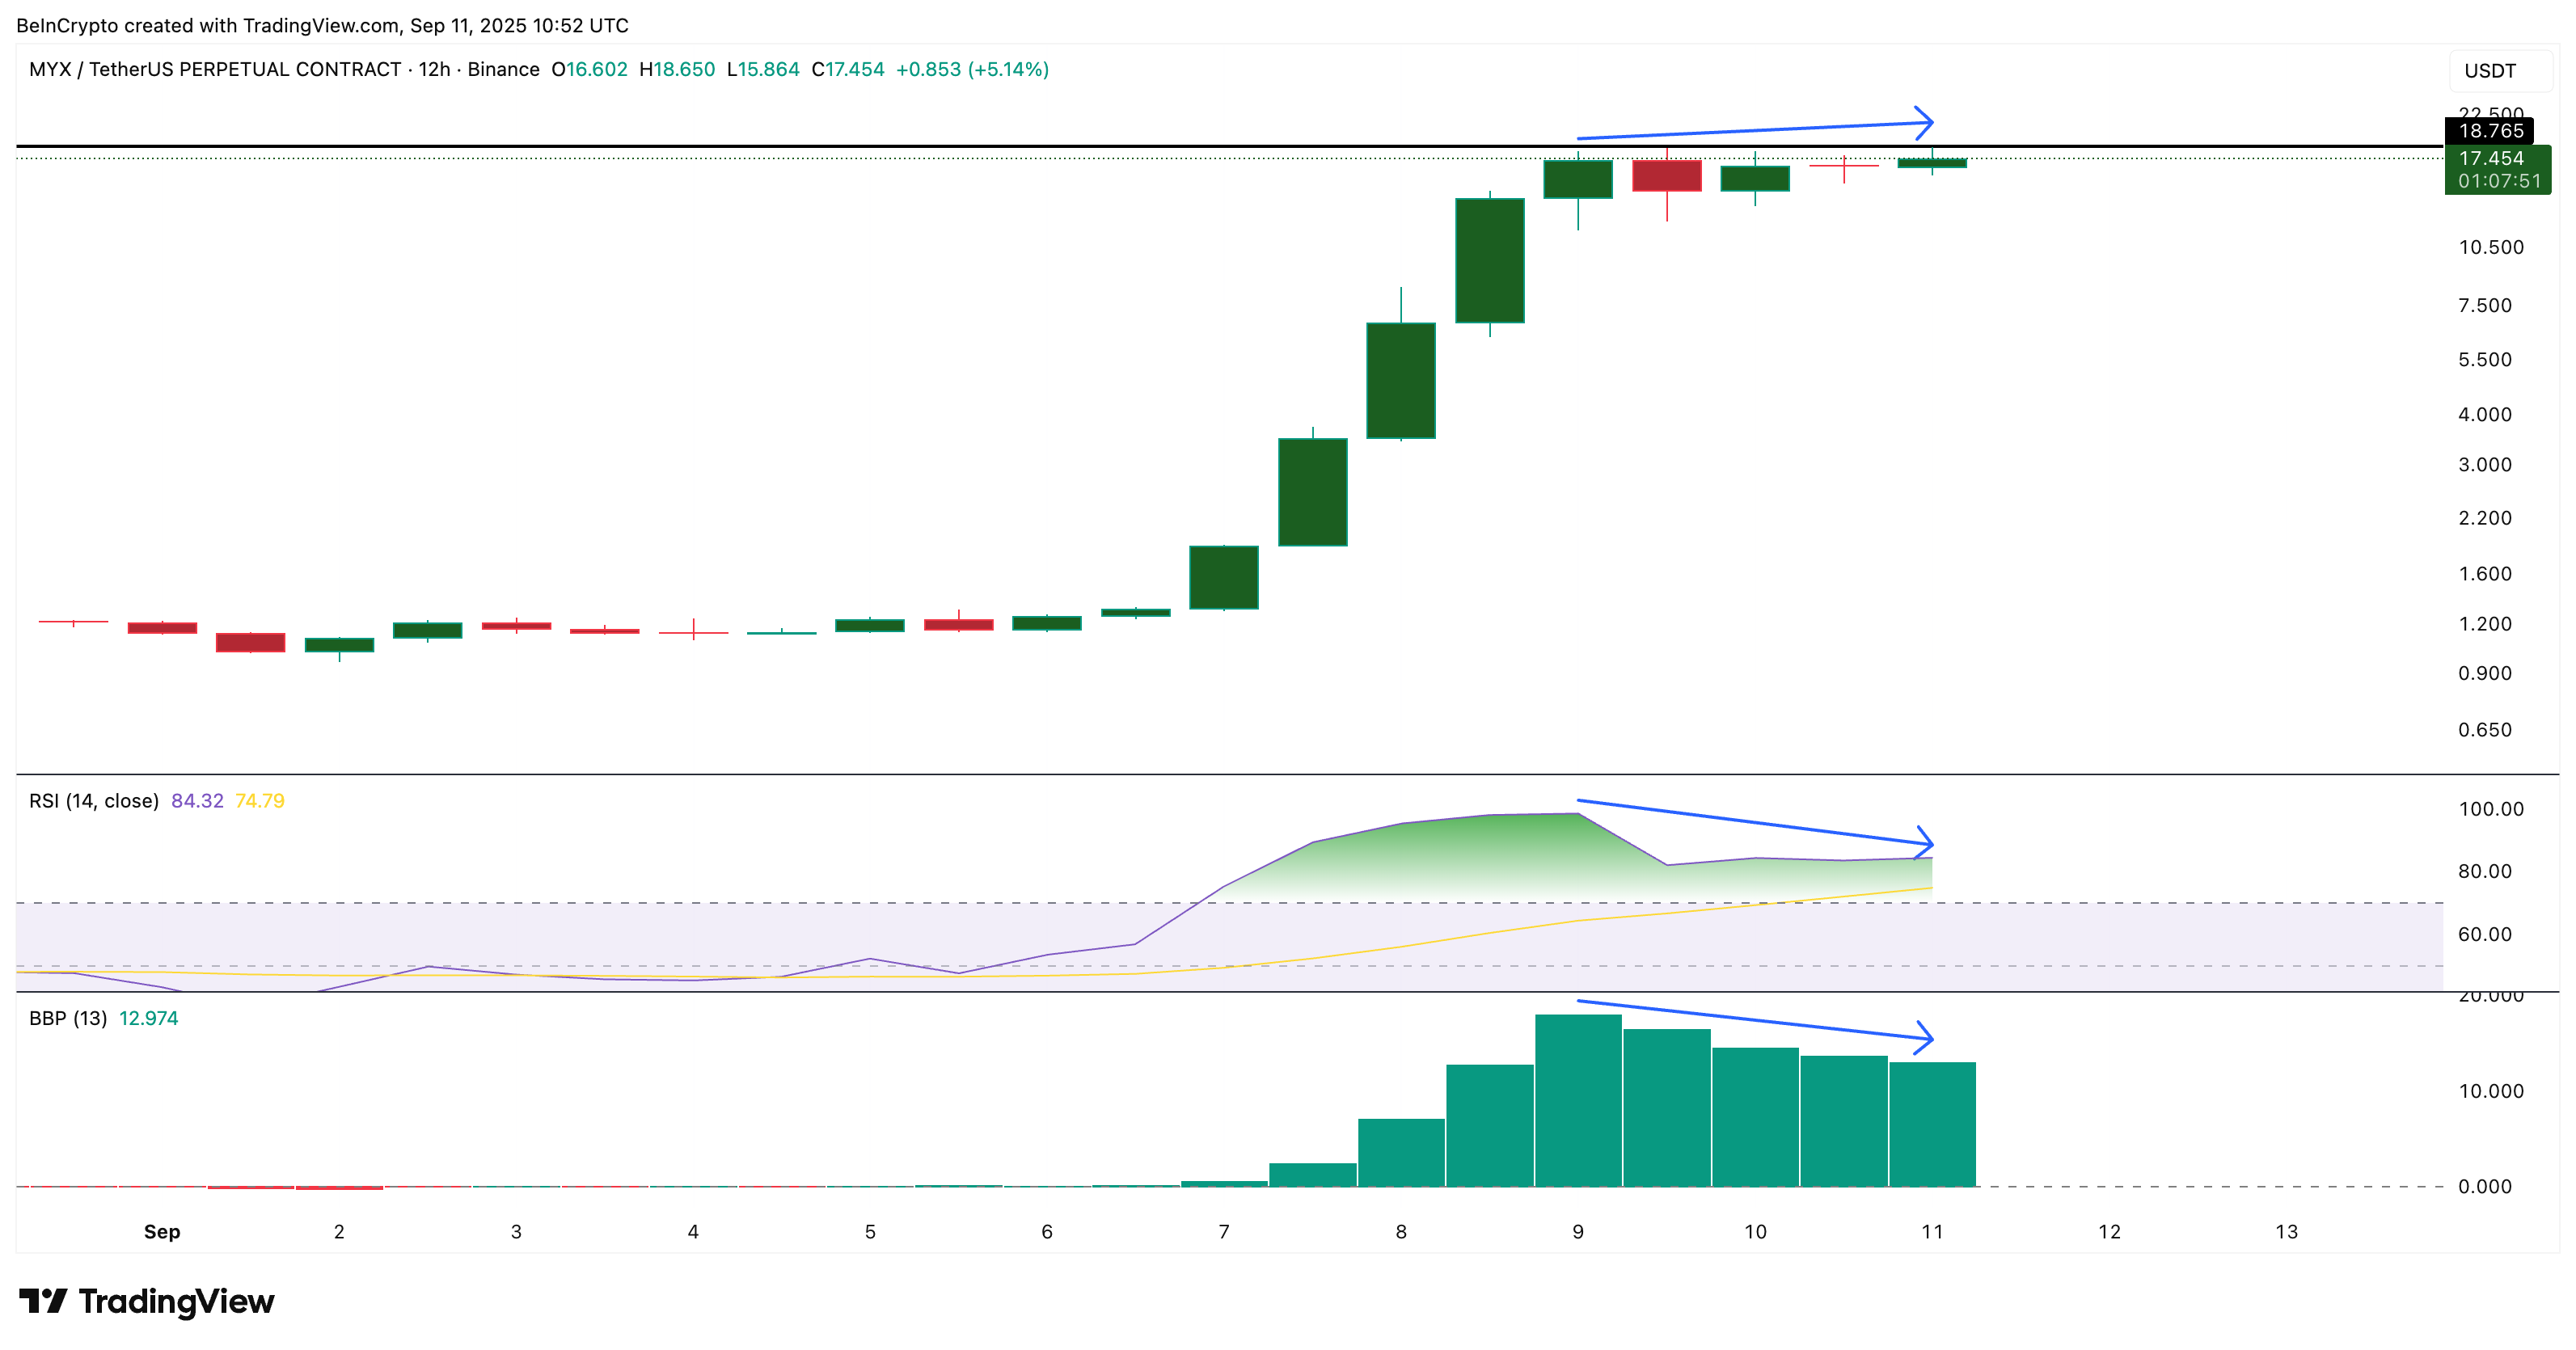
This “bearish divergence” is often a warning that buyers are losing strength even as the price climbs. Although on such a short time frame with only a few candles, this usually signals a pullback rather than a full reversal.
The Bull/Bear Power Index, which compares the force of buyers and sellers, tells a similar story. Bulls remain in control, but their dominance has weakened. Together, these factors indicate a fading of bullish momentum and make a pullback increasingly likely.
Why A MYX Price Pullback May Be Limited
While momentum is cooling, the 4-hour chart shows the correction may not evolve into a collapse. The 12-hour chart gives a broad view, but the 4-hour view is valuable for tracking how dips unfold inside that larger trend.
MYX Finance has been range-bound since September 9, but the Smart Money Index (SMI) continues to climb. That means short-term capital — the kind looking for quick gains — is still being deployed into MYX Finance.
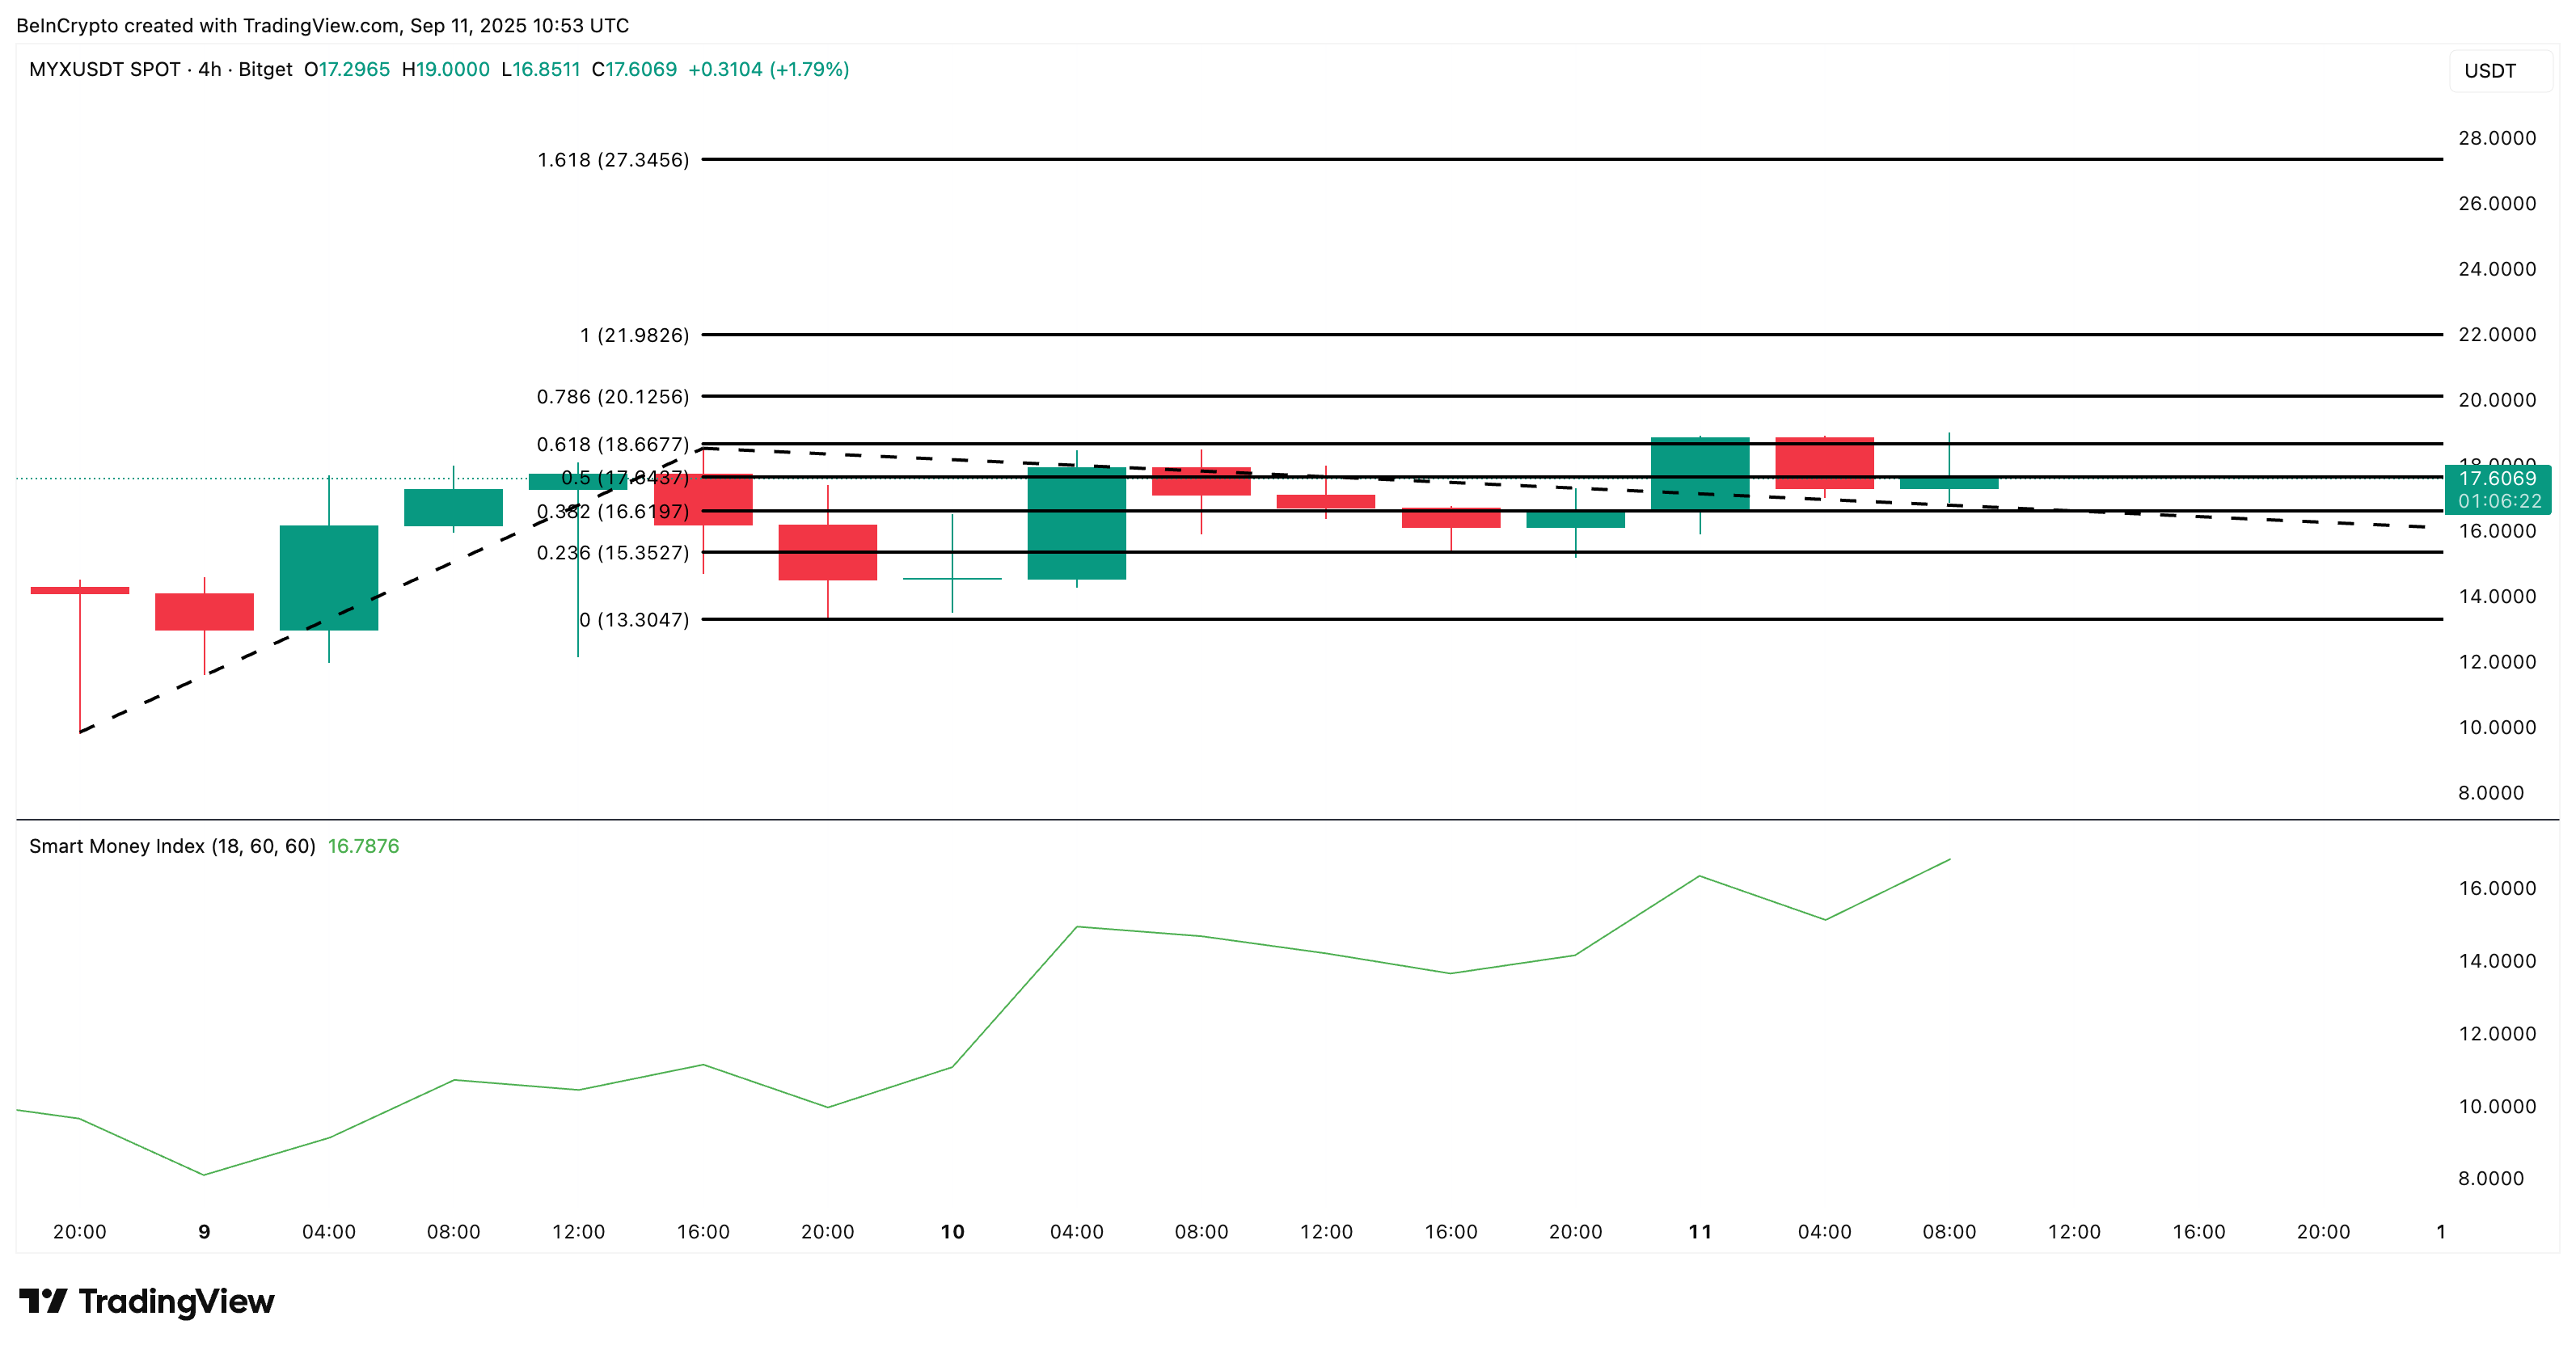
This rise in SMI aligns with the short-term bearish divergence. Sellers are adding pressure, but active buying shows dips are being absorbed. That suggests the correction is more likely a pullback inside an uptrend than the start of a reversal.
The Smart Money Index (SMI) tracks the activity of capital often considered more informed or tactical.
Key MYX price levels remain important. Support is visible at $16.61 and $15.35.
A MYX price drop below $13.30 WOULD break the bullish setup, while a daily close above $18.66 could clear the path toward $20.12–$27.34.
