Solana’s Epic Month-Long Rally Pushes Futures to Record Highs – Is $250 the Next Stop?

Solana futures just shattered all-time highs—fueled by a relentless month-long surge that's got traders buzzing.
The Momentum Machine
SOL's derivatives market hits unprecedented levels as the rally shows no signs of cooling off. Market sentiment shifts from cautious optimism to outright frenzy.
Price Target Speculation
With futures breaking records, analysts eye the $250 mark as the next logical resistance. Traders pile in while traditional finance pundits scratch their heads—another day in crypto, where fundamentals sometimes take a backseat to pure momentum.
Whether SOL punches through or pulls back, one thing's clear: the market's appetite for high-performance blockchains isn't slowing down. Maybe Wall Street will finally notice—or maybe they'll just keep shorting it.
Solana Open Interest Surges 300% Since August, Rally Momentum Builds
An assessment of SOL’s derivatives market shows its futures open interest at an all-time high of $8.17 billion at press time. Data from Glassnode indicates that the metric has risen with SOL’s price over the past month, climbing more than 300% since August 1.
: Want more token insights like this? Sign up for Editor Harsh Notariya’s Daily crypto Newsletter here.
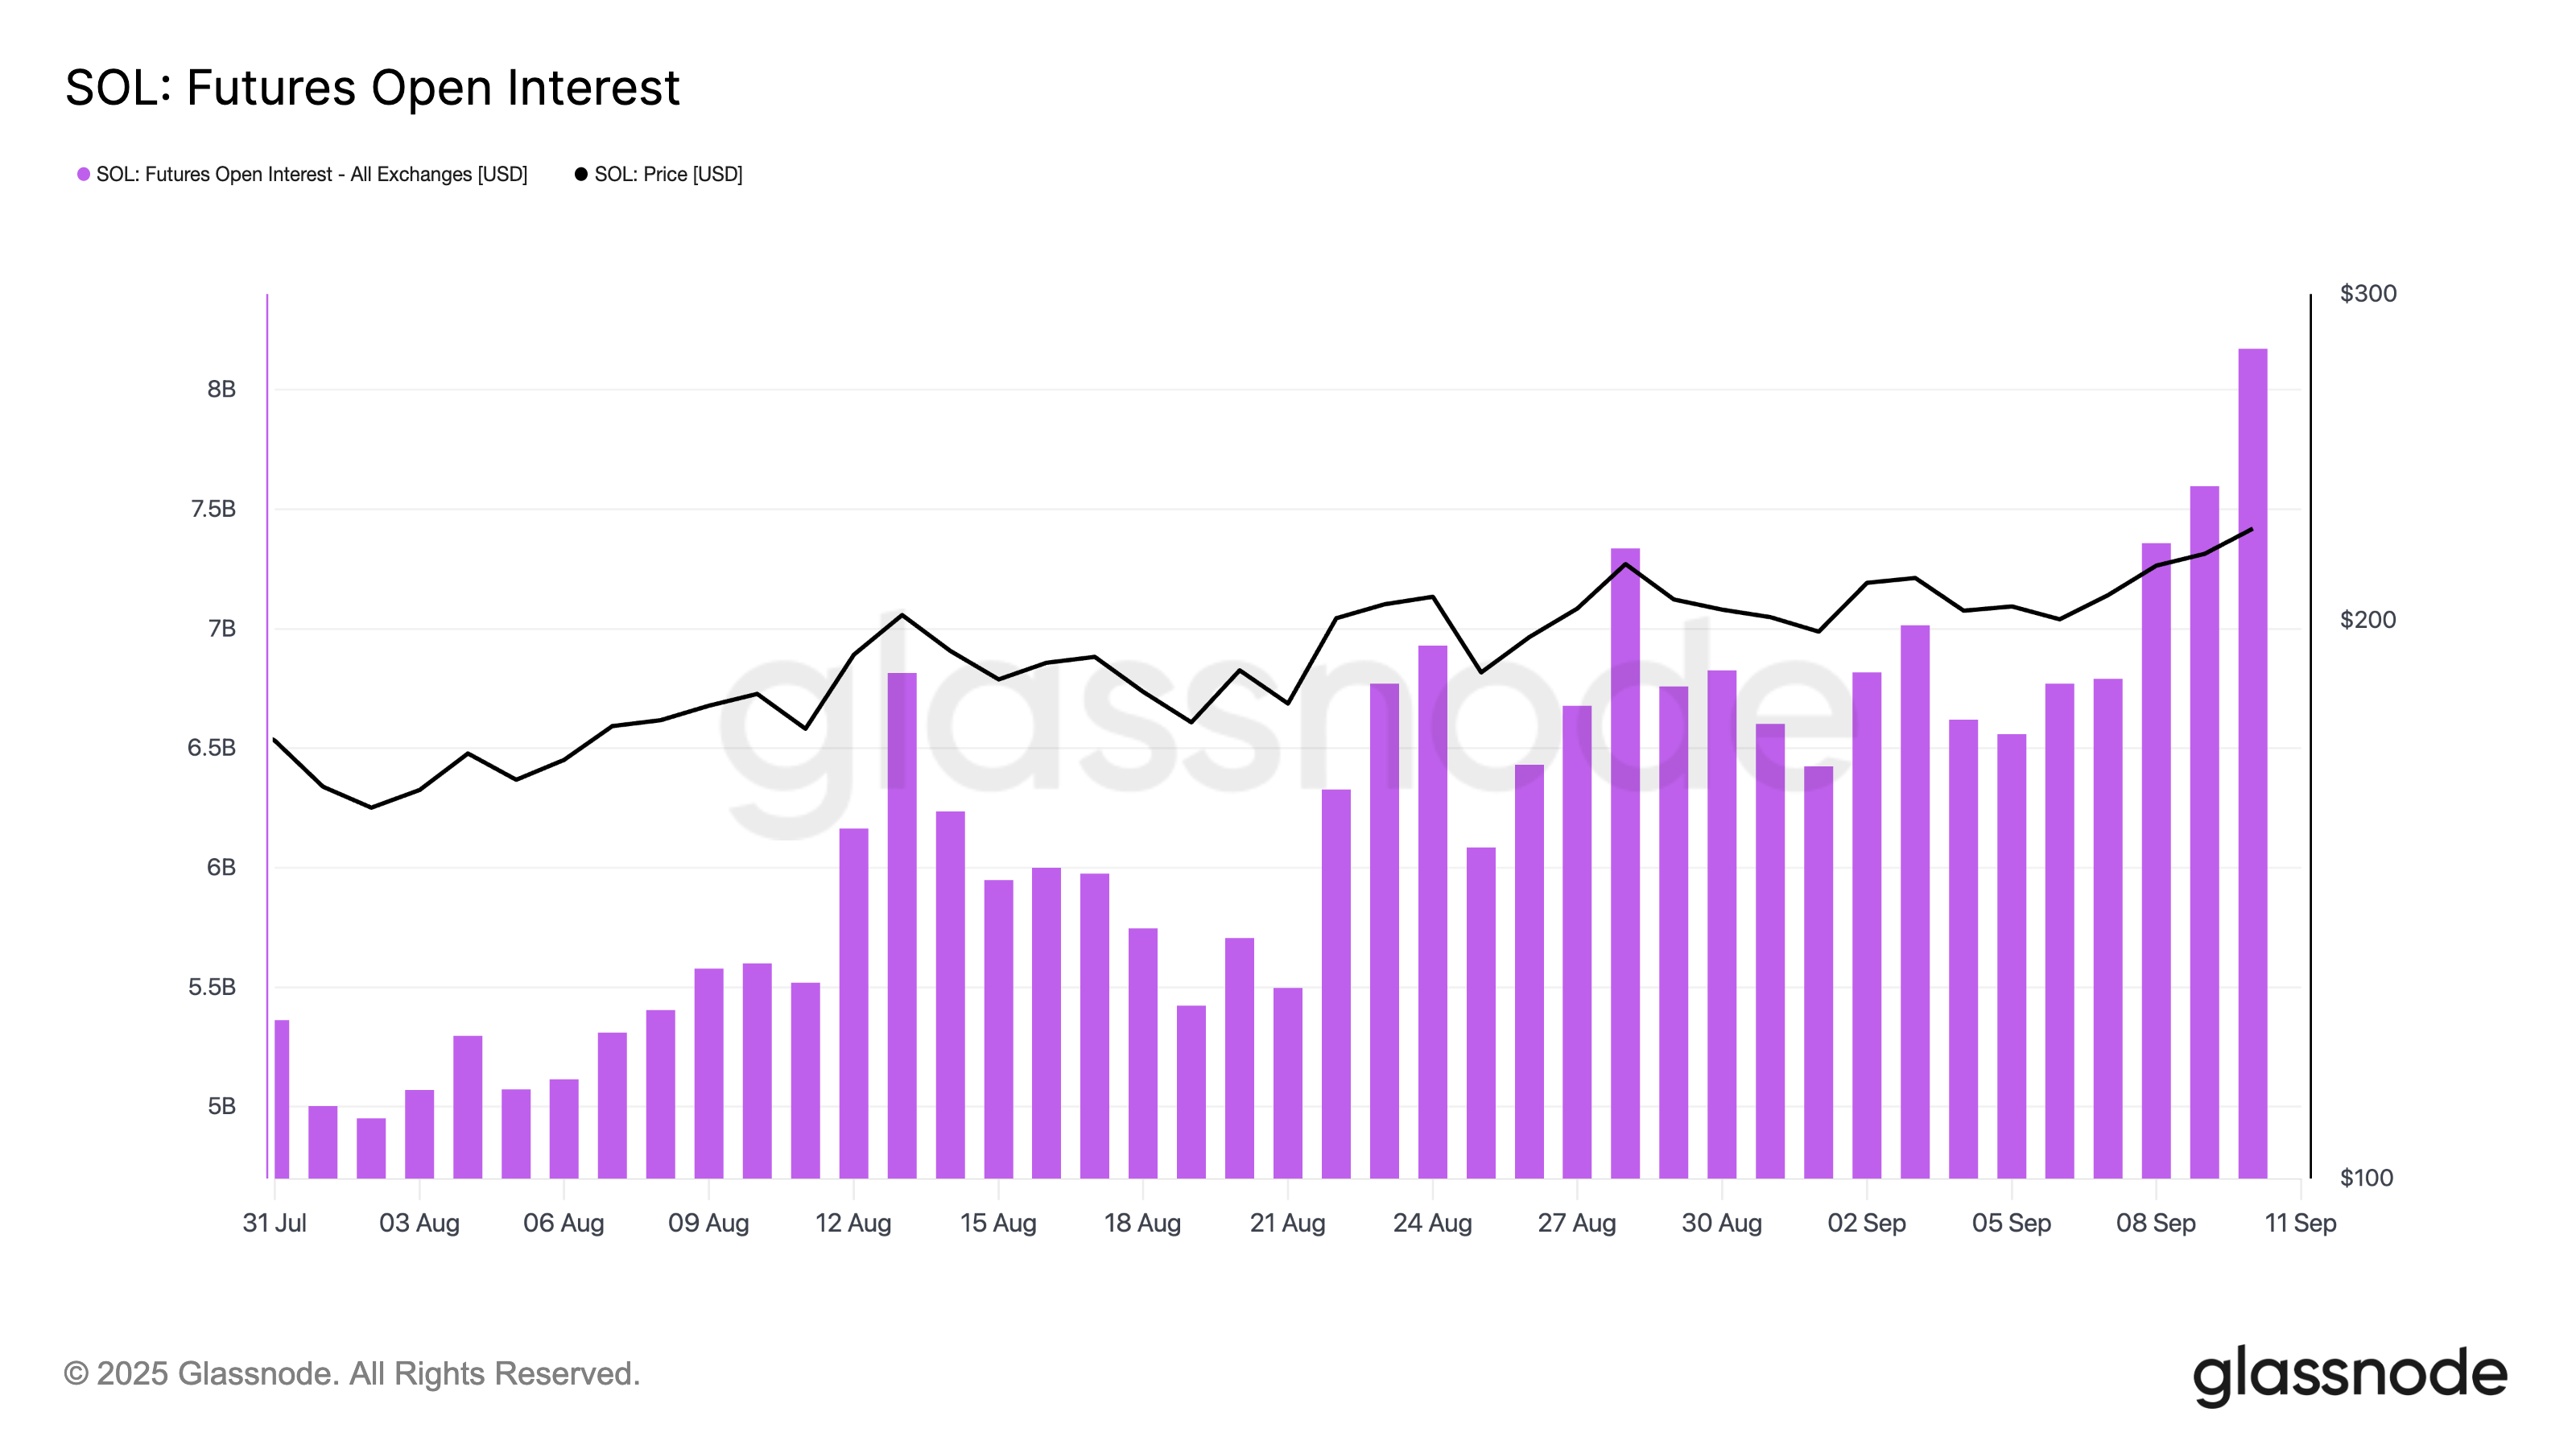
Futures open interest measures the total value of outstanding futures contracts that have not yet been settled. When it rises alongside price, new capital flows into the market, and speculative activity grows.
The steady increase in SOL’s futures open interest suggests that its futures traders have been aggressively positioning for further upside despite the broader market’s lackluster performance in August. This trend confirms the bullish momentum behind its rally and raises the probability of a push toward $250.
Furthermore, SOL’s liquidation heatmap shows a concentration of liquidity above its current price, around the $226 level. This reinforces the bullish case for further upside.
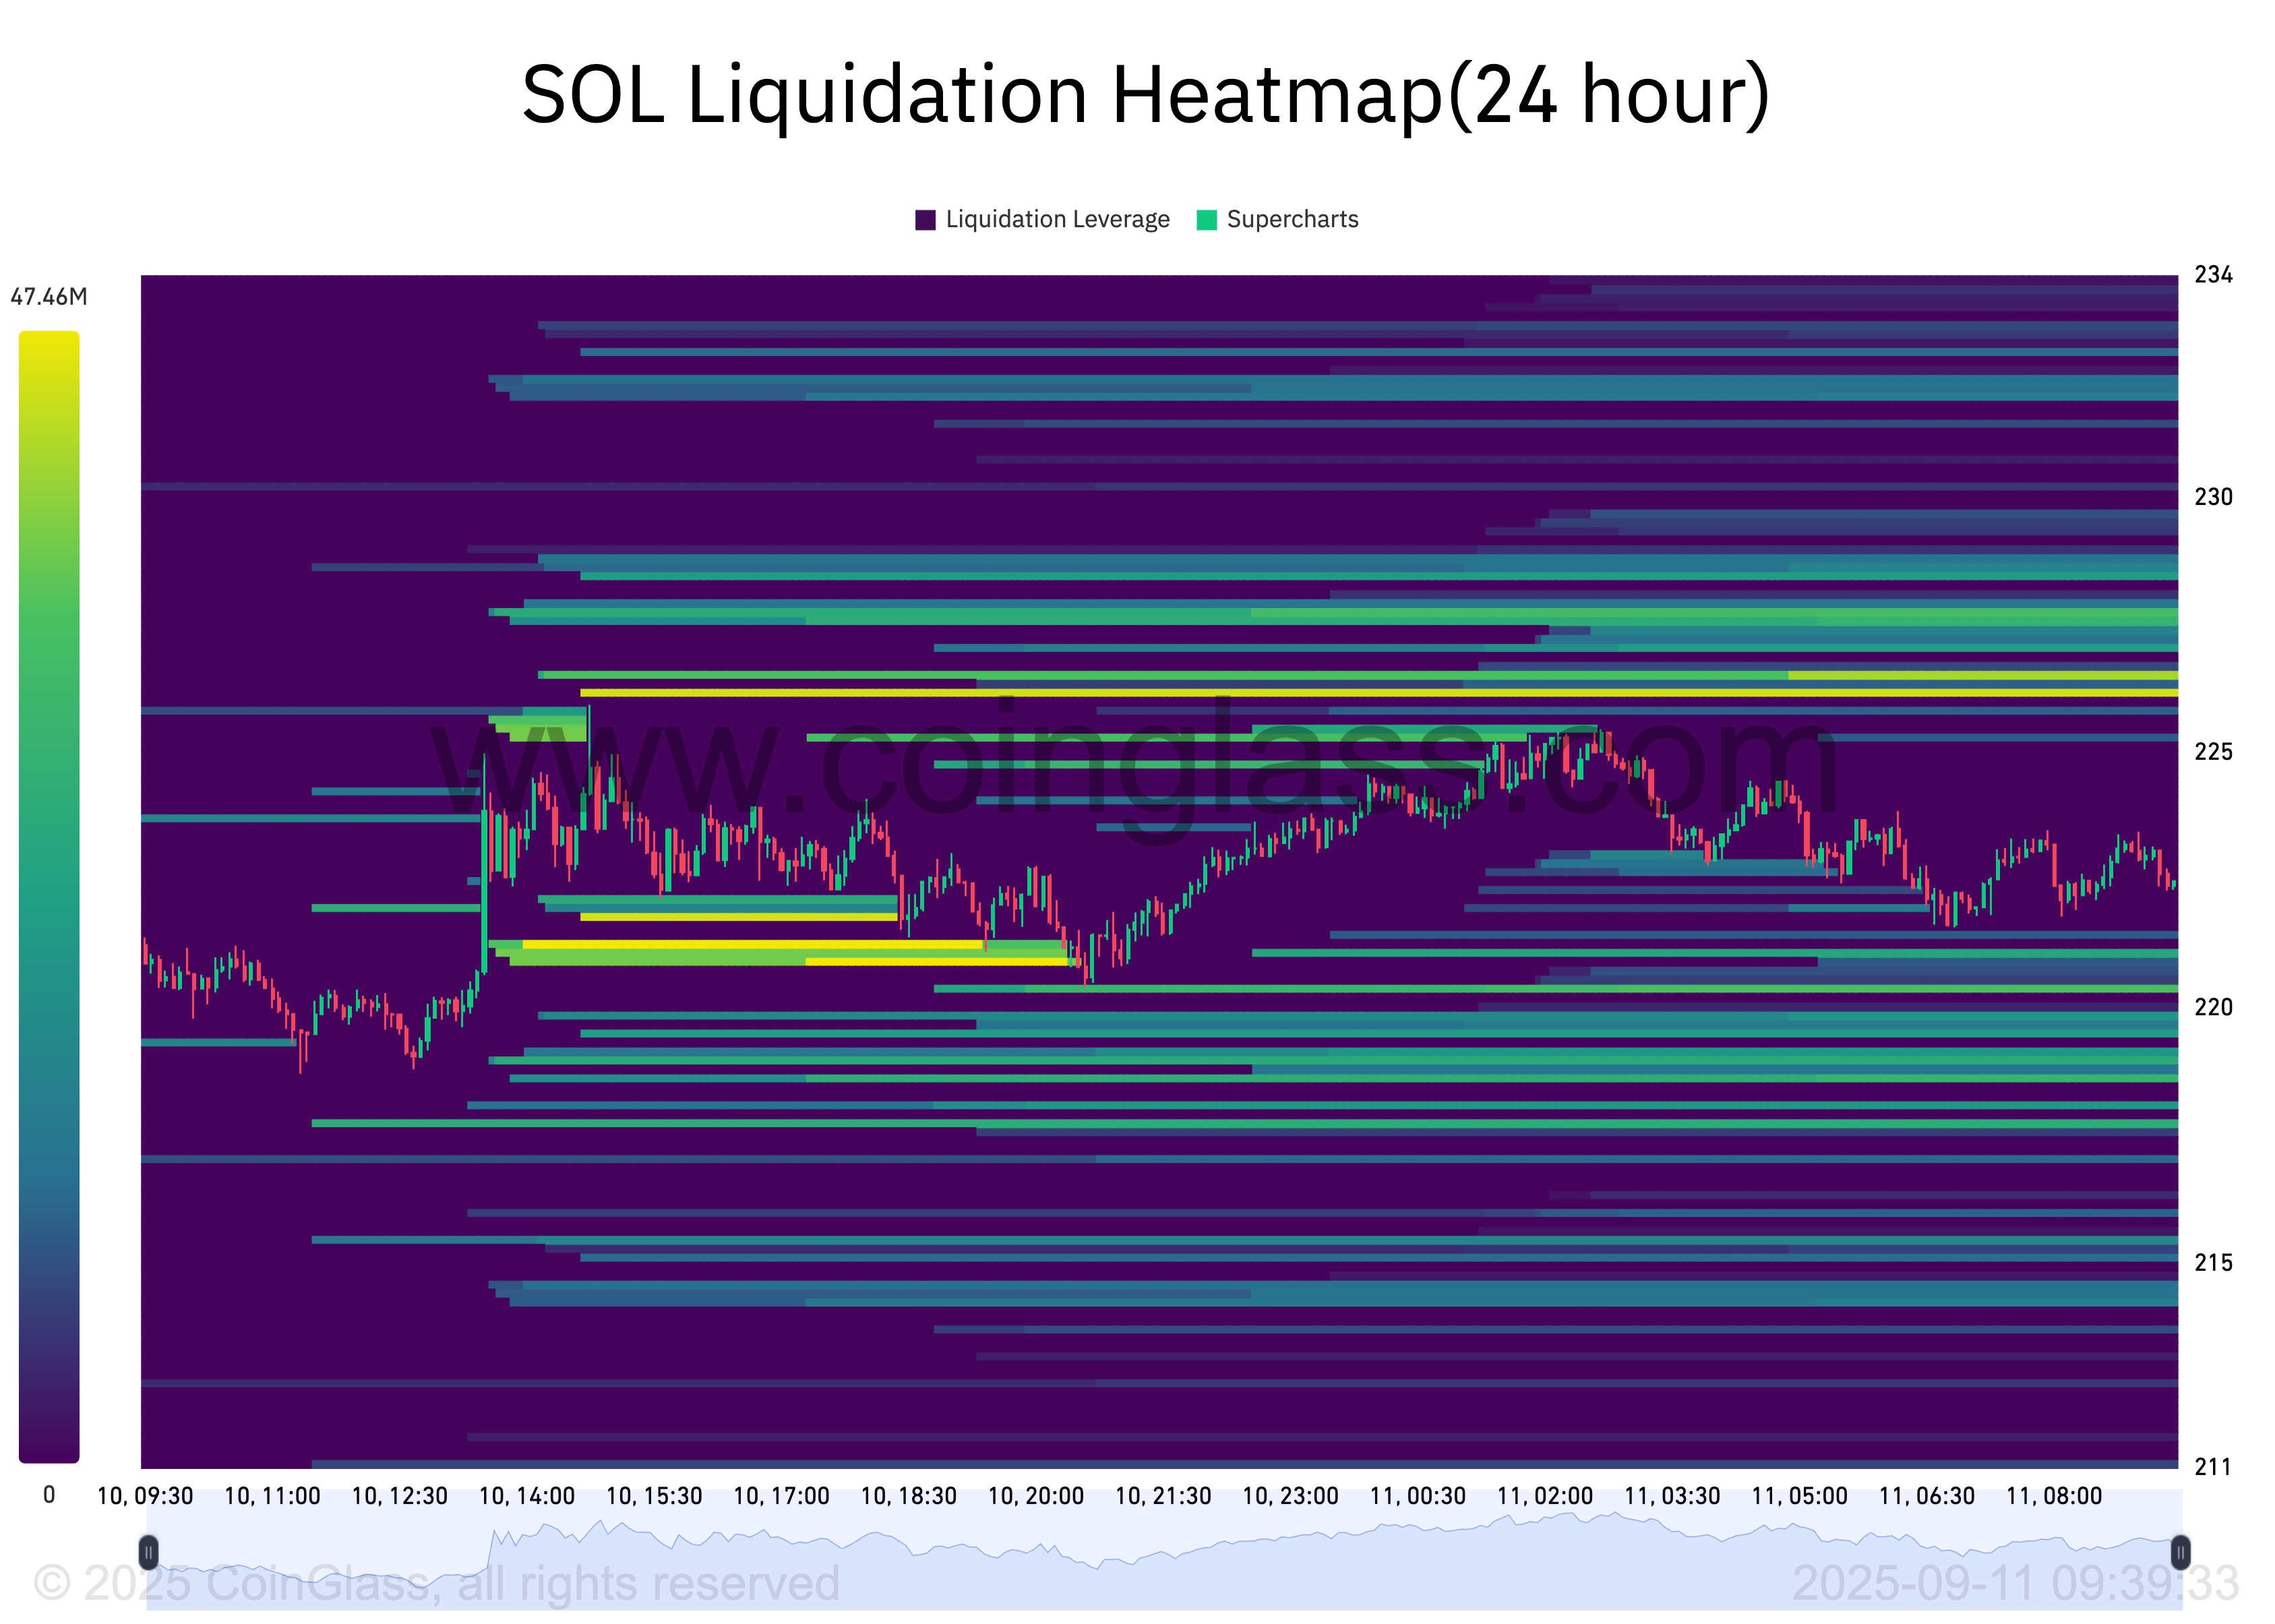
A liquidation heatmap highlights price levels where Leveraged positions are most vulnerable to liquidation. It tracks clusters of liquidity, with denser zones indicating where many stop-losses or margin calls are likely to be triggered.
When such liquidity clusters appear above the price, they act as magnets for market action. Traders anticipate that upward moves into these zones can trigger liquidations of short positions, creating additional buy pressure.
For SOL, the $226 liquidity pocket suggests that if price advances toward this level, it could set a wave of liquidations that could help drive SOL closer to the $250 mark.
Demand Could Drive Rally to $244 and Beyond
On the daily chart, SOL’s Relative Strength Index (RSI) is 62.92, showing rising demand. The RSI measures an asset’s overbought and oversold market conditions.
It ranges between 0 and 100, with values above 70 suggesting an asset is overbought and due for a dip. On the other hand, values under 30 indicate that an asset is oversold and could witness a rebound.
At 63.59, SOL’s RSI signals that its price has room for more rallies before buyers’ exhaustion sets in. If demand holds, SOL could rally to $244.70. A break above this level WOULD likely push the price to $252.23.
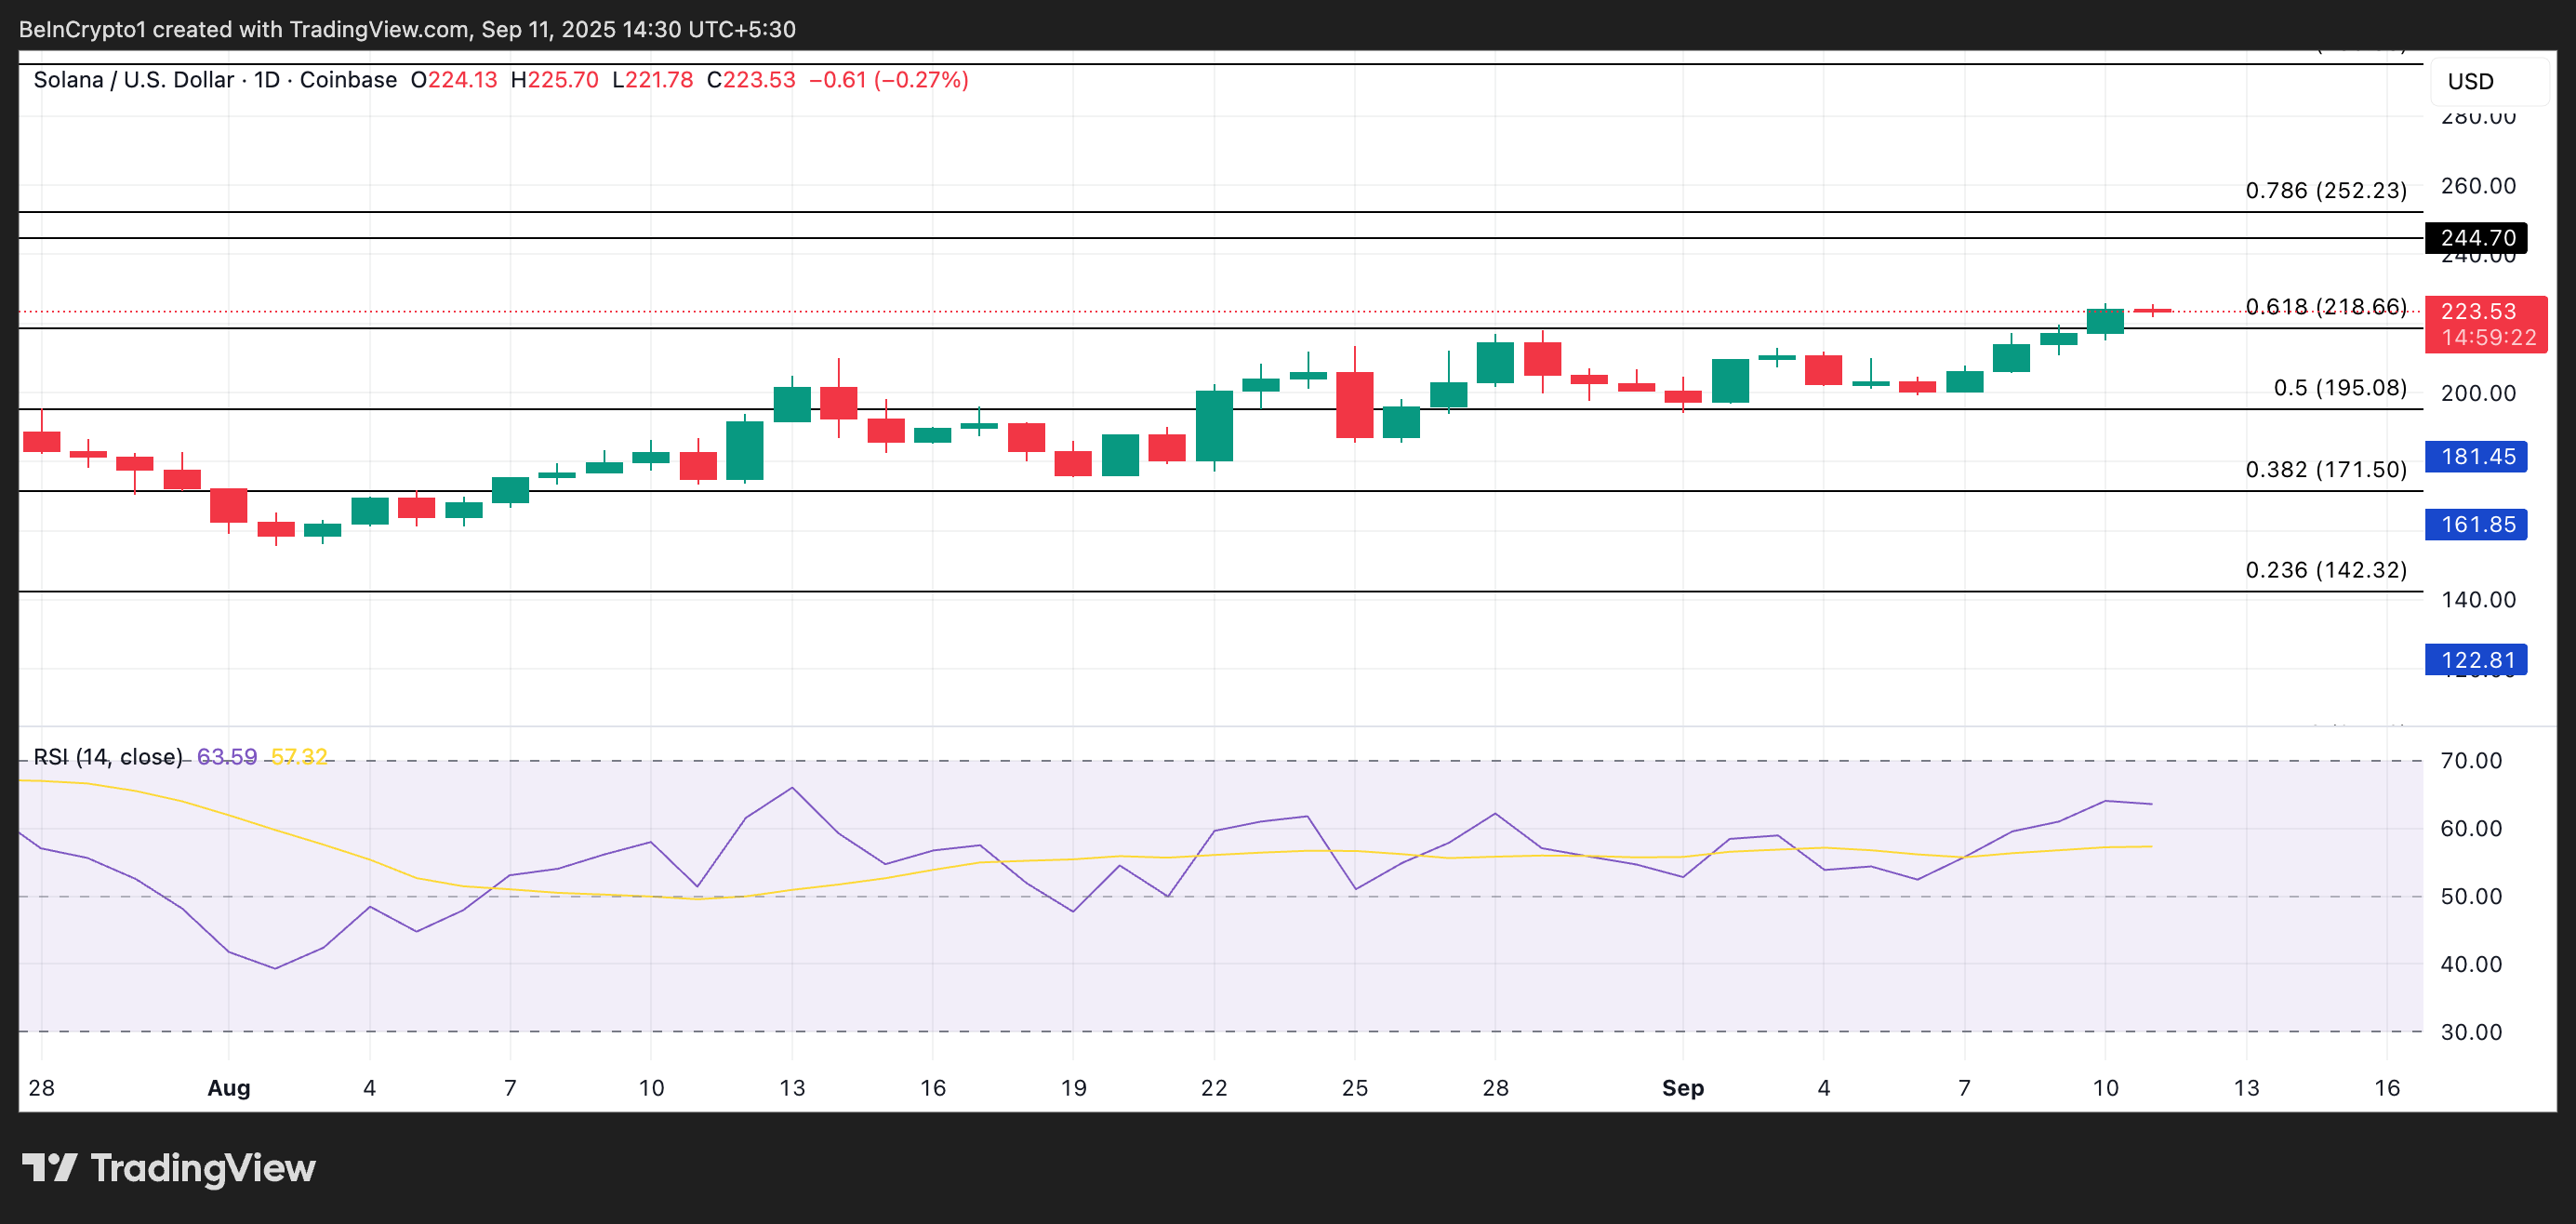
On the other hand, if buying weakens, SOL could fall below $218.66 and drop to $195.08.
