3 Reasons Why This Solana Price Surge Might Be Headed for a Correction

Solana's rally hits turbulence as three critical factors signal potential pullback ahead.
Overheated Momentum - The blistering pace of gains creates unsustainable pressure, leaving little room for consolidation before profit-taking kicks in.
Technical Resistance Walls - Key price levels loom overhead, acting as psychological barriers that historically trigger sell-offs among cautious traders.
Macro Headwinds Building - Broader market conditions start shifting, reminding everyone that in crypto, what goes up must eventually come down—usually right after the leverage maxes out.
Timing the top remains crypto's favorite guessing game, but these signals suggest even Solana's rocketship might need to refuel before the next moon mission.
Profit-Taking Isn’t Just A Risk Anymore
One of the first red flags comes from Solana’s Net Unrealized Profit/Loss (NUPL). This metric shows how much profit holders are sitting on without selling. On September 9, NUPL hit 0.321 — its second-highest reading in the past month.
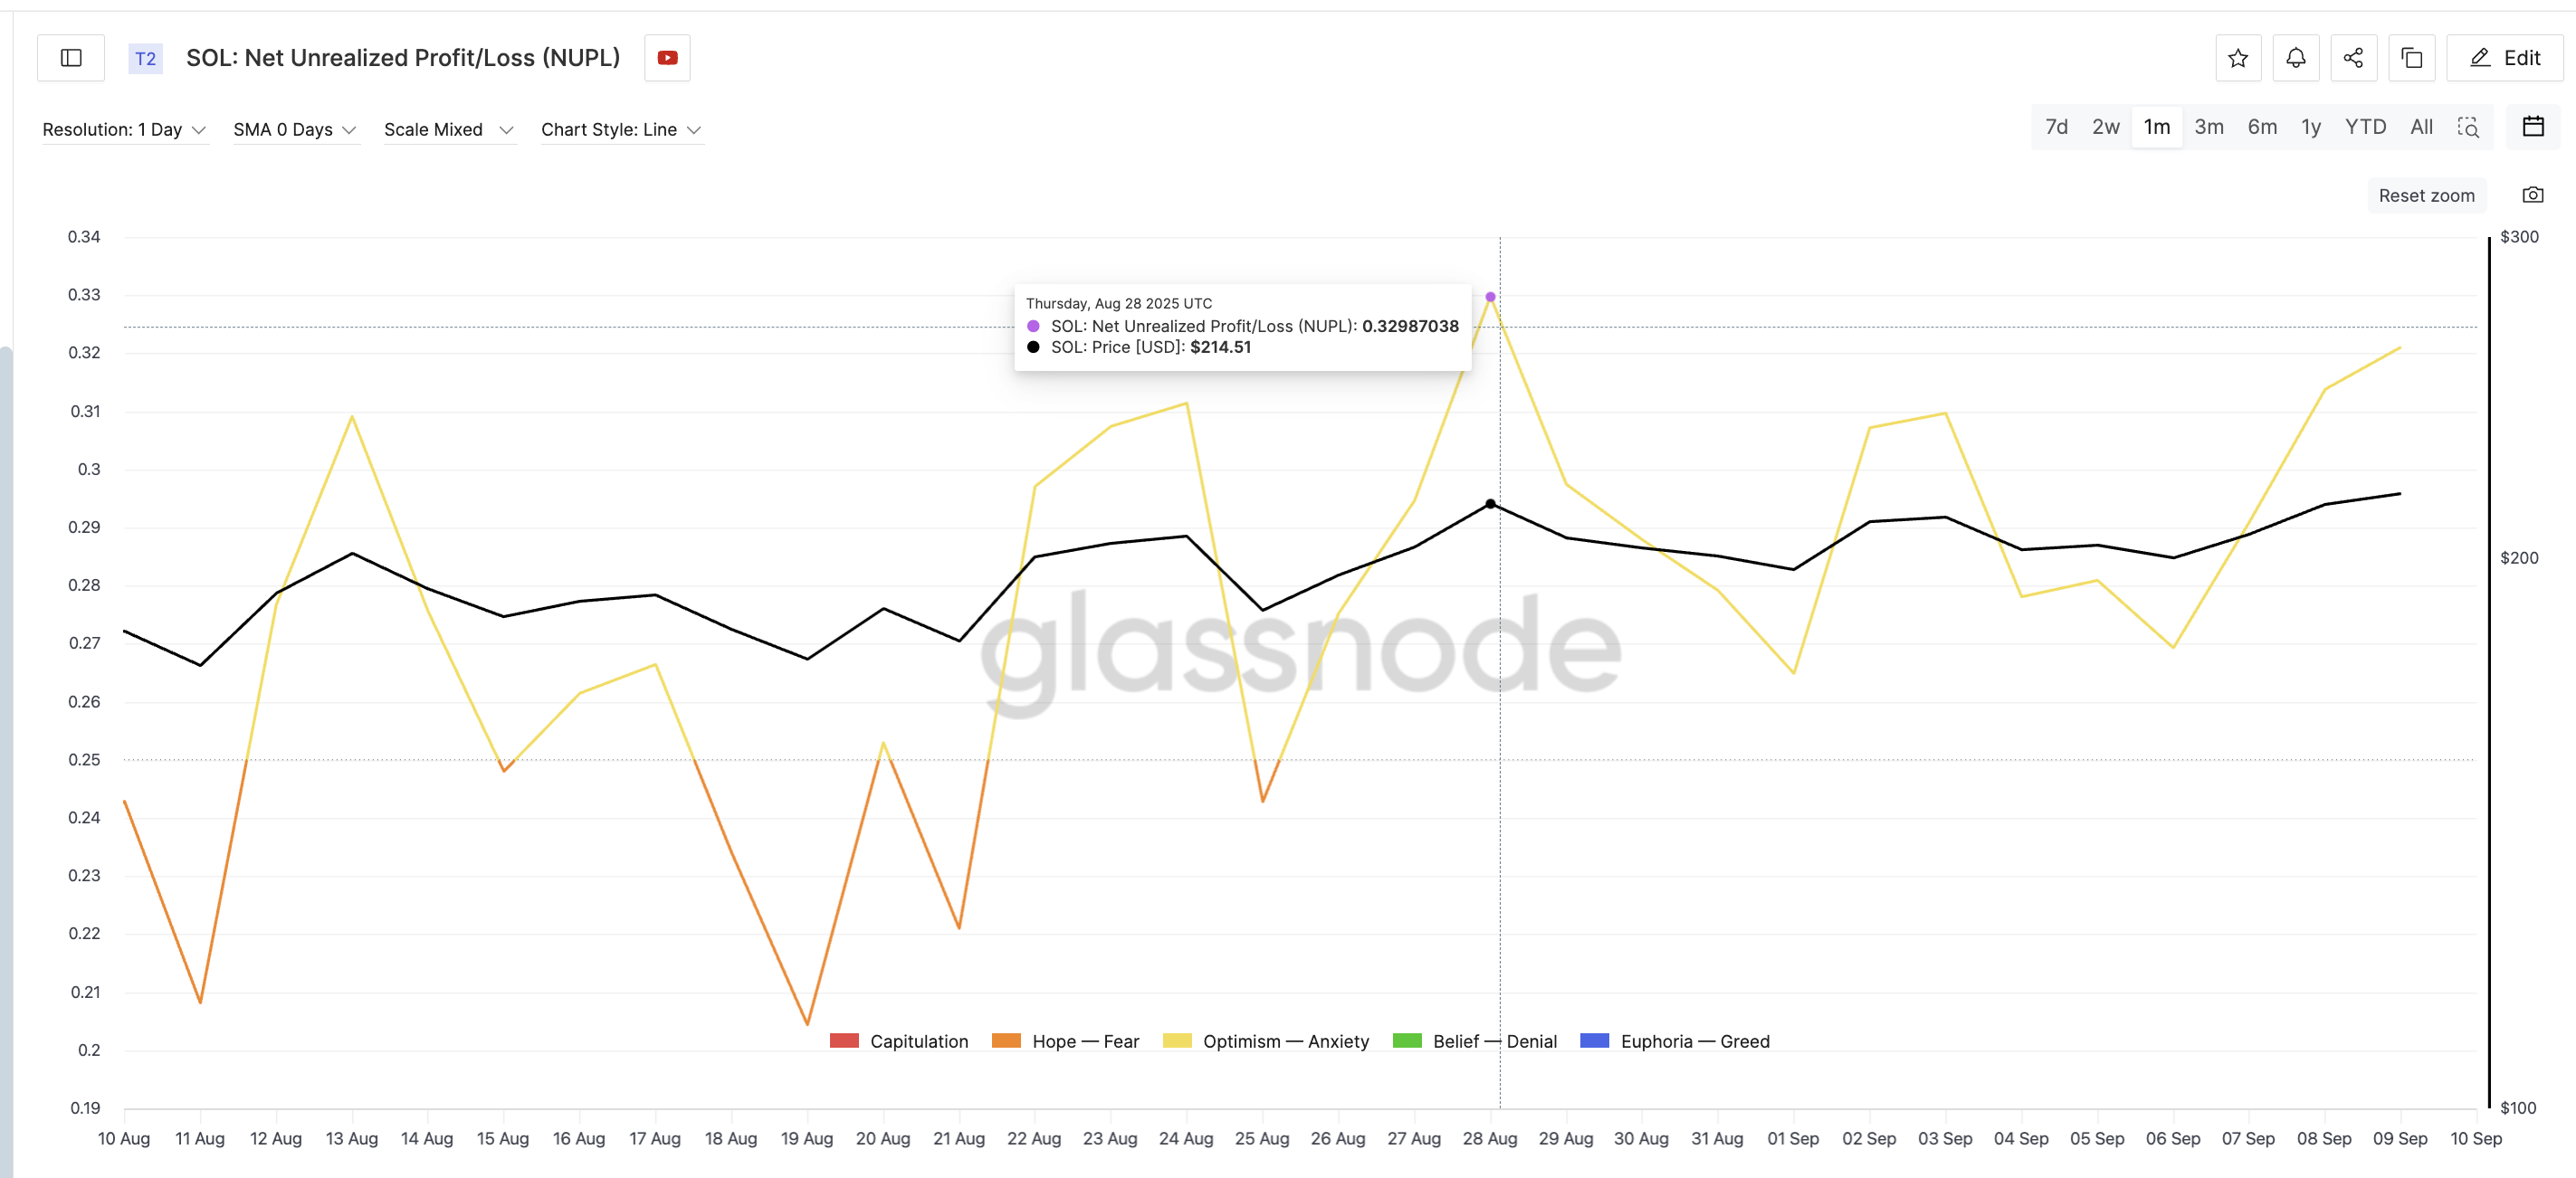
The last peak came on August 28, when NUPL hit 0.329. Soon after, SOL corrected by about 8%. These high readings often mean holders are sitting on bigger paper gains, which can fuel profit-taking.
This time, the setup looks similar. While a high NUPL doesn’t guarantee a sell-off, it does suggest that the risk of booking profits is rising again.
The second warning sign comes from exchange net position change, which tracks whether tokens are leaving exchanges (bullish) or being deposited back (bearish).
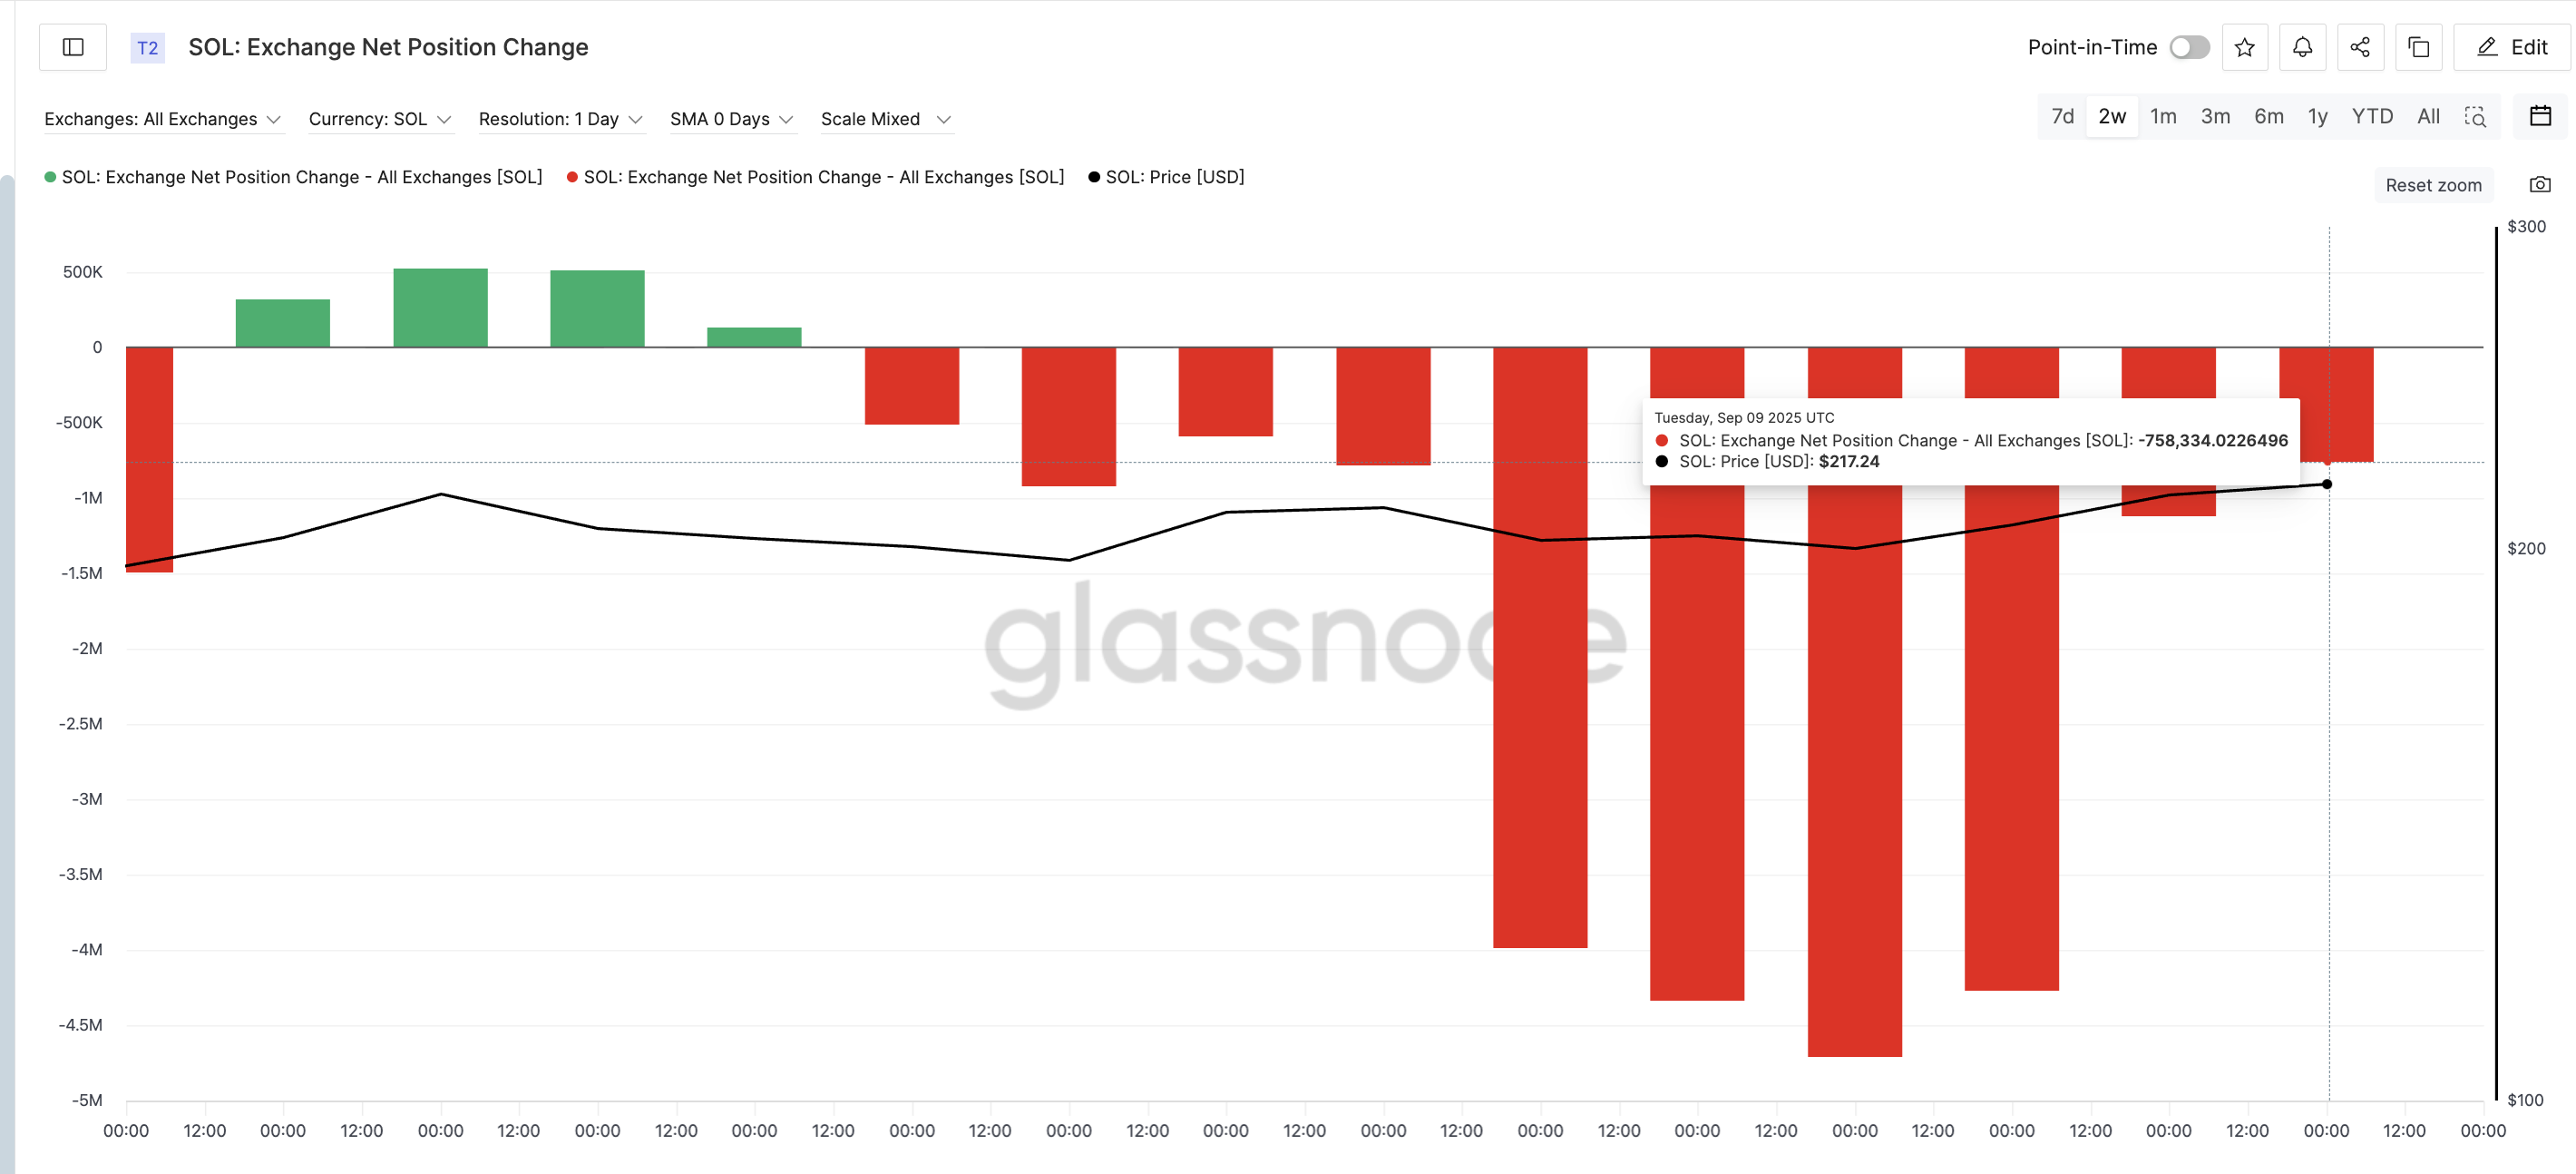
On September 6, when Solana traded around $200, net outflows were -4.7 million SOL. By September 9, with the price near $217, outflows had dropped to -758,000 SOL. That’s an 84% decline in buying pressure within just three days, even as the price climbed almost 10%.
This mismatch, weaker outflows while the token rises, suggests that profit booking could already be underway. Buyers are slowing down, while sellers may be quietly stepping in.
Solana Price Chart Flashes a Bearish Sign With Key Pullback Levels
Finally, the chart itself is flashing a warning, or rather, the third rally-stalling reason. Between August 14 and September 10, the Solana price made a higher high, but the Relative Strength Index (RSI) printed a lower high.
RSI is a momentum indicator that measures buying and selling strength on a scale from 0 to 100.
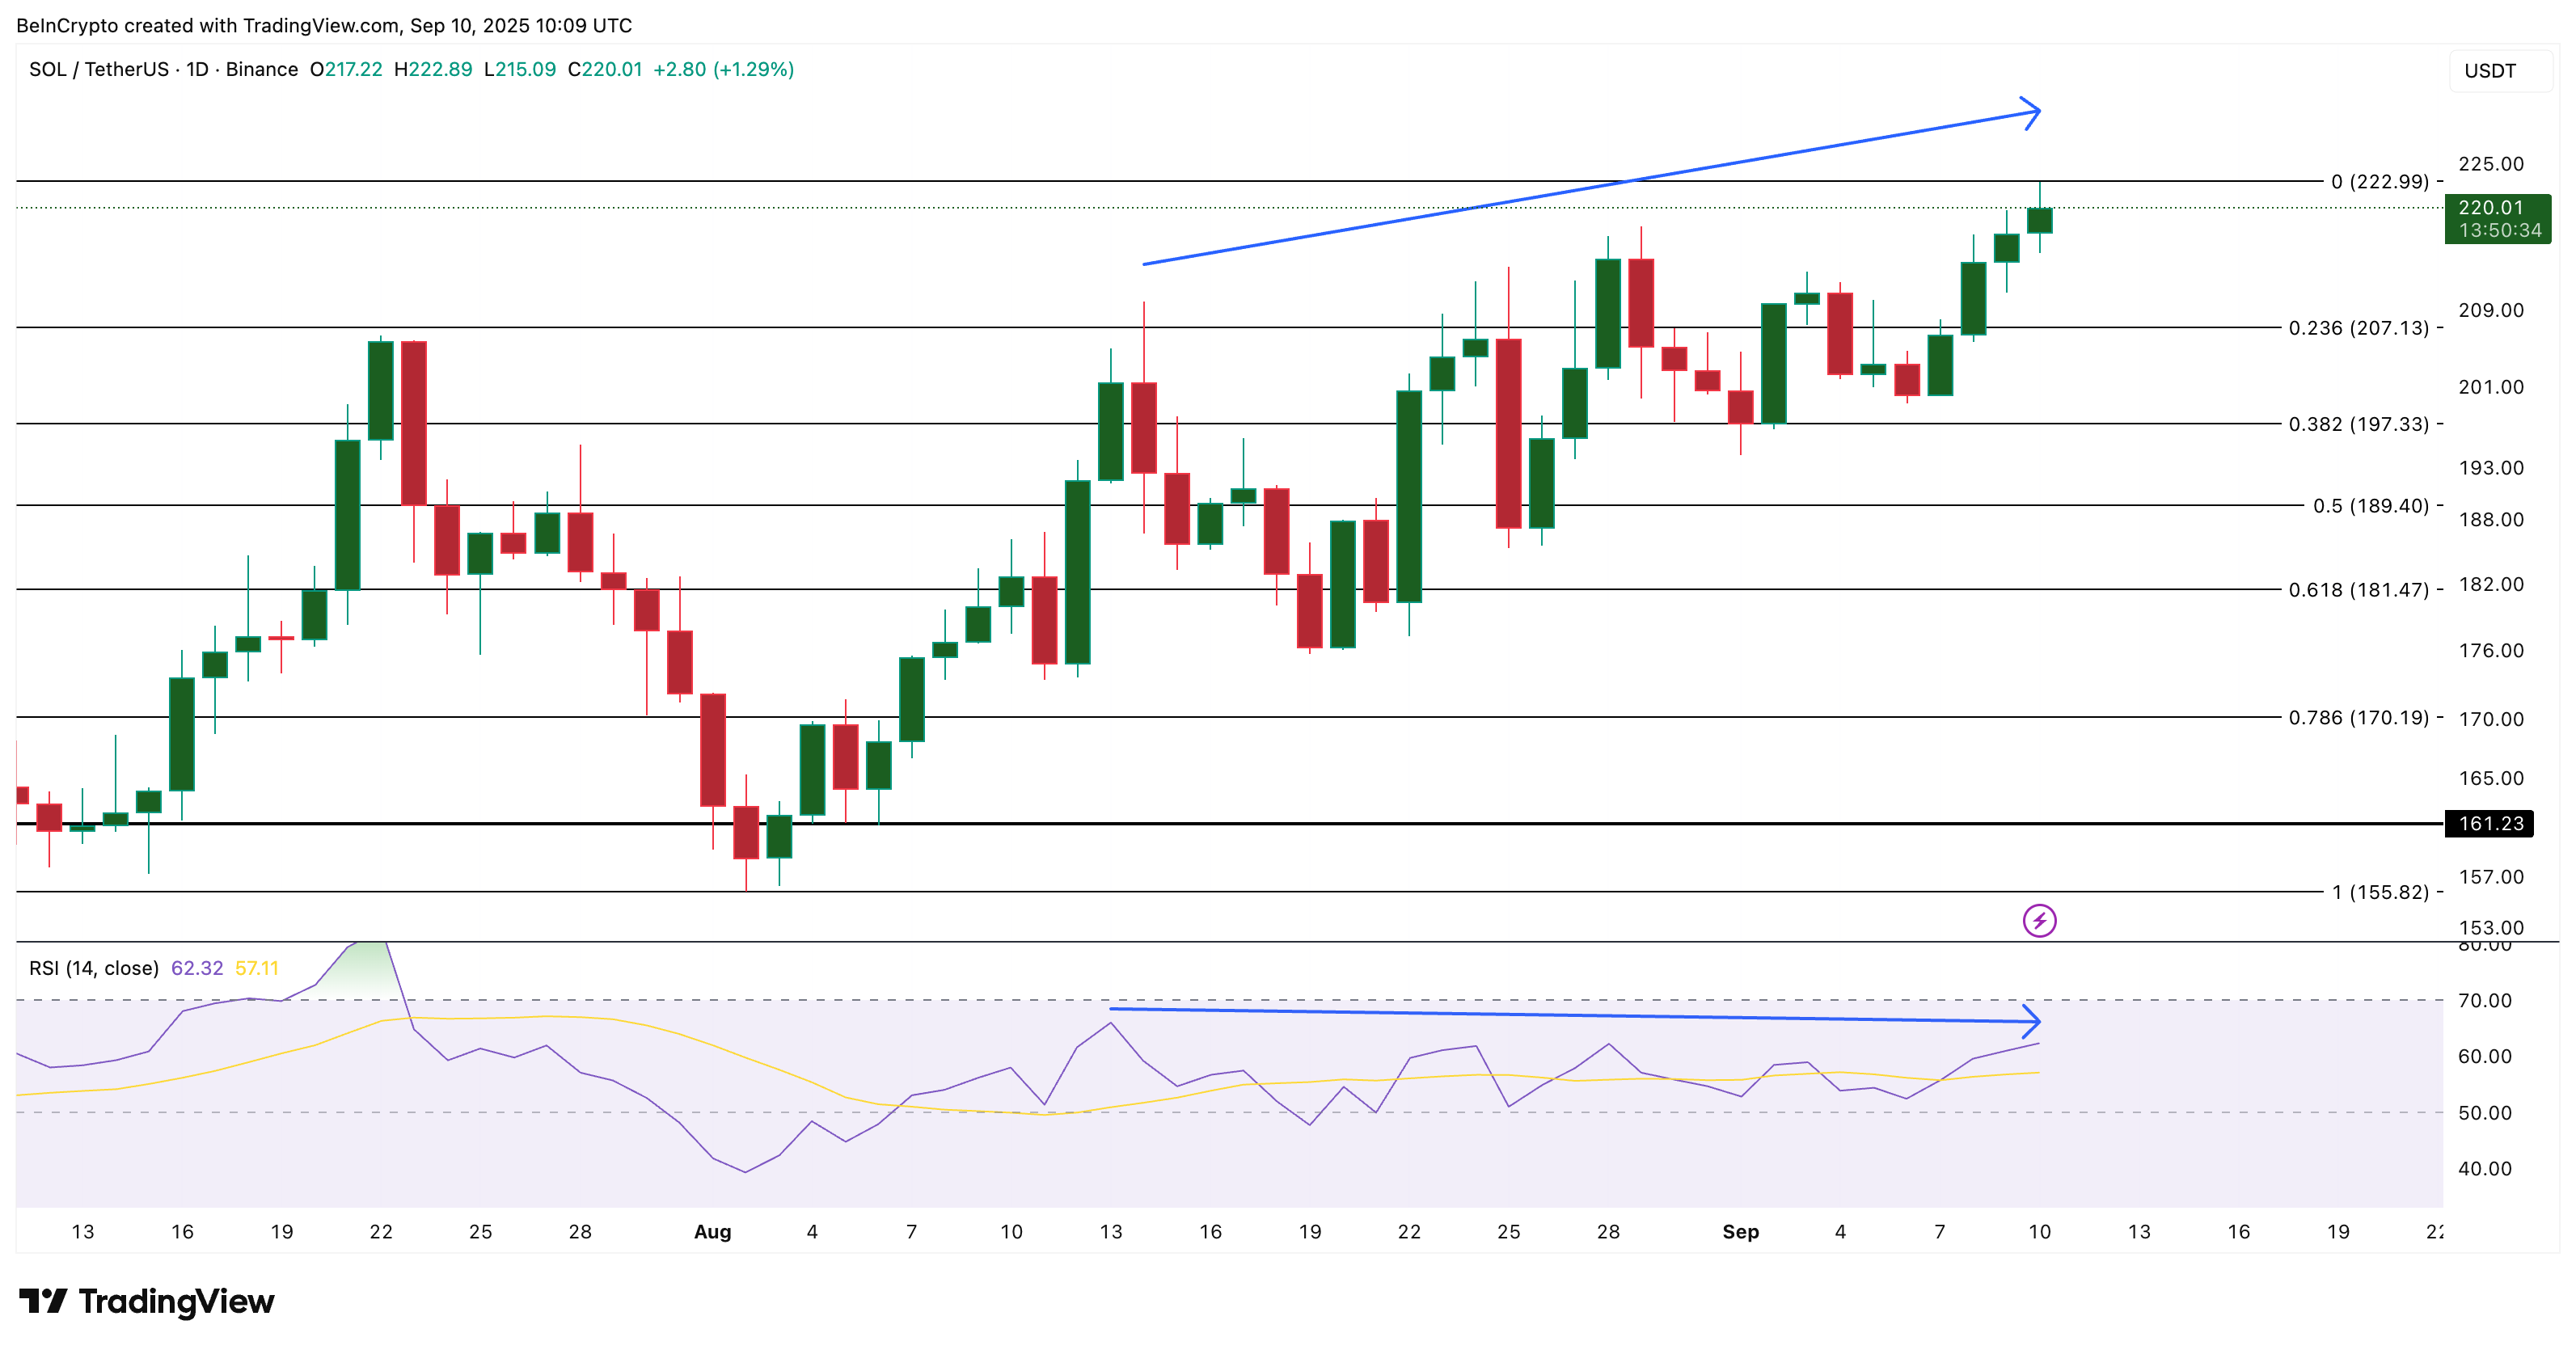
This is called a bearish divergence. It shows that momentum is fading even as price climbs: buyers are pushing higher, but sellers are applying more pressure in the background.
For traders, that often sets the stage for a pullback. The first level to watch is $207. A daily close below that could open the way to $197, and then $189. On the flip side, a daily close above $222 WOULD invalidate this pullback thesis and hand control back to the bulls.
