Hedera (HBAR) Price Plunge Defies Major Whale Accumulation—Here’s Why

Whales are loading up on HBAR even as prices flirt with new lows—a classic crypto contradiction that has traders scratching their heads.
The Big Money Moves
Major investors aren’t just dipping toes—they’re diving deep into Hedera despite the gloomy price action. These aren’t retail gambles; these are calculated positions from players who typically see further ahead than your average moon-bagger.
Price Versus Perception
HBAR’s chart tells a story of struggle—testing support levels, flirting with downtrends, and generally behaving like an asset that didn’t get the whale memo. Sometimes the market ignores smart money until it suddenly doesn’t.
Because nothing says 'sound investment' like watching billionaires play chicken with a falling knife while you cheer from the sidelines.
Whales Accumulate Over $11 Million In HBAR
On-chain data shows that whales have been steadily accumulating Hedera, even as the token’s price trends lower. Over the past week, two key cohorts — wallets holding at least 1 million and 10 million HBAR — have added notably to their balances.
The 1 million HBAR cohort increased from 84.33 to 86.30 accounts, indicating an addition of at least 1.97 million tokens, valued at approximately $445,000 at the current price of $0.226. The 10 million HBAR cohort increased from 108.62 to 113.45 accounts, translating into at least 48.3 million tokens, worth approximately $10.92 million.
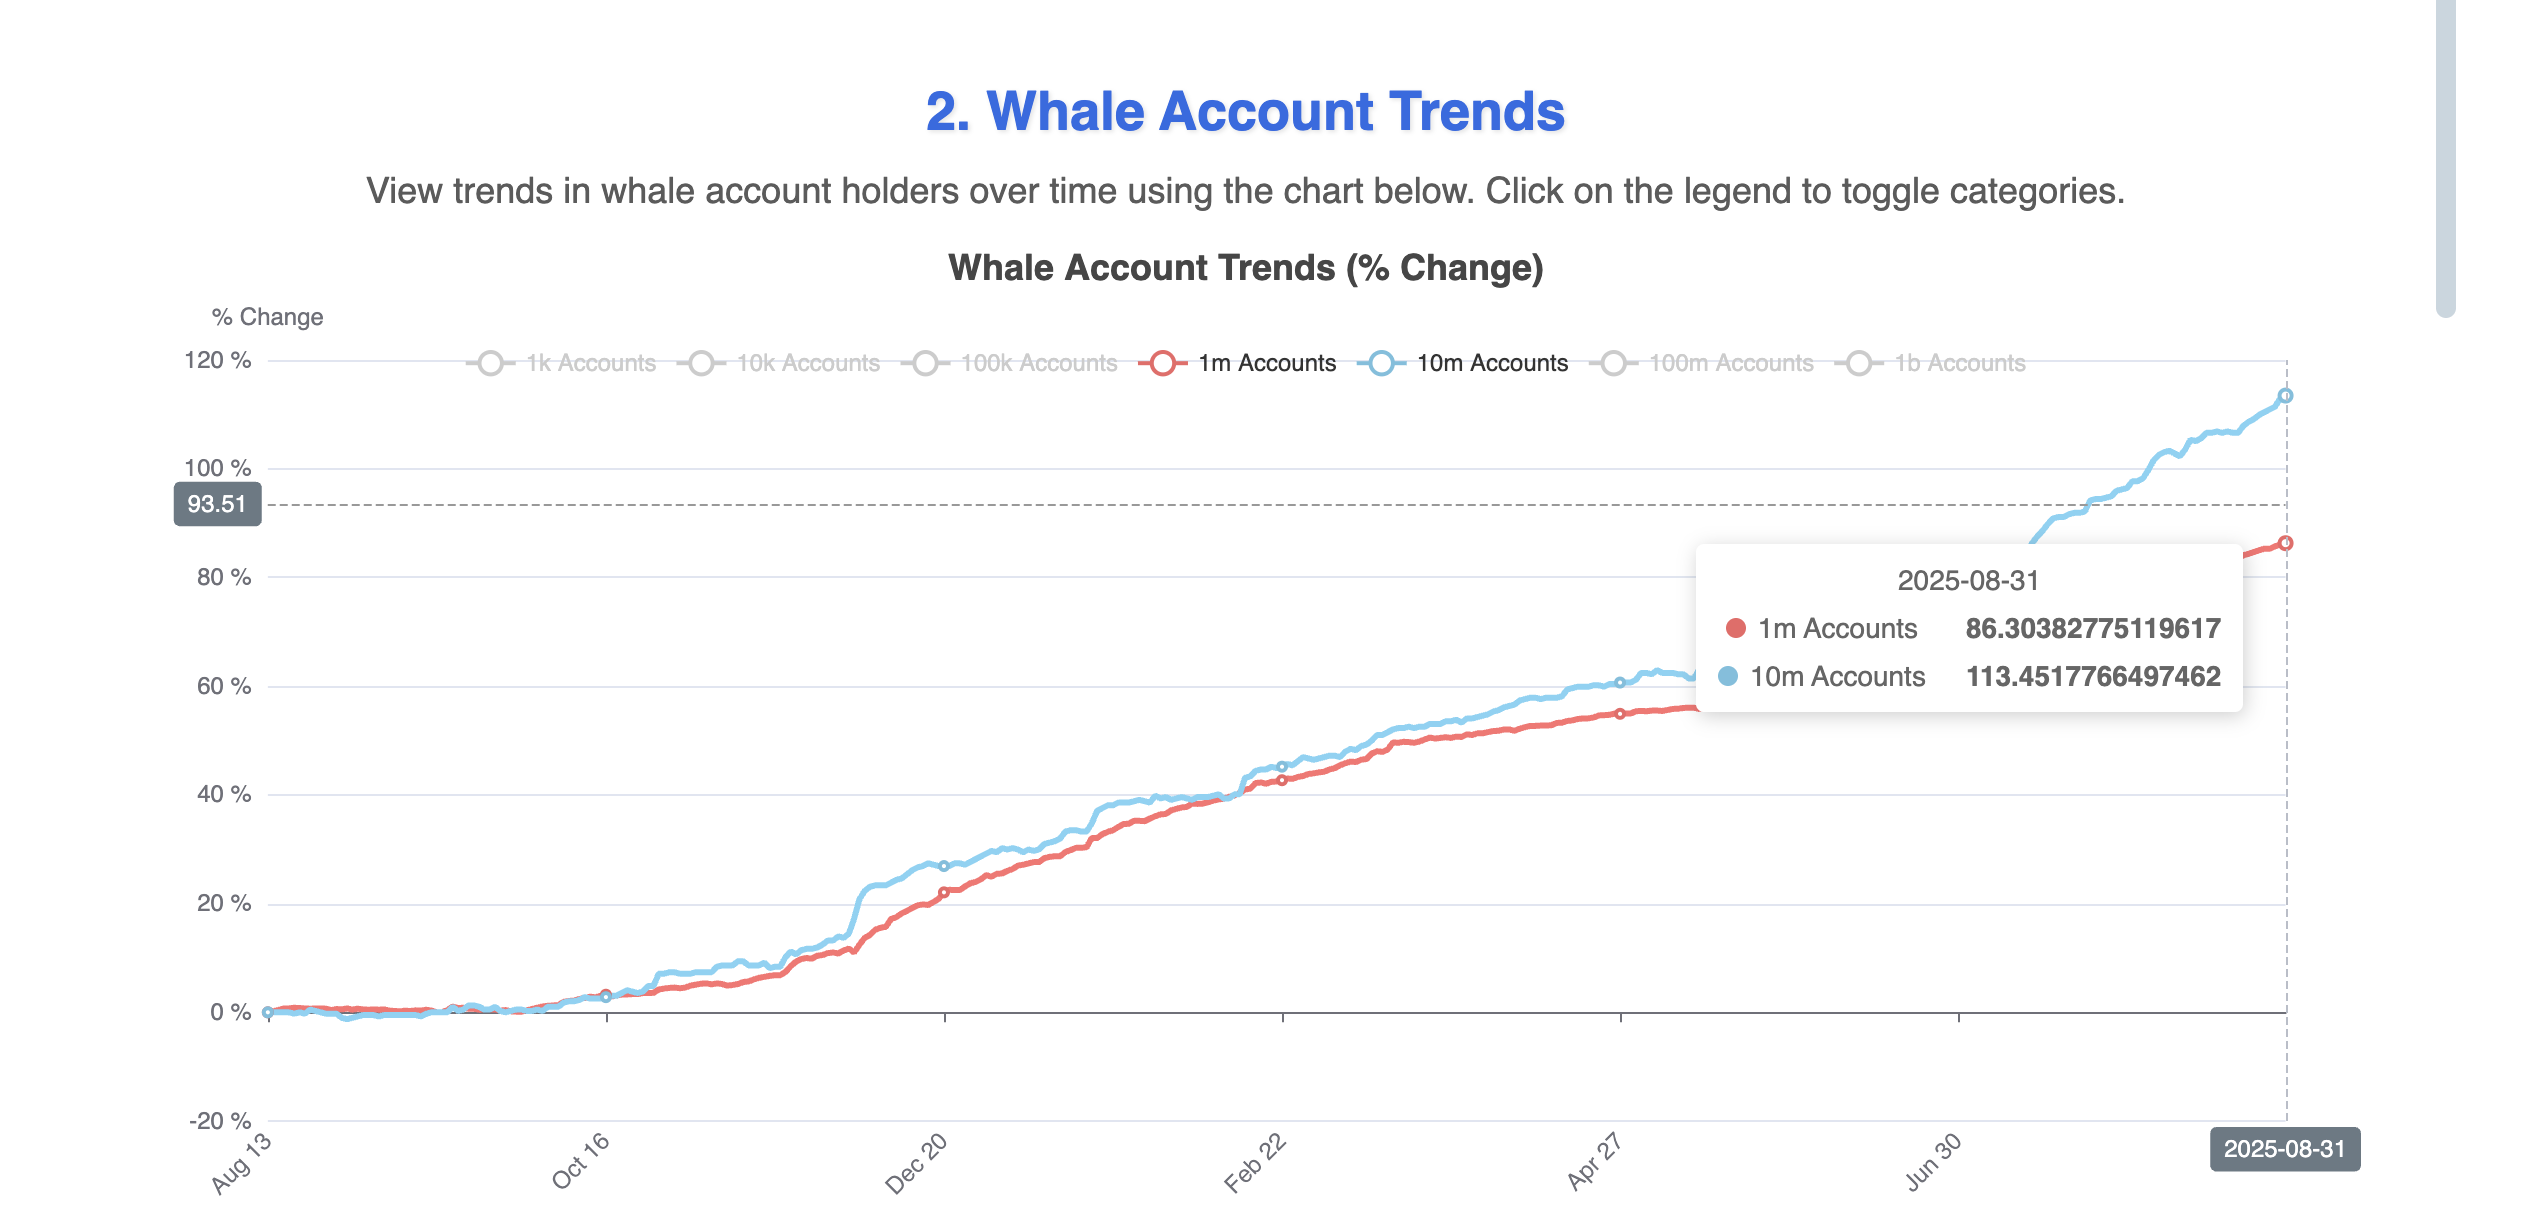
In total, whales have acquired more than 50 million HBAR, valued at nearly $11.36 million, over the past week. This steady buying suggests that large investors remain committed despite the Hedera price’s month-long downtrend.
But whale accumulation does not always translate to immediate price gains. Retail traders, who often dominate short-term flows, may still be selling. That is where technical signals, such as the RSI divergence, provide important context.
Hidden Bearish Divergence Clouds Outlook
The Relative Strength Index (RSI) is a momentum indicator that measures whether an asset is overbought or oversold. Divergences between price action and RSI often provide early warning signals.
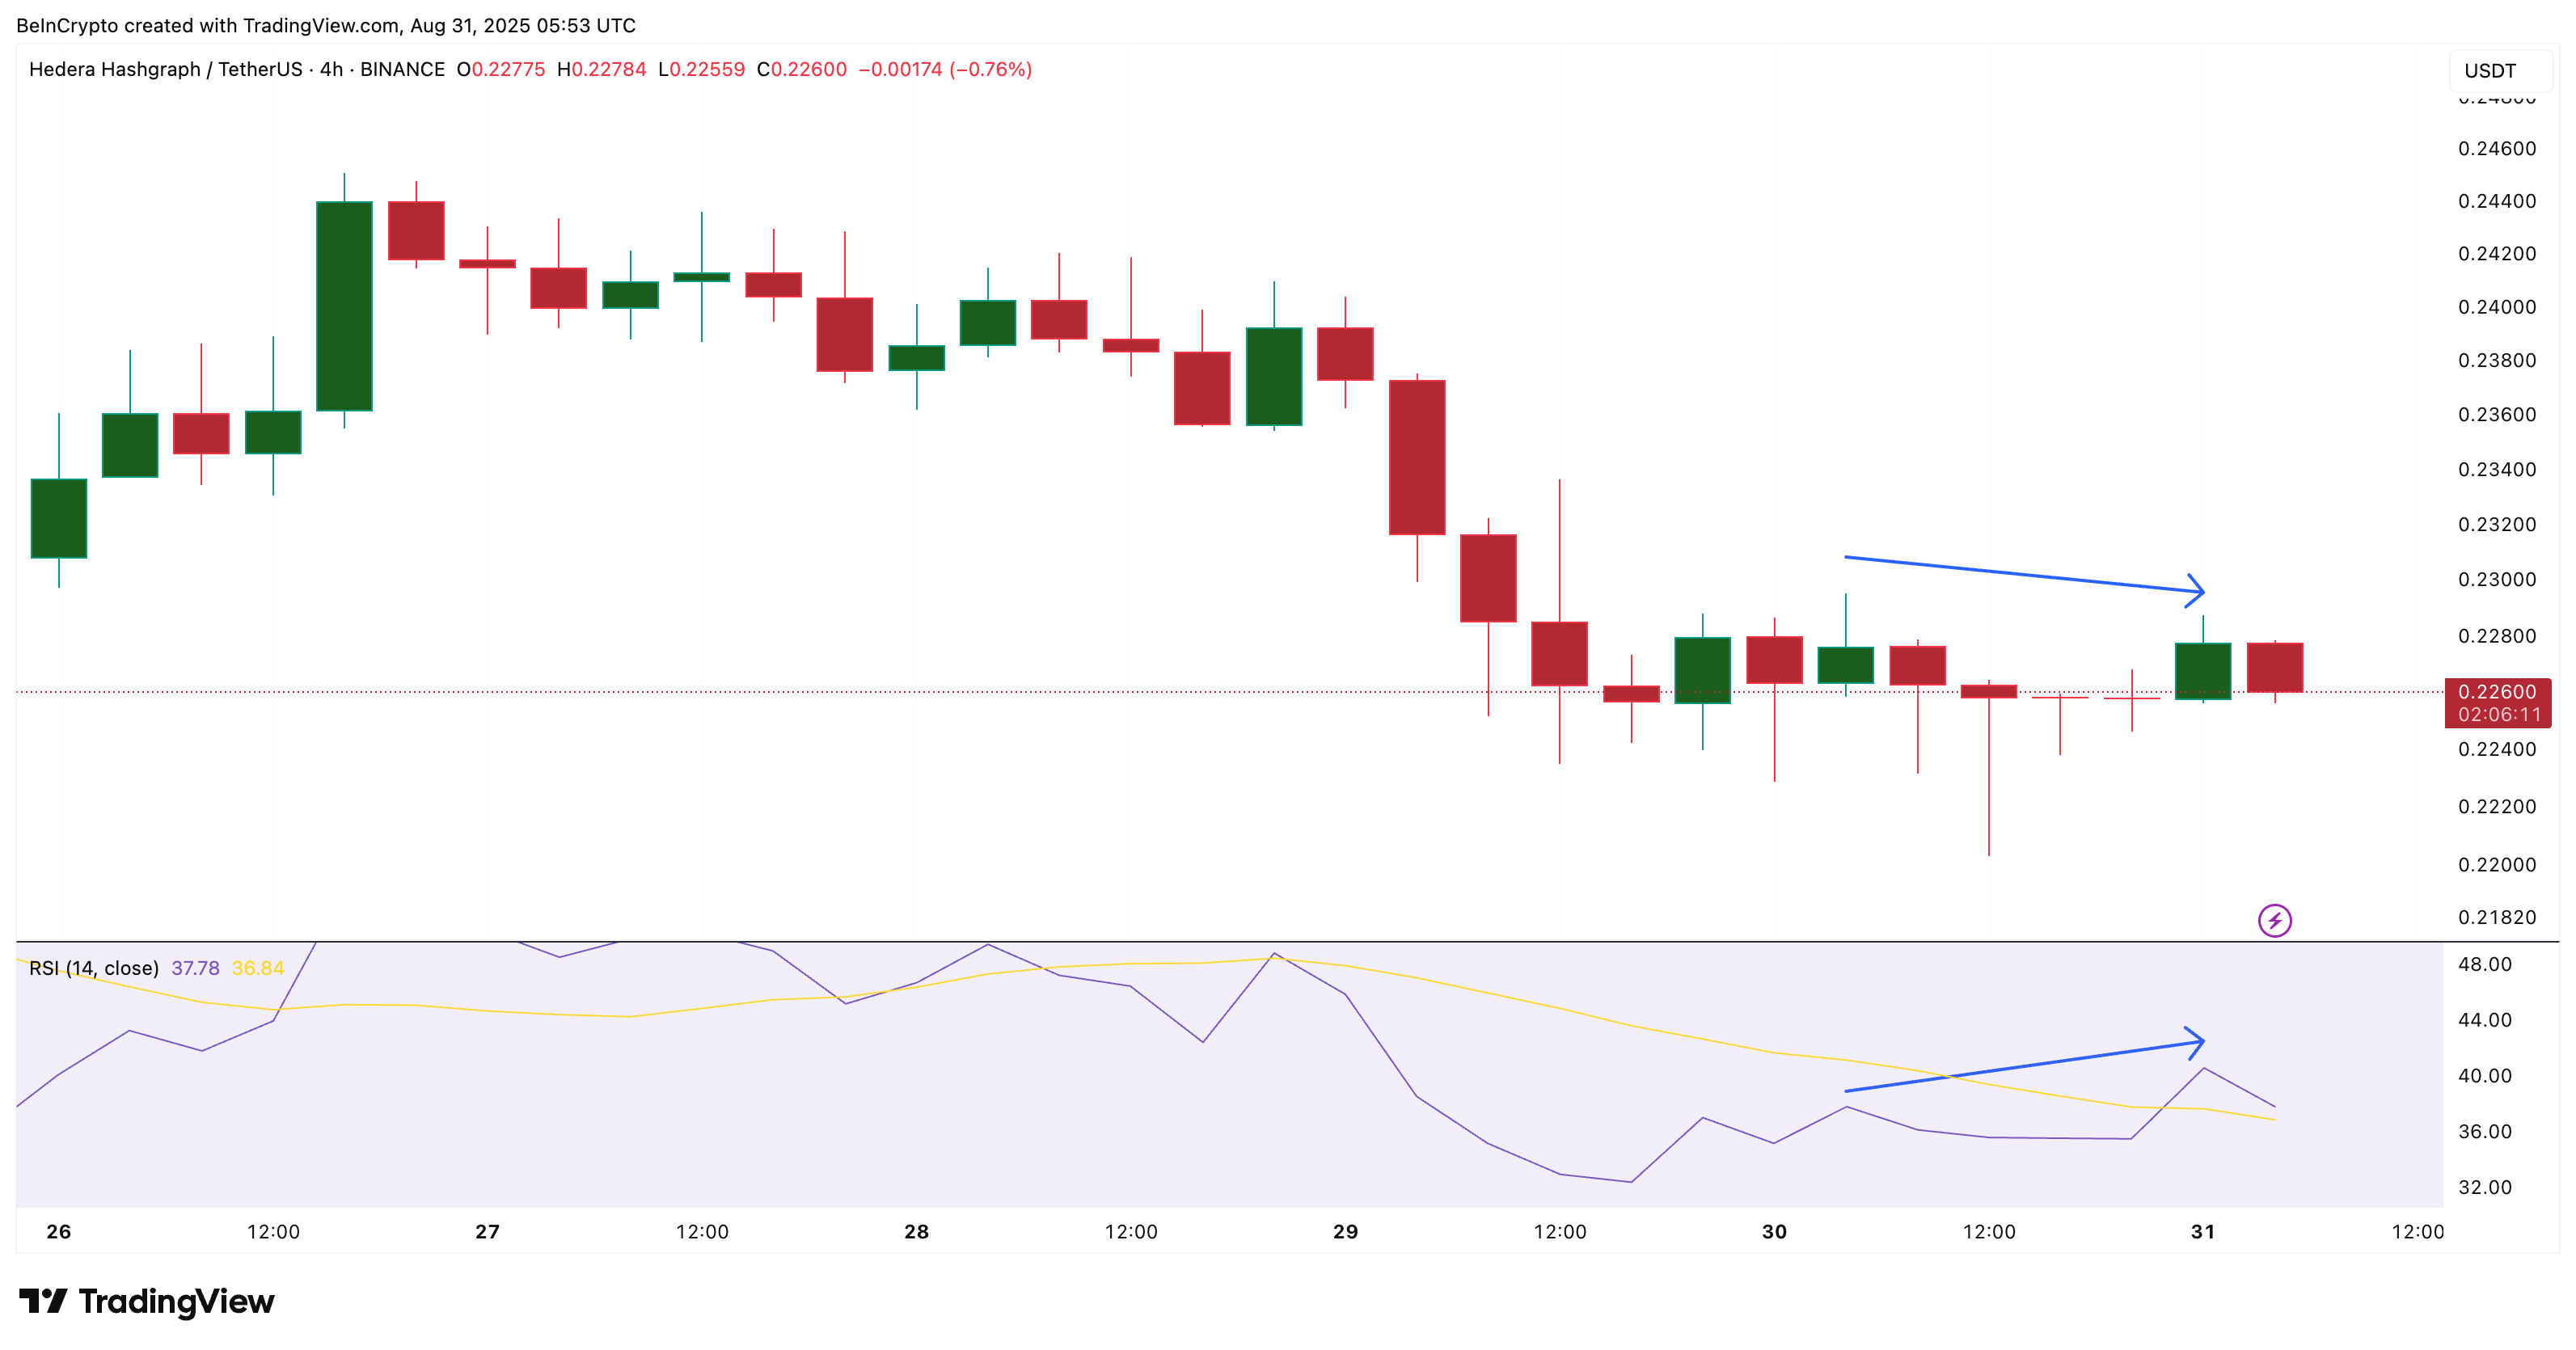
On the 4-hour chart, HBAR has formed a hidden bearish divergence: while price has made lower highs, RSI has printed higher highs. This pattern typically suggests that selling pressure remains in control, even if momentum indicators look stronger on the surface.
In practice, it means that despite whales adding millions of tokens, the underlying trend remains tilted toward weakness, possibly due to retail-centric selling pressure.
This divergence reinforces the risk that the HBAR price could continue sliding, particularly if retail selling outweighs whale accumulation. It shows that while whales may be clinging to optimism after HBAR’s massive rally earlier this year, momentum in the near term remains fragile.
Hedera (HBAR) Price Levels Highlights Risk
The daily HBAR price chart highlights the critical levels that will define HBAR’s path in the coming days. The immediate support to watch is at $0.219. A decisive daily close below this level WOULD expose the price to deeper losses and confirm the continuation of the month-long downtrend.
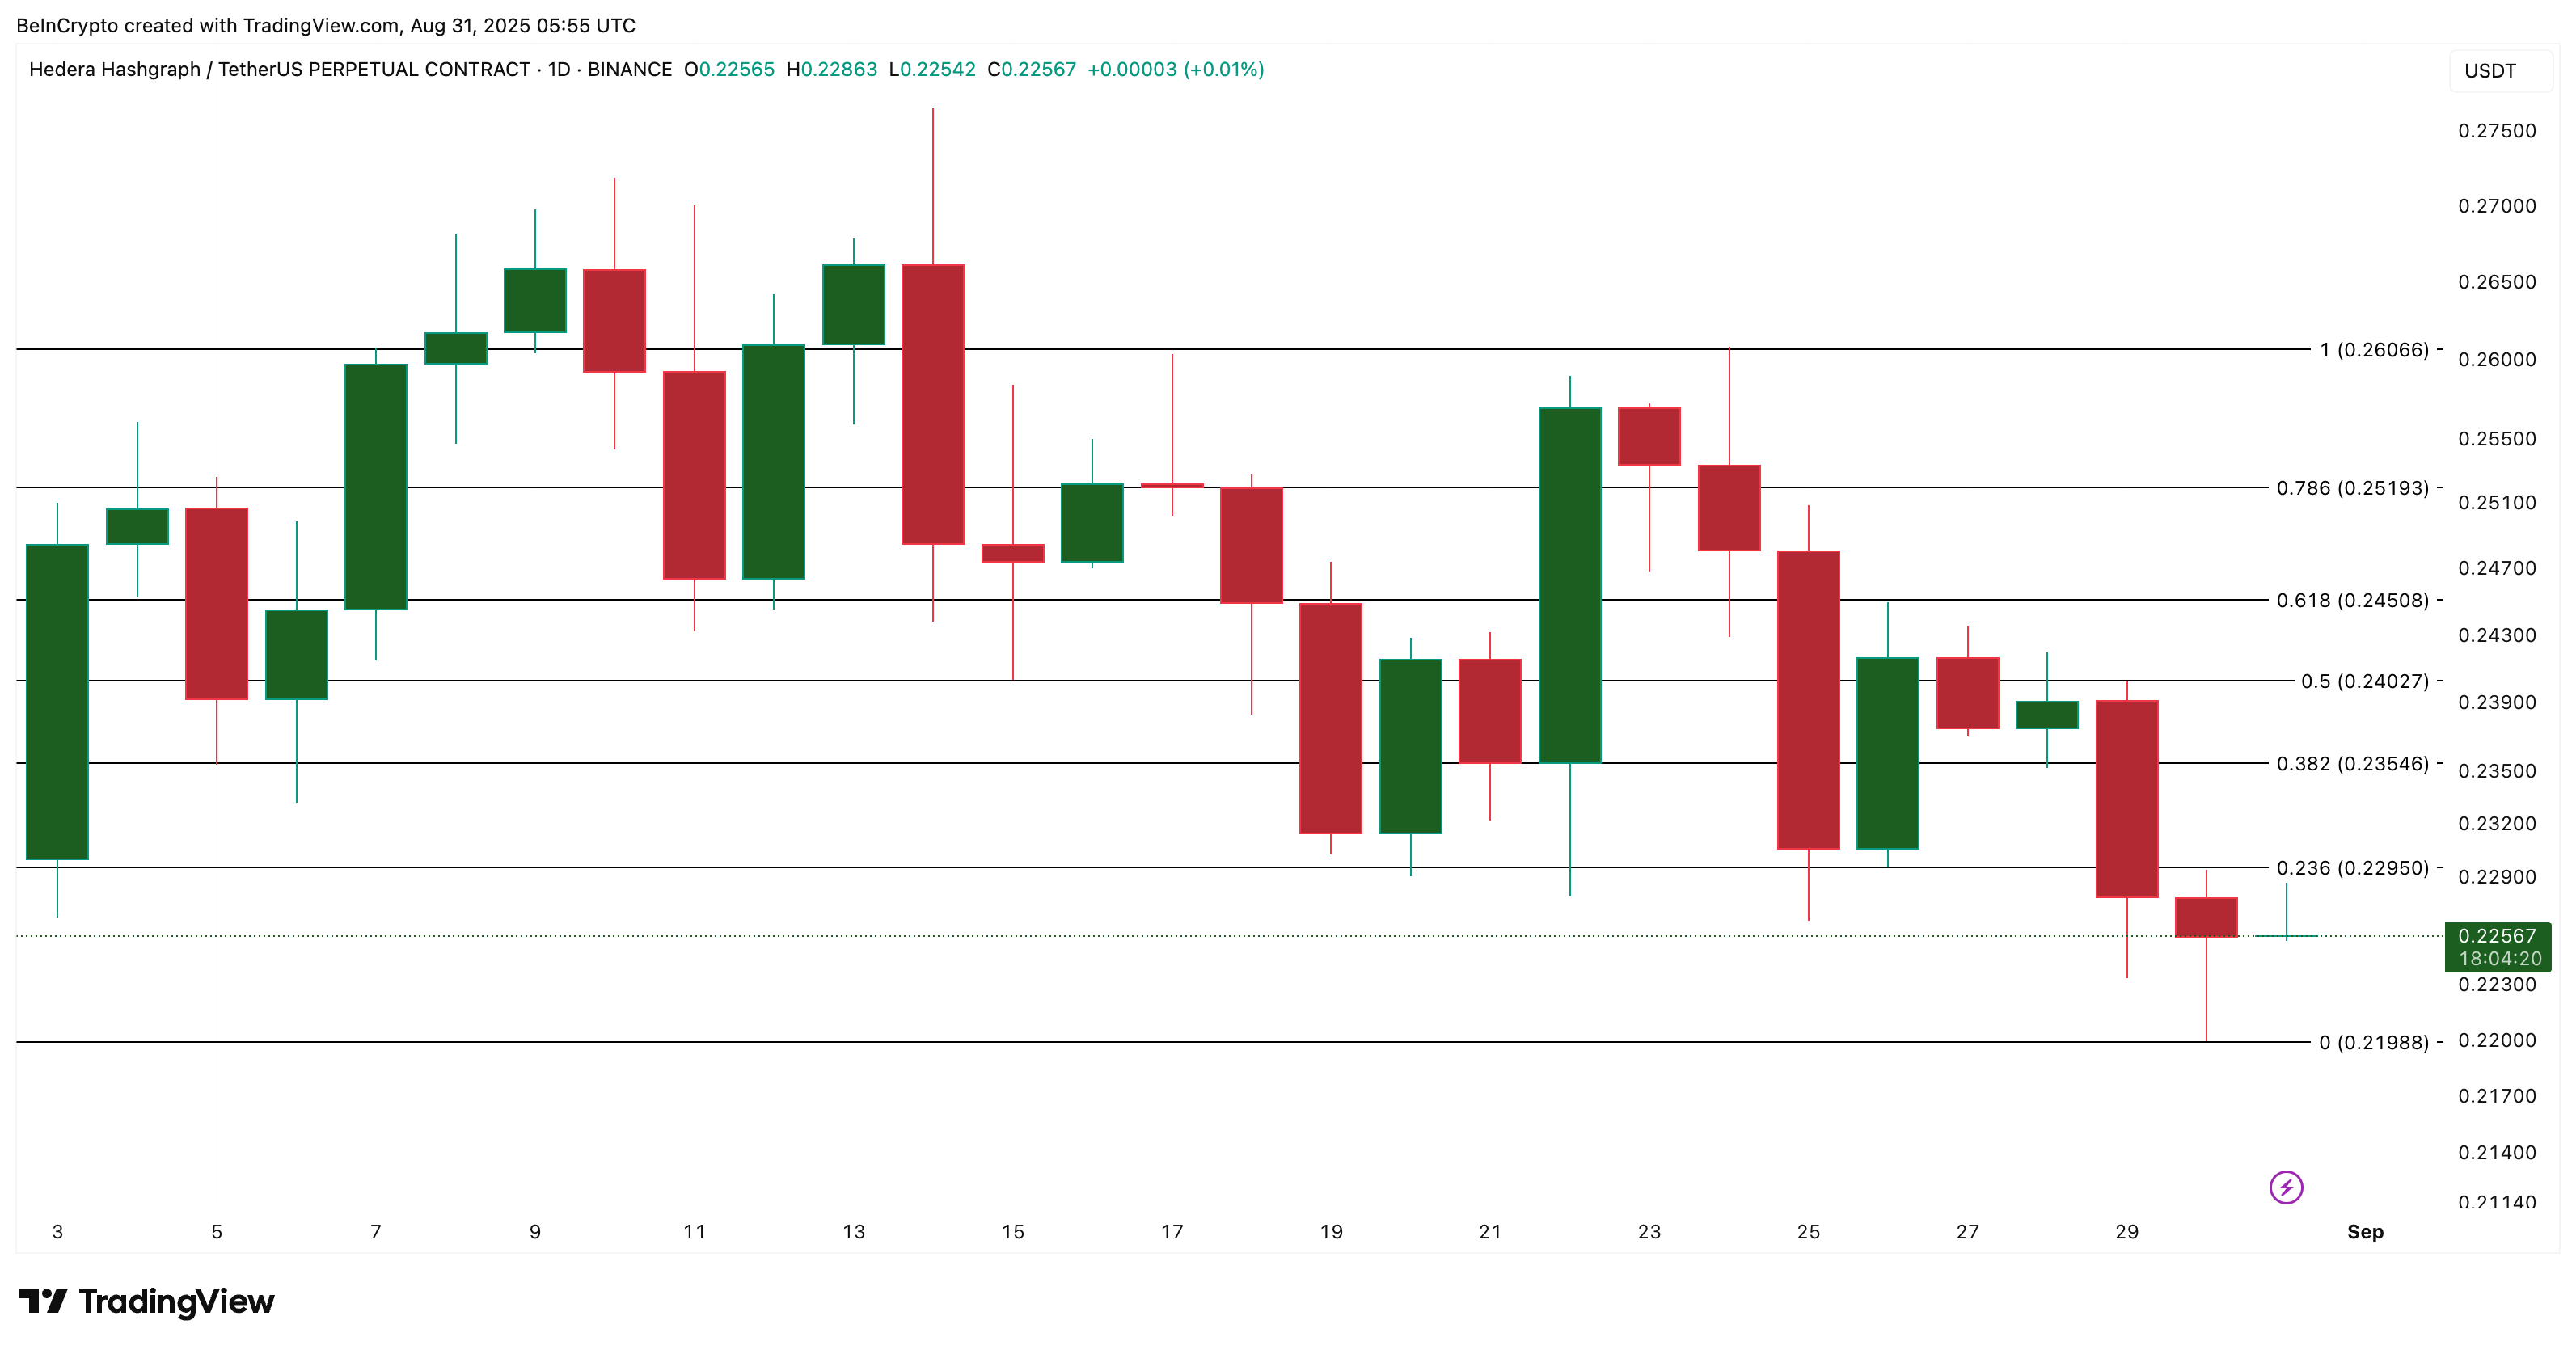
On the upside, reclaiming $0.240 would help neutralize the bearish bias, while a sustained MOVE above $0.260 would mark a full trend reversal. Until those levels are broken, the broader structure remains vulnerable.
