XRP Whales Trigger Bullish Rebound Signal — Is a $3 Price Reclaim Imminent?

XRP just flashed its most compelling bullish signal in months—and whales are leading the charge.
Major holders are accumulating aggressively, sparking what could be the start of a significant rebound. Market momentum is shifting, technical indicators are turning green, and suddenly, that $3 price target doesn’t seem so far away.
Of course, in crypto, “imminent” could mean tomorrow—or sometime after the next halving, regulatory circus, or Elon Musk tweet.
Timing the market remains a fool’s game, but the signals? They’re getting harder to ignore.
Exchange Inflow Value Bands Show Whale Patience
The first signal comes from exchange inflow value bands, which measure how much XRP of different transaction sizes is flowing into exchange wallets.
Large inflow bands usually mean that whales are preparing to sell, while a decline suggests they are holding back.
Since August 26, Binance’s large value band inflows have slowed sharply. Transactions worth between 100,000 and 1 million XRP dropped almost 95% from about 45.6 million XRP to just 2.1 million XRP by August 30. Inflows of more than 1 million XRP dropped by almost 93% in the same period.
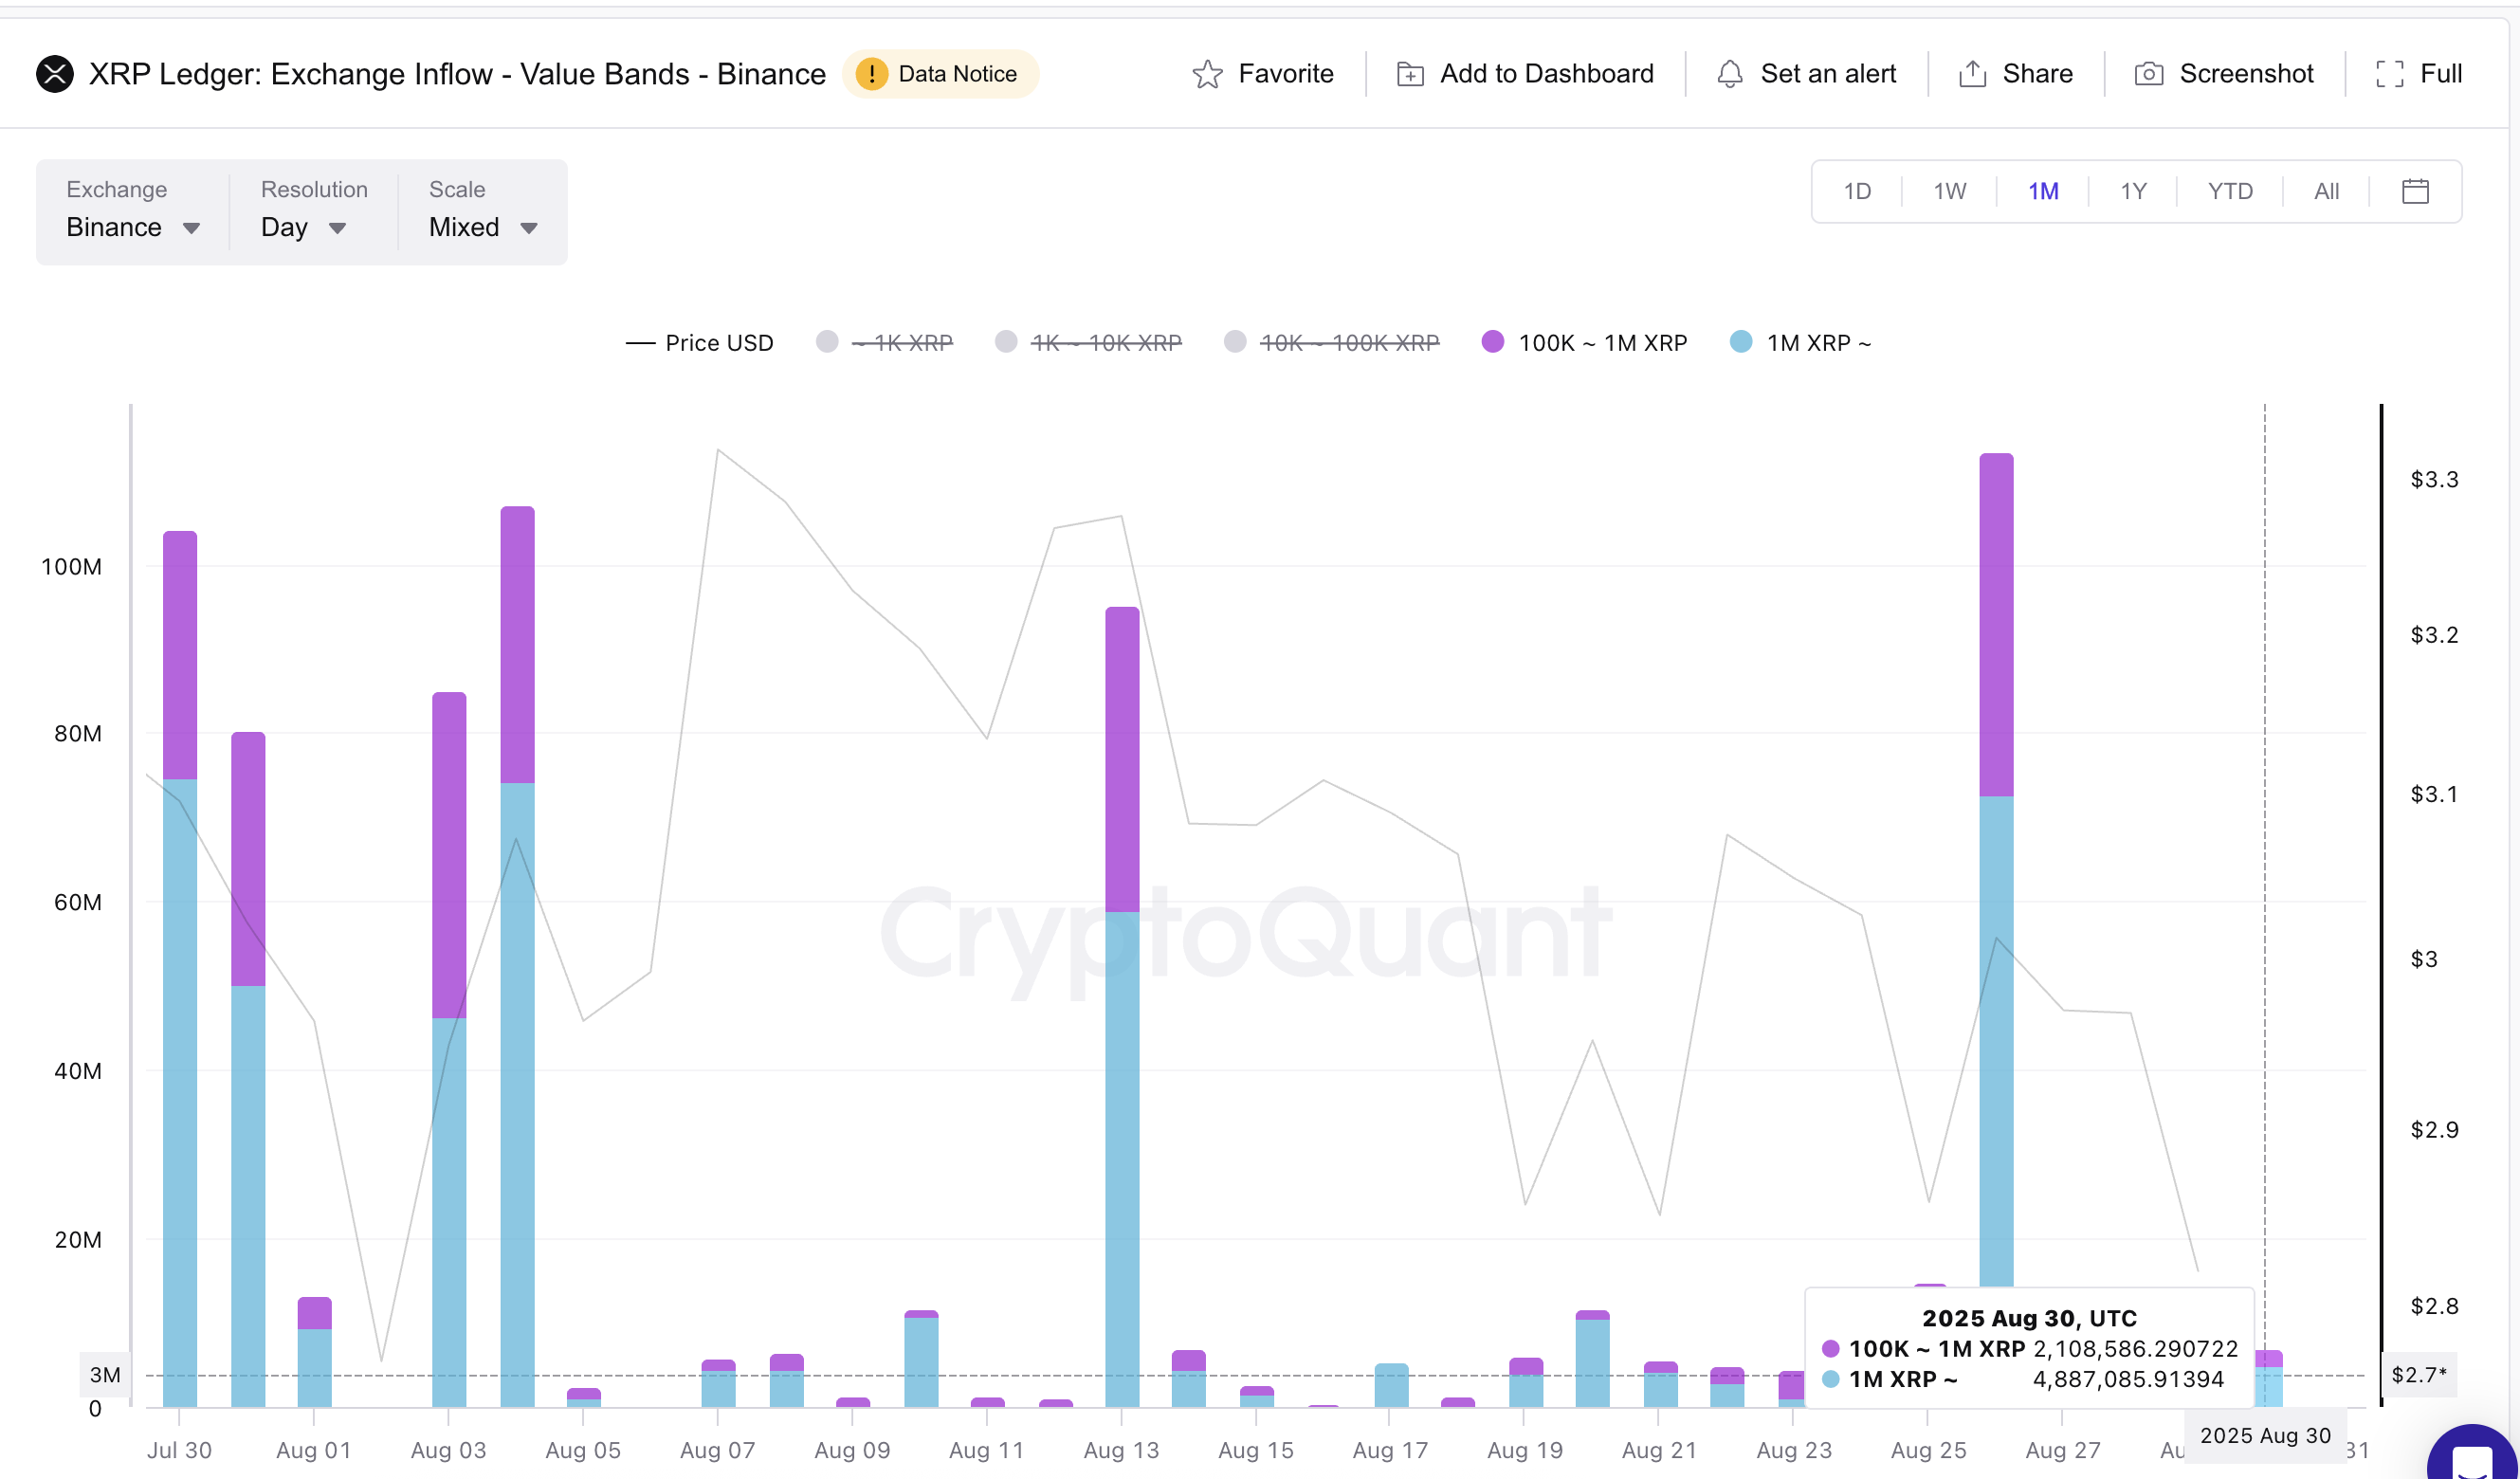
This steep drop indicates that whales are no longer moving large amounts of XRP into exchanges, reducing selling pressure.
With whales showing patience, the underlying support for the XRP price grows stronger. It suggests that while retail traders may be quick to sell during corrections, large holders are sitting on the sidelines, often a sign that a rebound could follow.
Taker Buy-Sell Ratio Hints At Market Bottom
Alongside whale behavior, the Taker buy-sell ratio provides another crucial signal. This ratio tracks whether market takers are more aggressive in buying or selling. A reading above one suggests strong buying activity, while below one suggests stronger selling.
At press time, the ratio stands at 0.90, showing more selling pressure. At first glance, this looks bearish, particularly because retail traders tend to dominate this metric as they sell quickly without negotiating on price. And with whales slowing down, the low ratio seems to be dominated by the retail sellers.
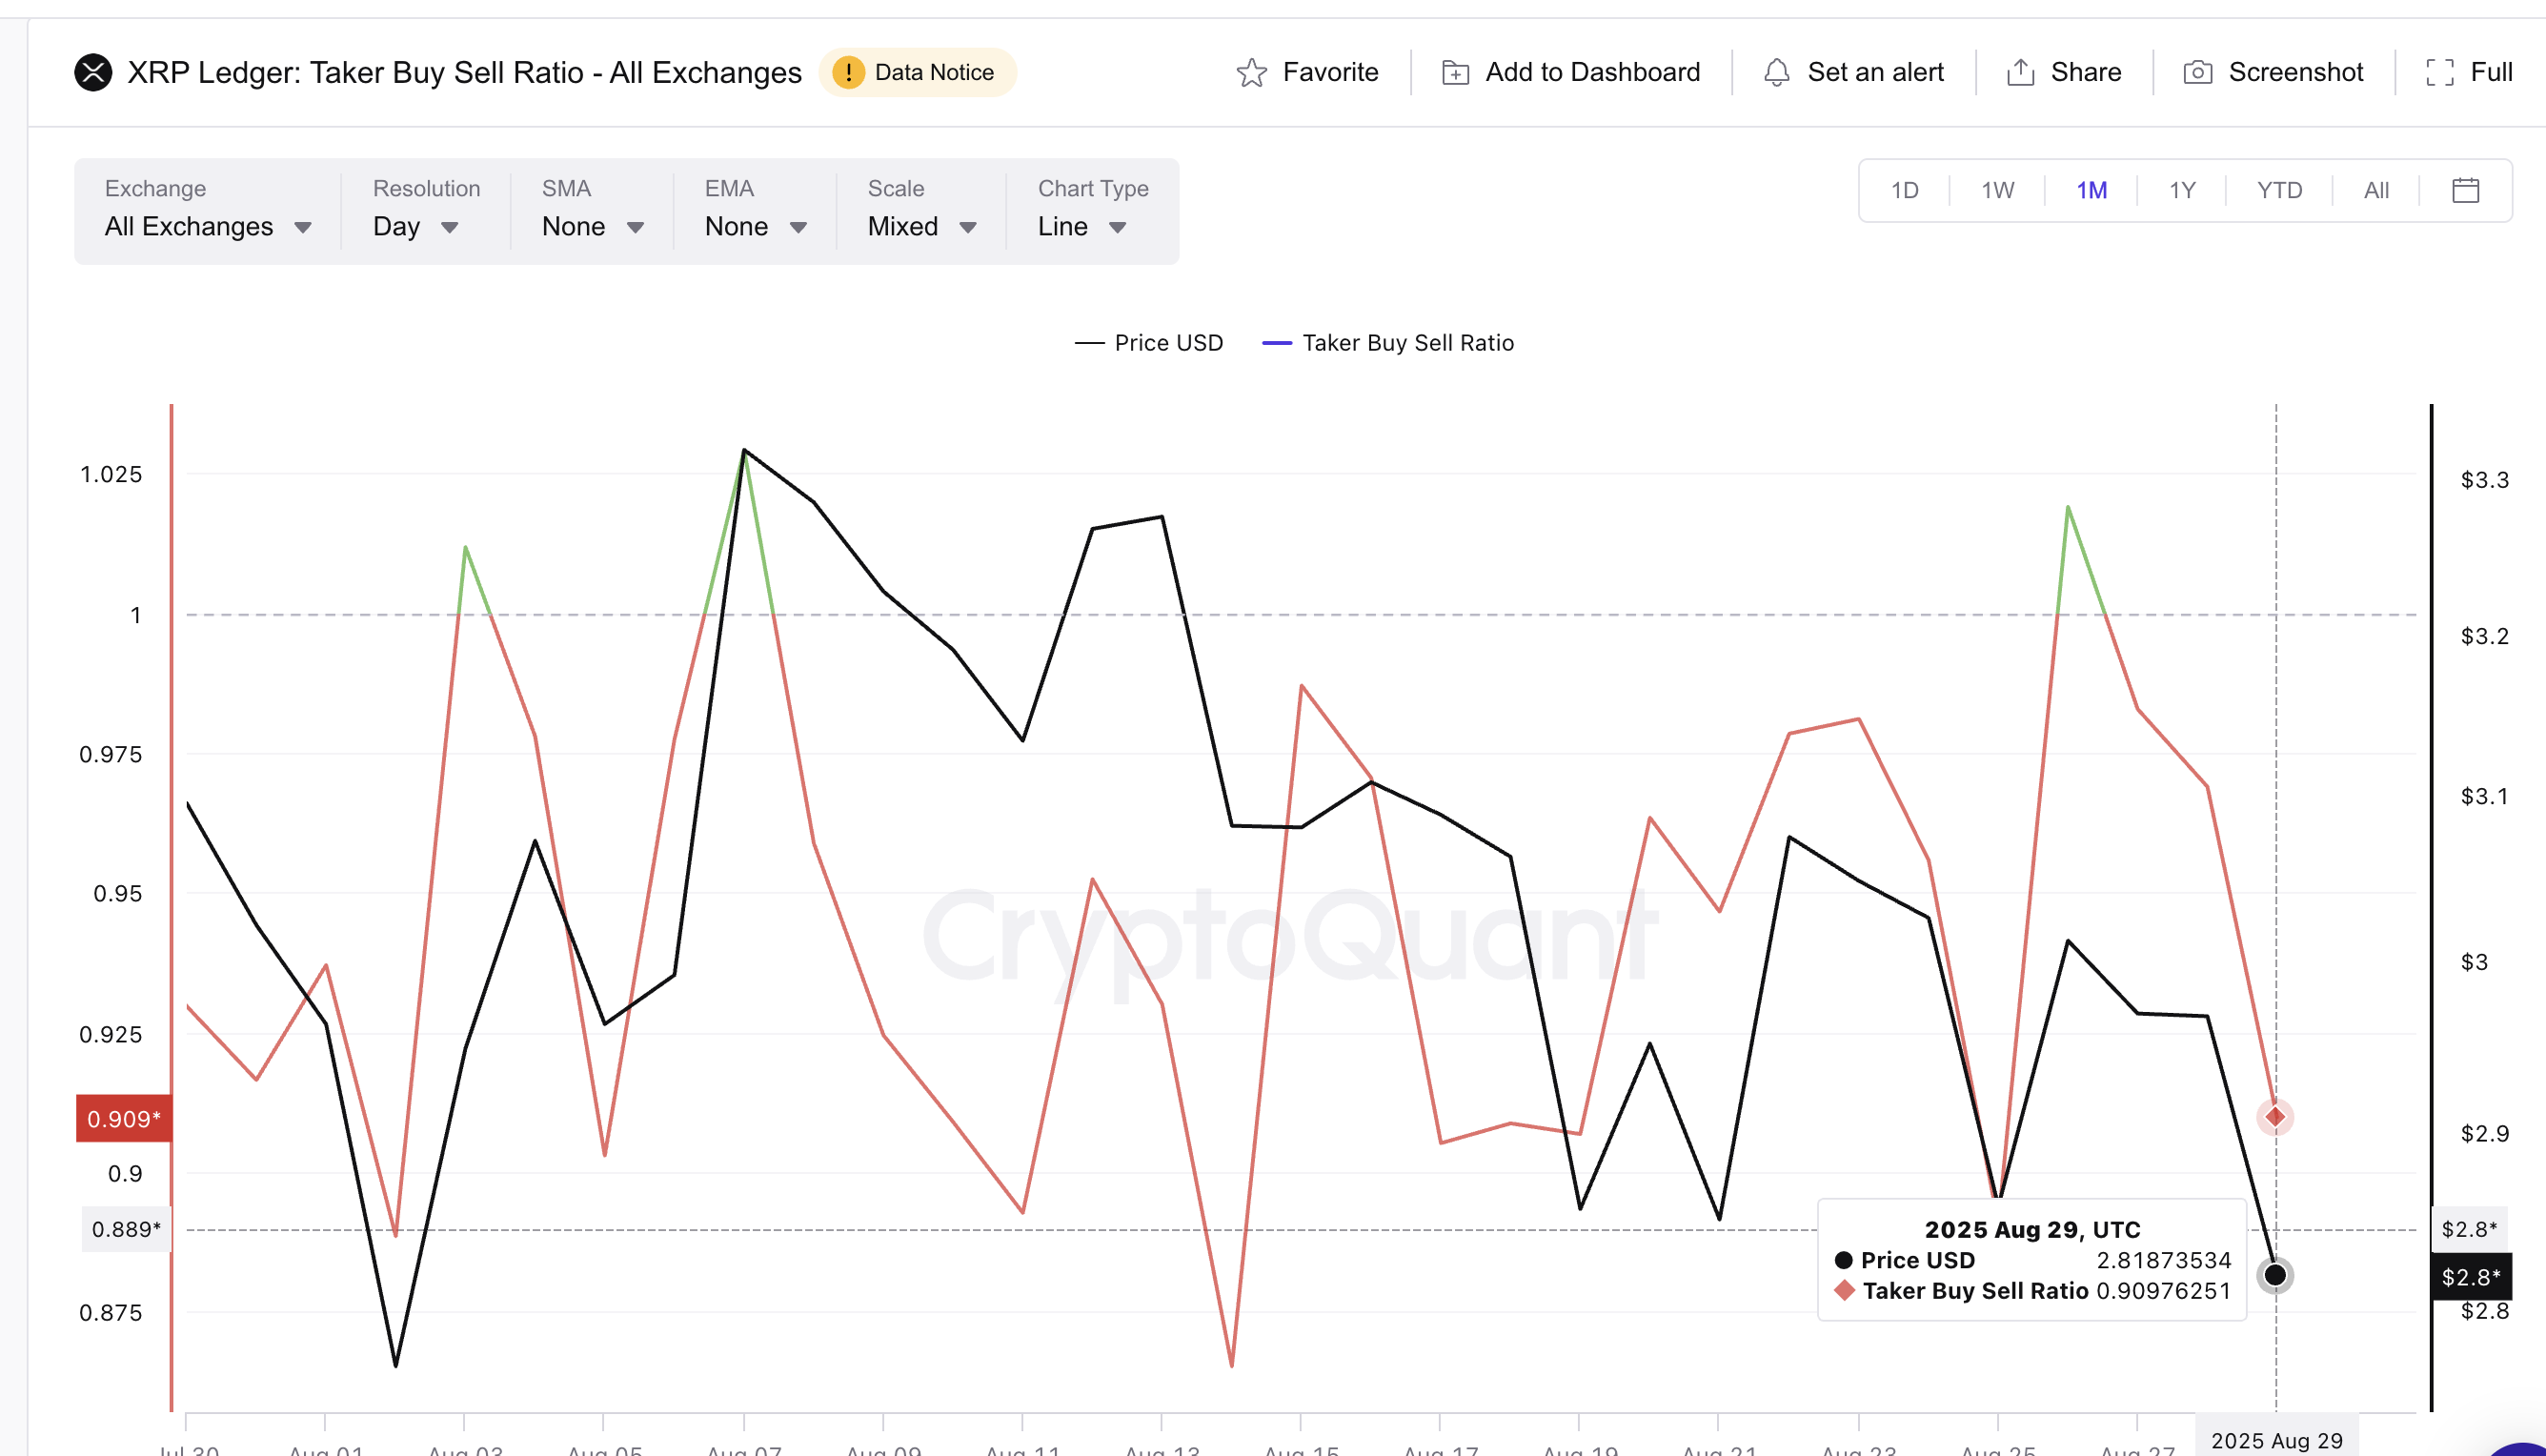
But looking back at August, almost every time the taker buy-sell ratio dipped below one, it coincided with a local market bottom.
On August 2, the ratio fell to 0.88, and the XRP price climbed almost 20% in the following weeks. On August 19, another drop marked a local bottom before a rally. The current reading is now NEAR those same levels.
This shows that what looks like bearish retail sentiment may actually be setting up another rebound.
When combined with whales slowing their exchange inflows, the taker buy-sell ratio aligns with the broader story: retail may be selling, but whales appear confident, and historically, this divergence has created the foundation for upward moves.
XRP Price Prediction And RSI Levels To Watch
The technical chart adds further weight. The relative strength index (RSI) has diverged from the price action, flashing a bullish signal.
While the XRP price made a lower low between August 19 and August 29, the RSI made a higher low in the same period. This bullish divergence suggests weakening downside momentum and strengthens the case for a rebound.
The Relative Strength Index (RSI) measures momentum by tracking the speed and size of recent price changes.
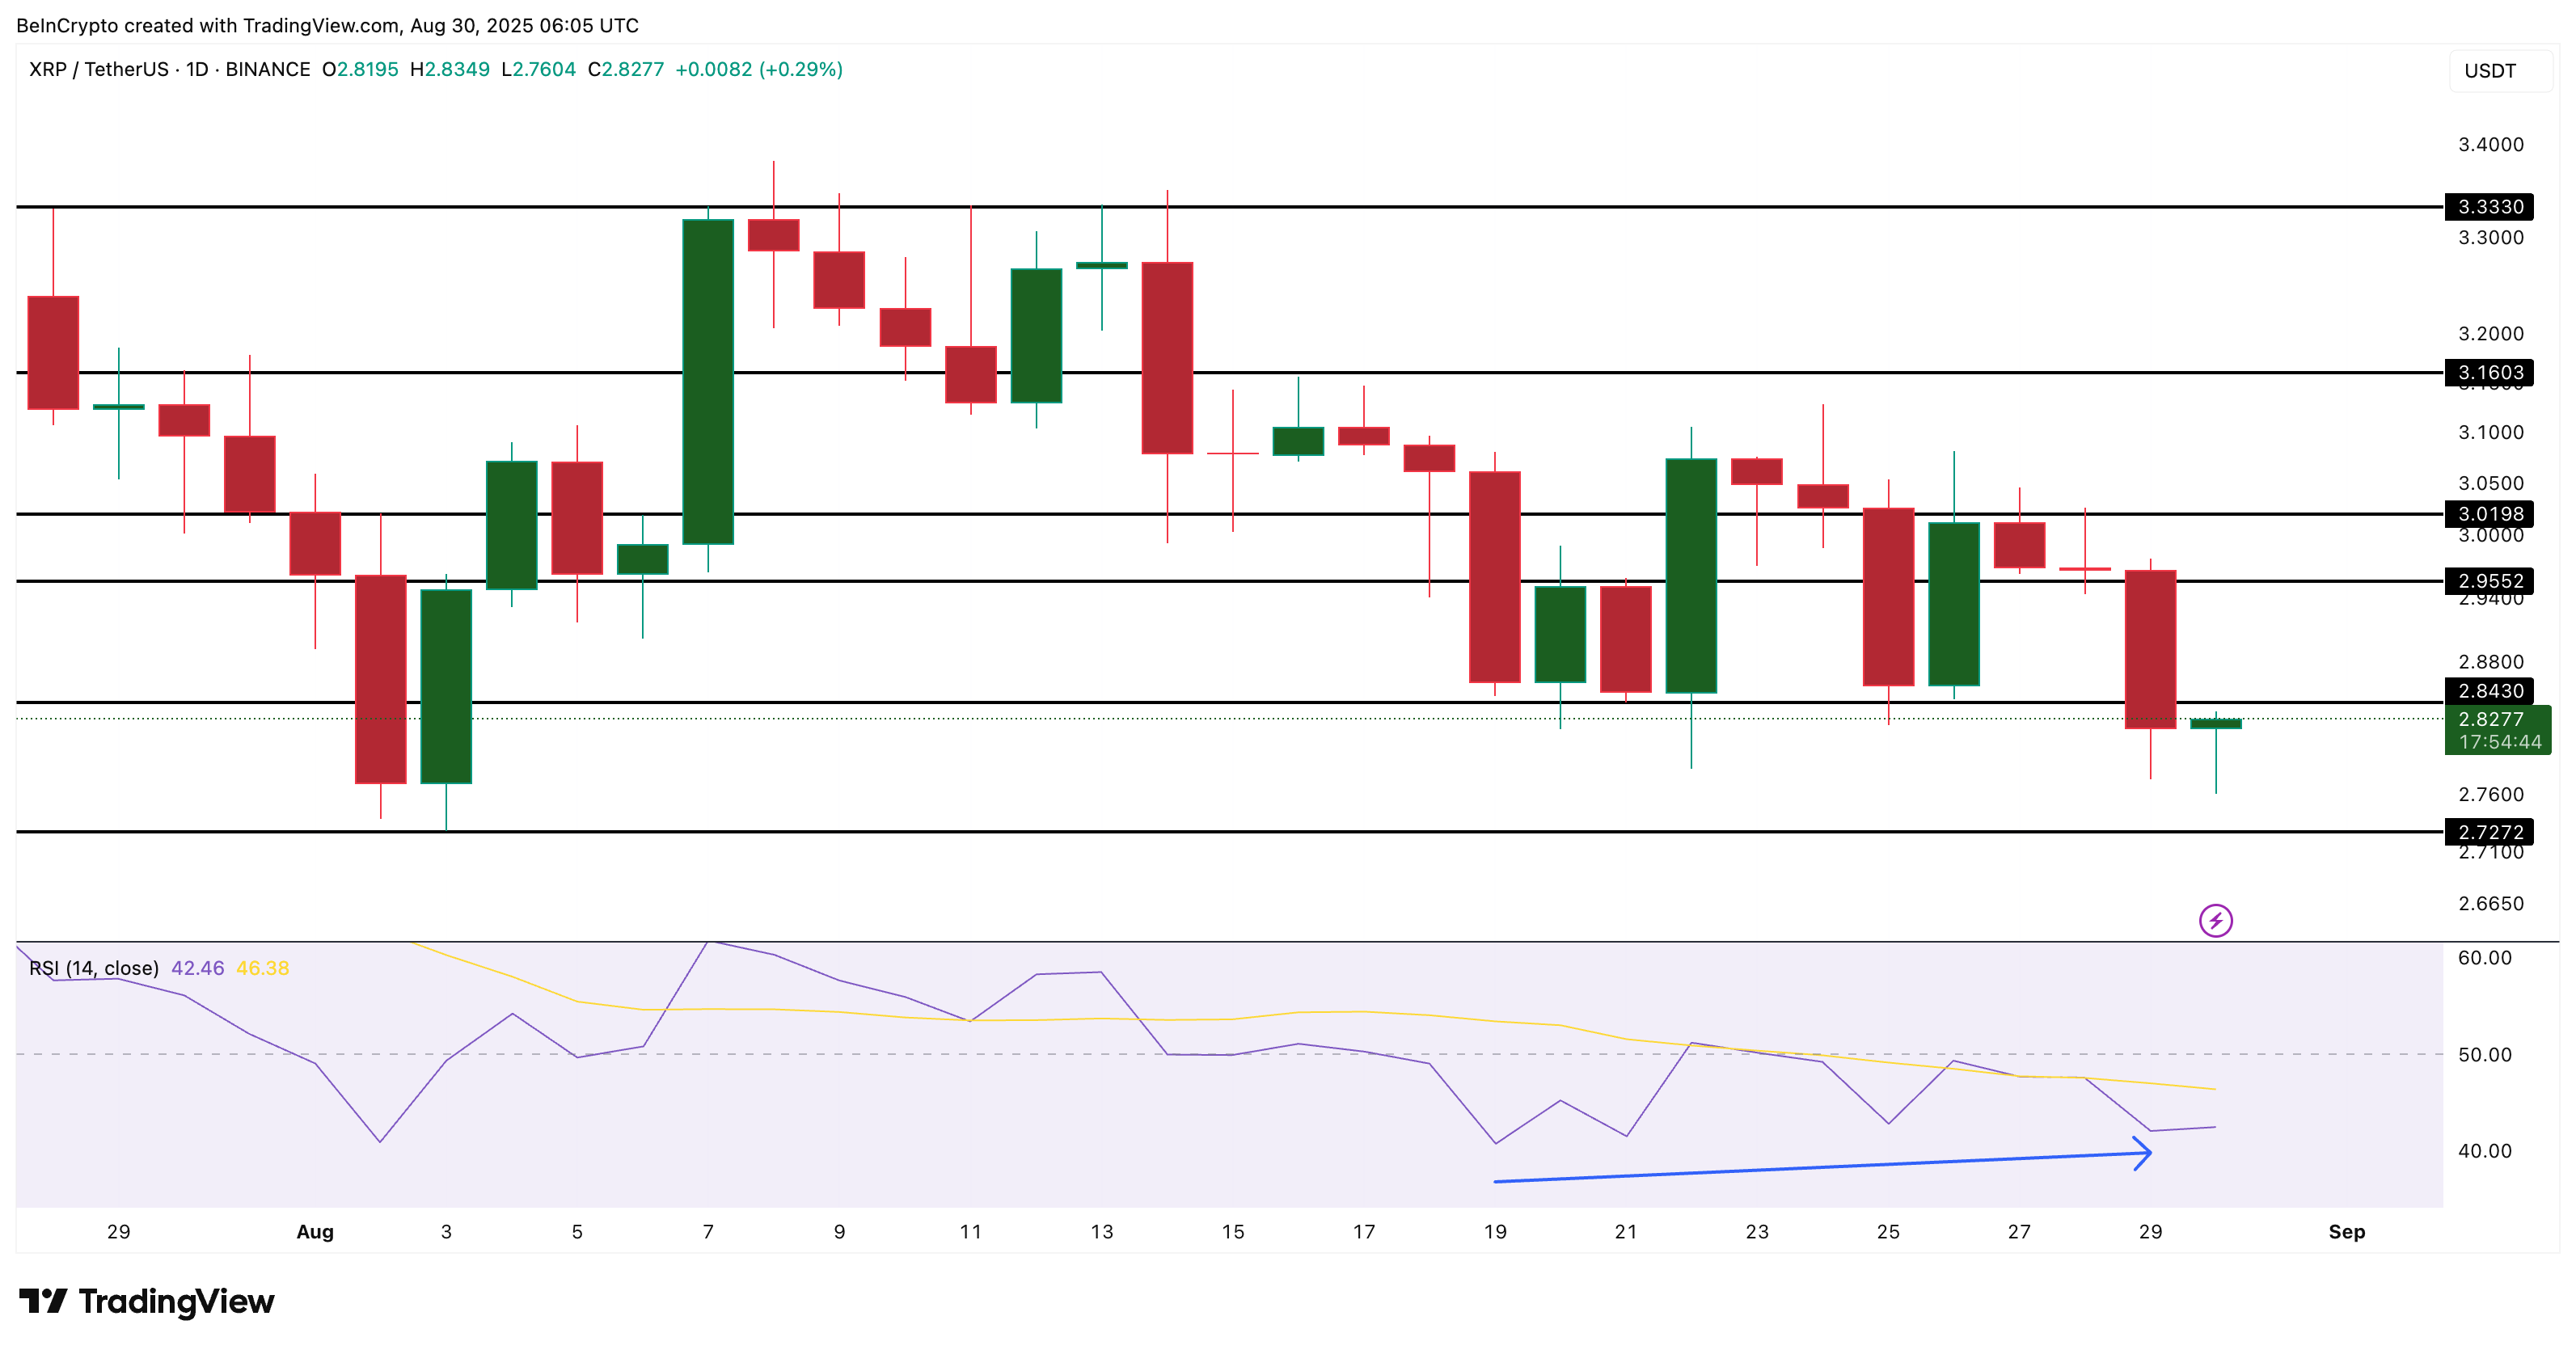
For the XRP price target, the first level to watch is $2.84. A daily candle close above this level could trigger a move toward $2.95 and then the psychological barrier of $3.00. A decisive break above $3.33 WOULD flip the entire trend bullish and confirm a broader XRP price prediction of further upside.
However, the bullish case is invalidated if XRP closes below $2.72 on the daily chart. Such a breakdown would signal that retail-driven selling pressure has overwhelmed whale support, shifting momentum back to the bears.
