Bitcoin Primed for Major Rebound as HODLers Flash Strongest Bullish Signal in Months

Bitcoin's showing its teeth again—HODLers just triggered their most aggressive accumulation pattern since July.
The Signal That Moves Markets
When long-term holders start stacking sats at this pace, history suggests a rally isn't far behind. These aren't day traders chasing pumps—they're the bedrock of Bitcoin's value proposition.
Timing the Turnaround
The crypto market's been stuck in a sideways grind, but this surge in holder confidence could be the catalyst that breaks the pattern. Traditional analysts might dismiss it as 'irrational exuberance'—but then again, they said the same thing at $1,000.
Wall Street's still trying to price what crypto natives understand instinctively: sometimes the best fundamental is simply refusing to sell.
Supply in Profit Nears Local Lows Again
One of the important on-chain measures for bitcoin is the percentage of supply in profit.
On August 25, this percentage dropped to 88.53%, close to the three-month low of 87.02% that was recorded on June 22. The June dip in supply in profit set off a rally, with BTC rising 22% in the weeks that followed.
A similar pattern also played out on August 2, when the metric fell to 91.64% from a high of 98.91%. After that drop, the Bitcoin price climbed again by almost 10% in a matter of 10 days.
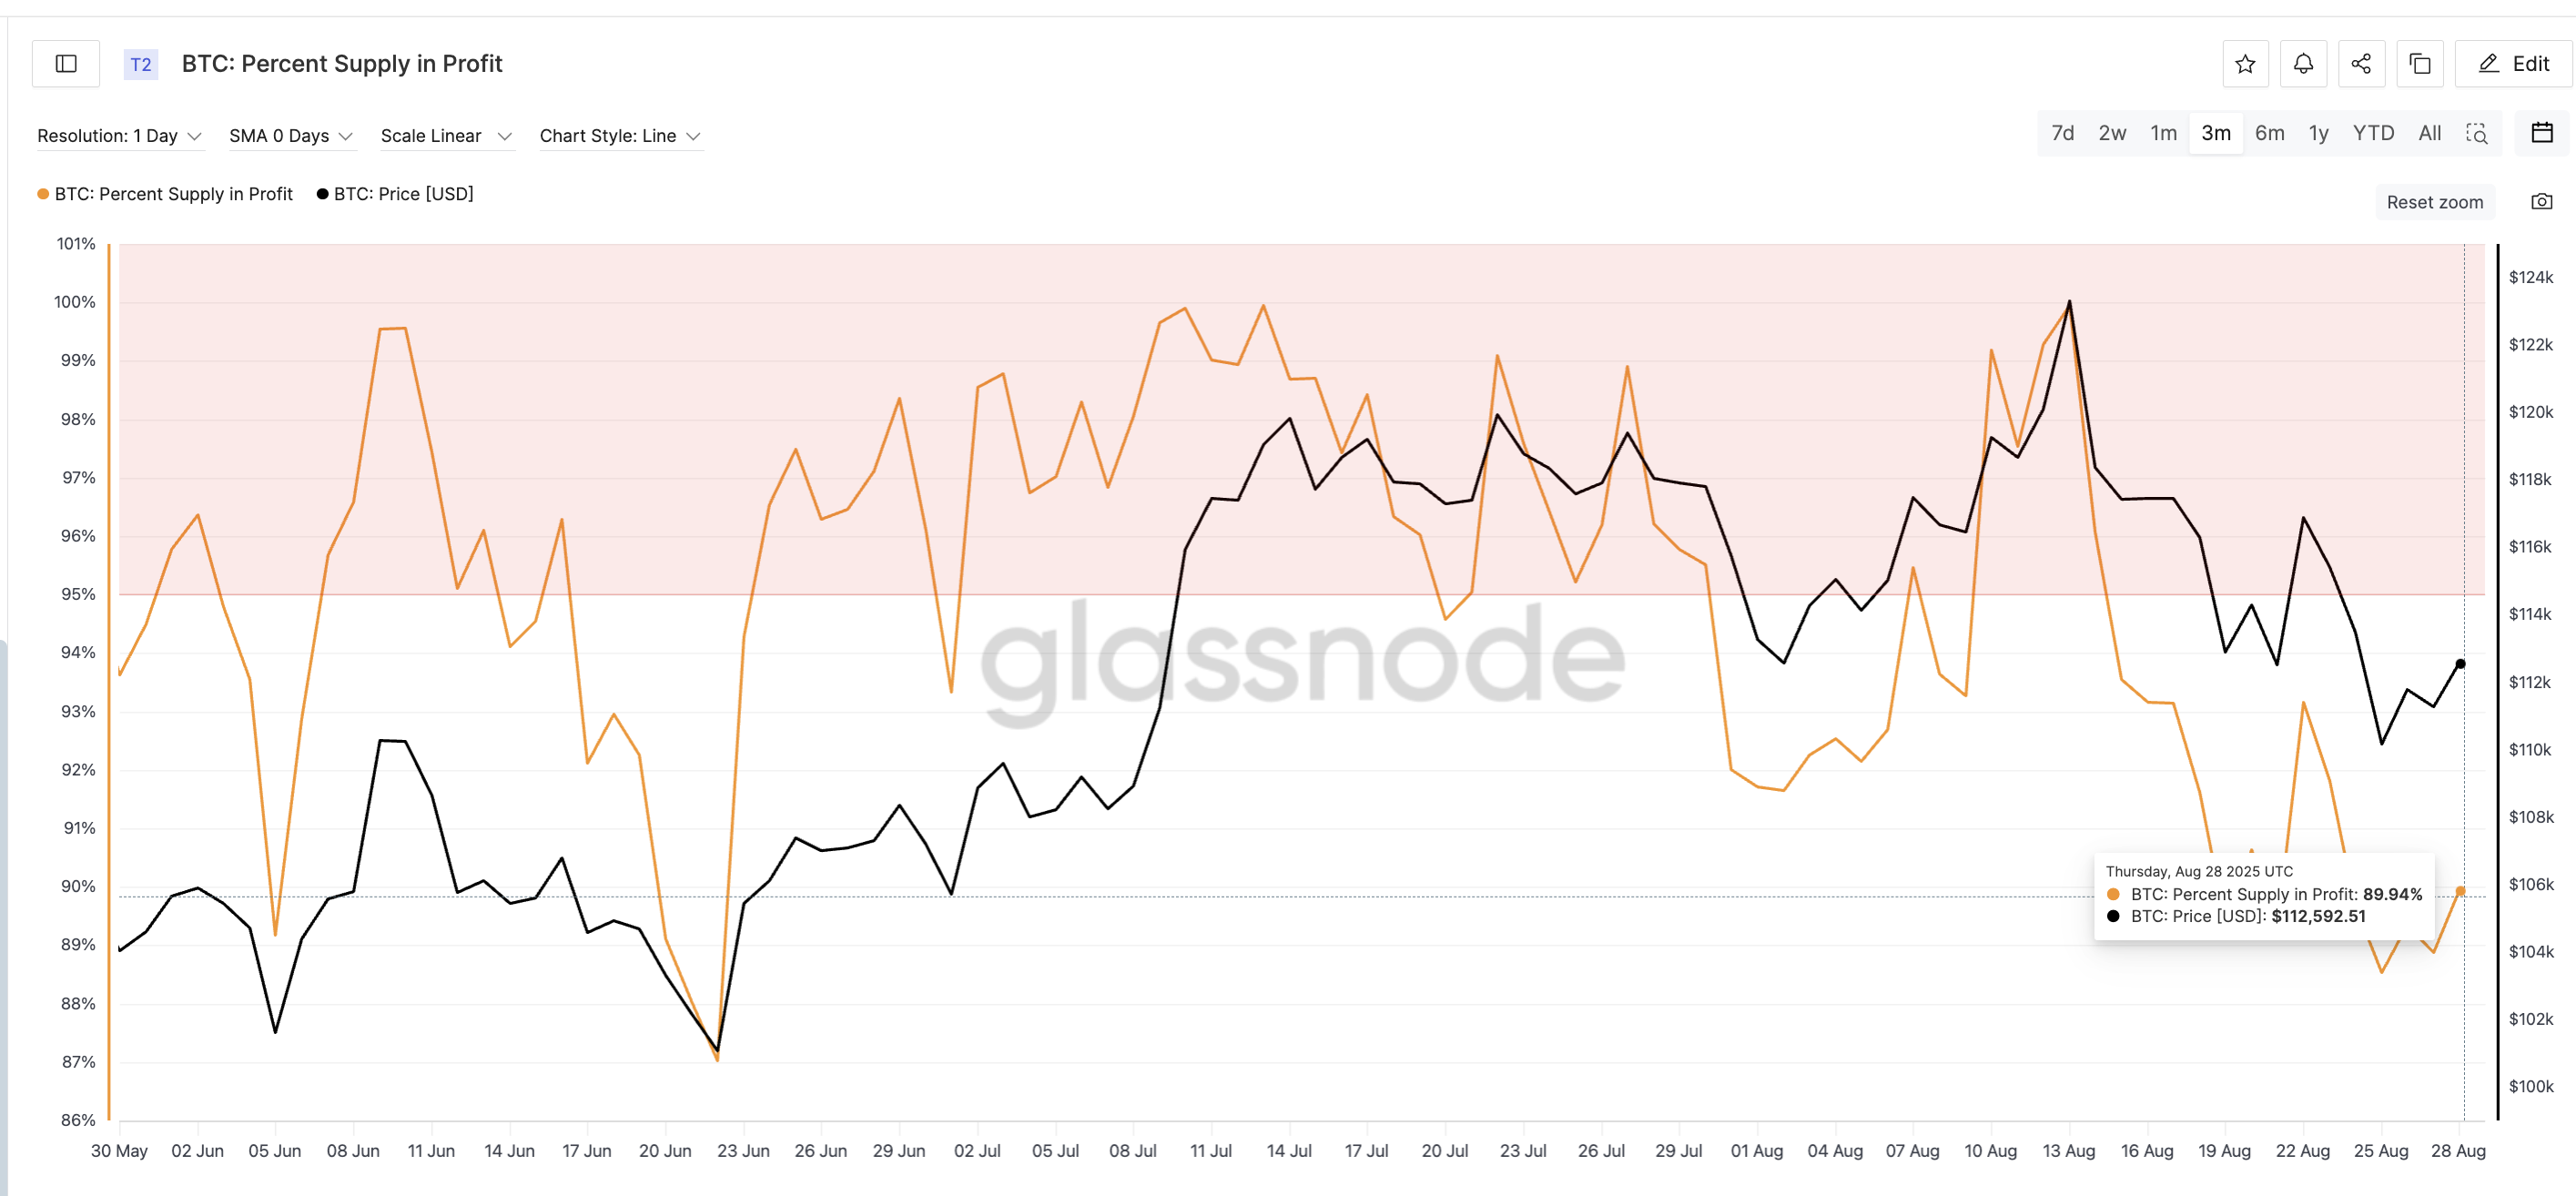
These examples show that when fewer holders are in profit, there is less incentive to sell. While the metric can sometimes also signal weakness or even panic selling, in this case, it is sitting close to levels that previously triggered strong upside moves.
This is why the supply in profit metric is important to track — but it should not be read in isolation.
: Want more token insights like this? Sign up for Editor Harsh Notariya’s Daily crypto Newsletter here.
Long-Term Investors Turn Net Buyers
This time, the stronger signal is coming from long-term investors, often referred to as “HODLers.” Their net position change shows whether they are adding or reducing their Bitcoin holdings each month.
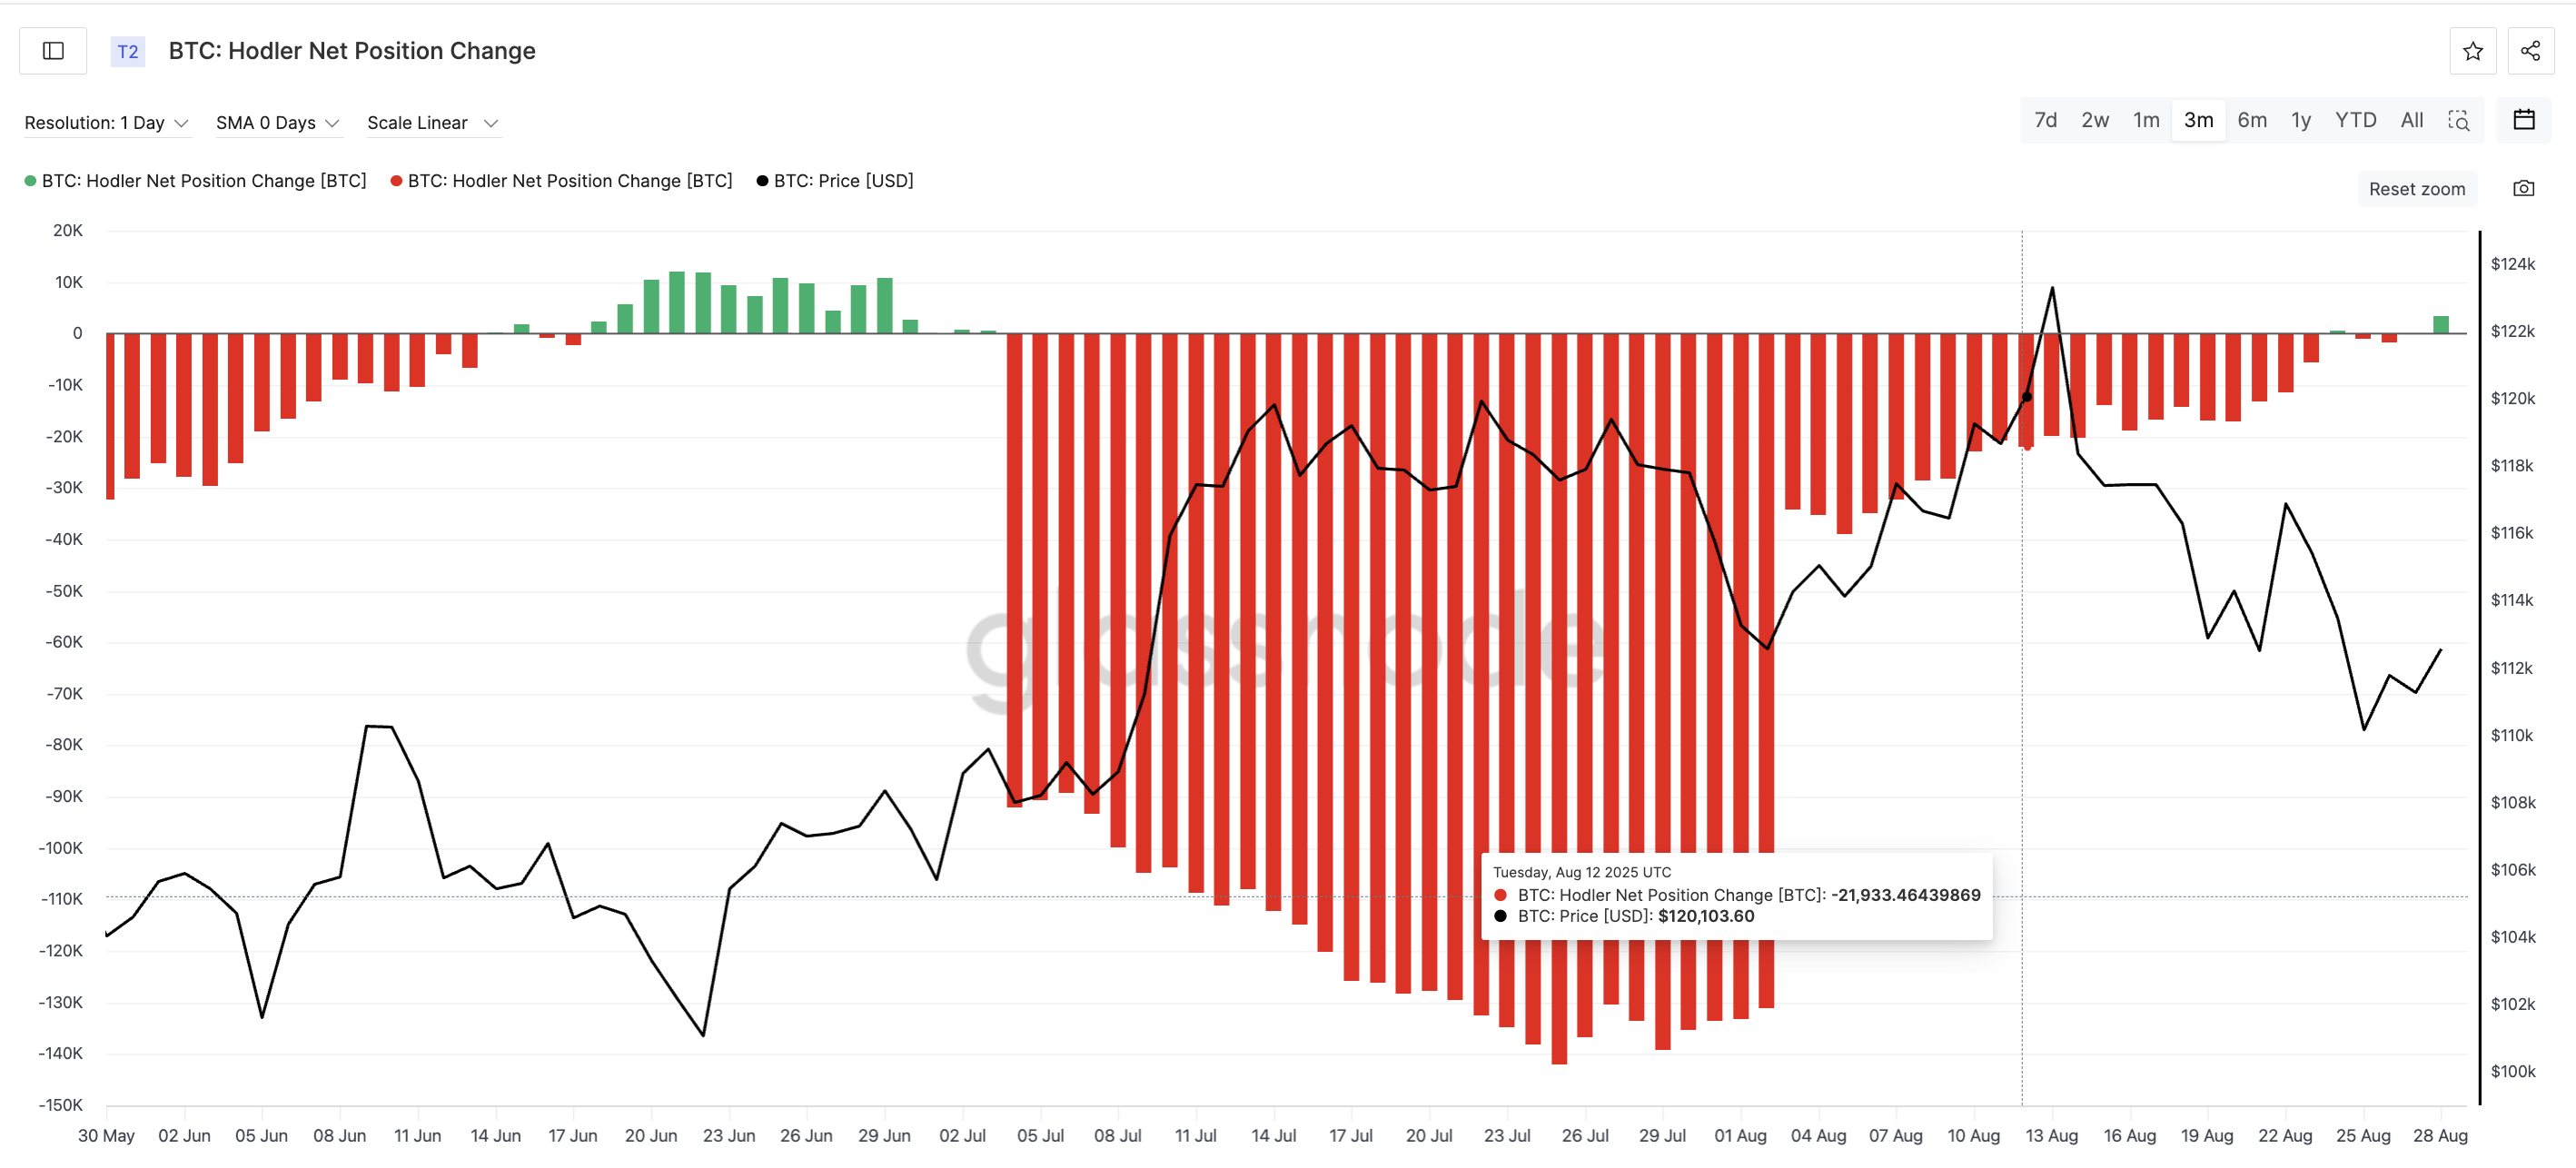
Since late July, this group has been on the sidelines or even selling, keeping the indicator mostly negative. The only brief green sign was on August 24, which coincided with a small price bounce from around $110,000 to $111,000, though it did not last as selling quickly resumed.
Now, however, the metric has turned clearly positive for the first time in a month, showing an increase of 3,429 BTC.
This is the strongest accumulation signal since late July. When this same group of long-term investors last shifted heavily to accumulation — around June 22 — it lined up with the same period when profit supply hit its lows, and Bitcoin rallied from $101,084 to $123,313, a 22% rise.
That history makes this change significant. If these investors continue to add rather than cash out quickly, it could provide the base for another rebound.
Bitcoin Price Levels and Rebound Zone to Watch
At press time, the bitcoin price trades just under $111,000. It has already broken a key support around $111,074, and the next immediate support lies at $110,50, with the deeper safety net down at $108,600.
If the final level gives way, the bearish case will strengthen and invalidate any BTC price rebound calls. This could happen if the HODLer-led bullish sign fades away.
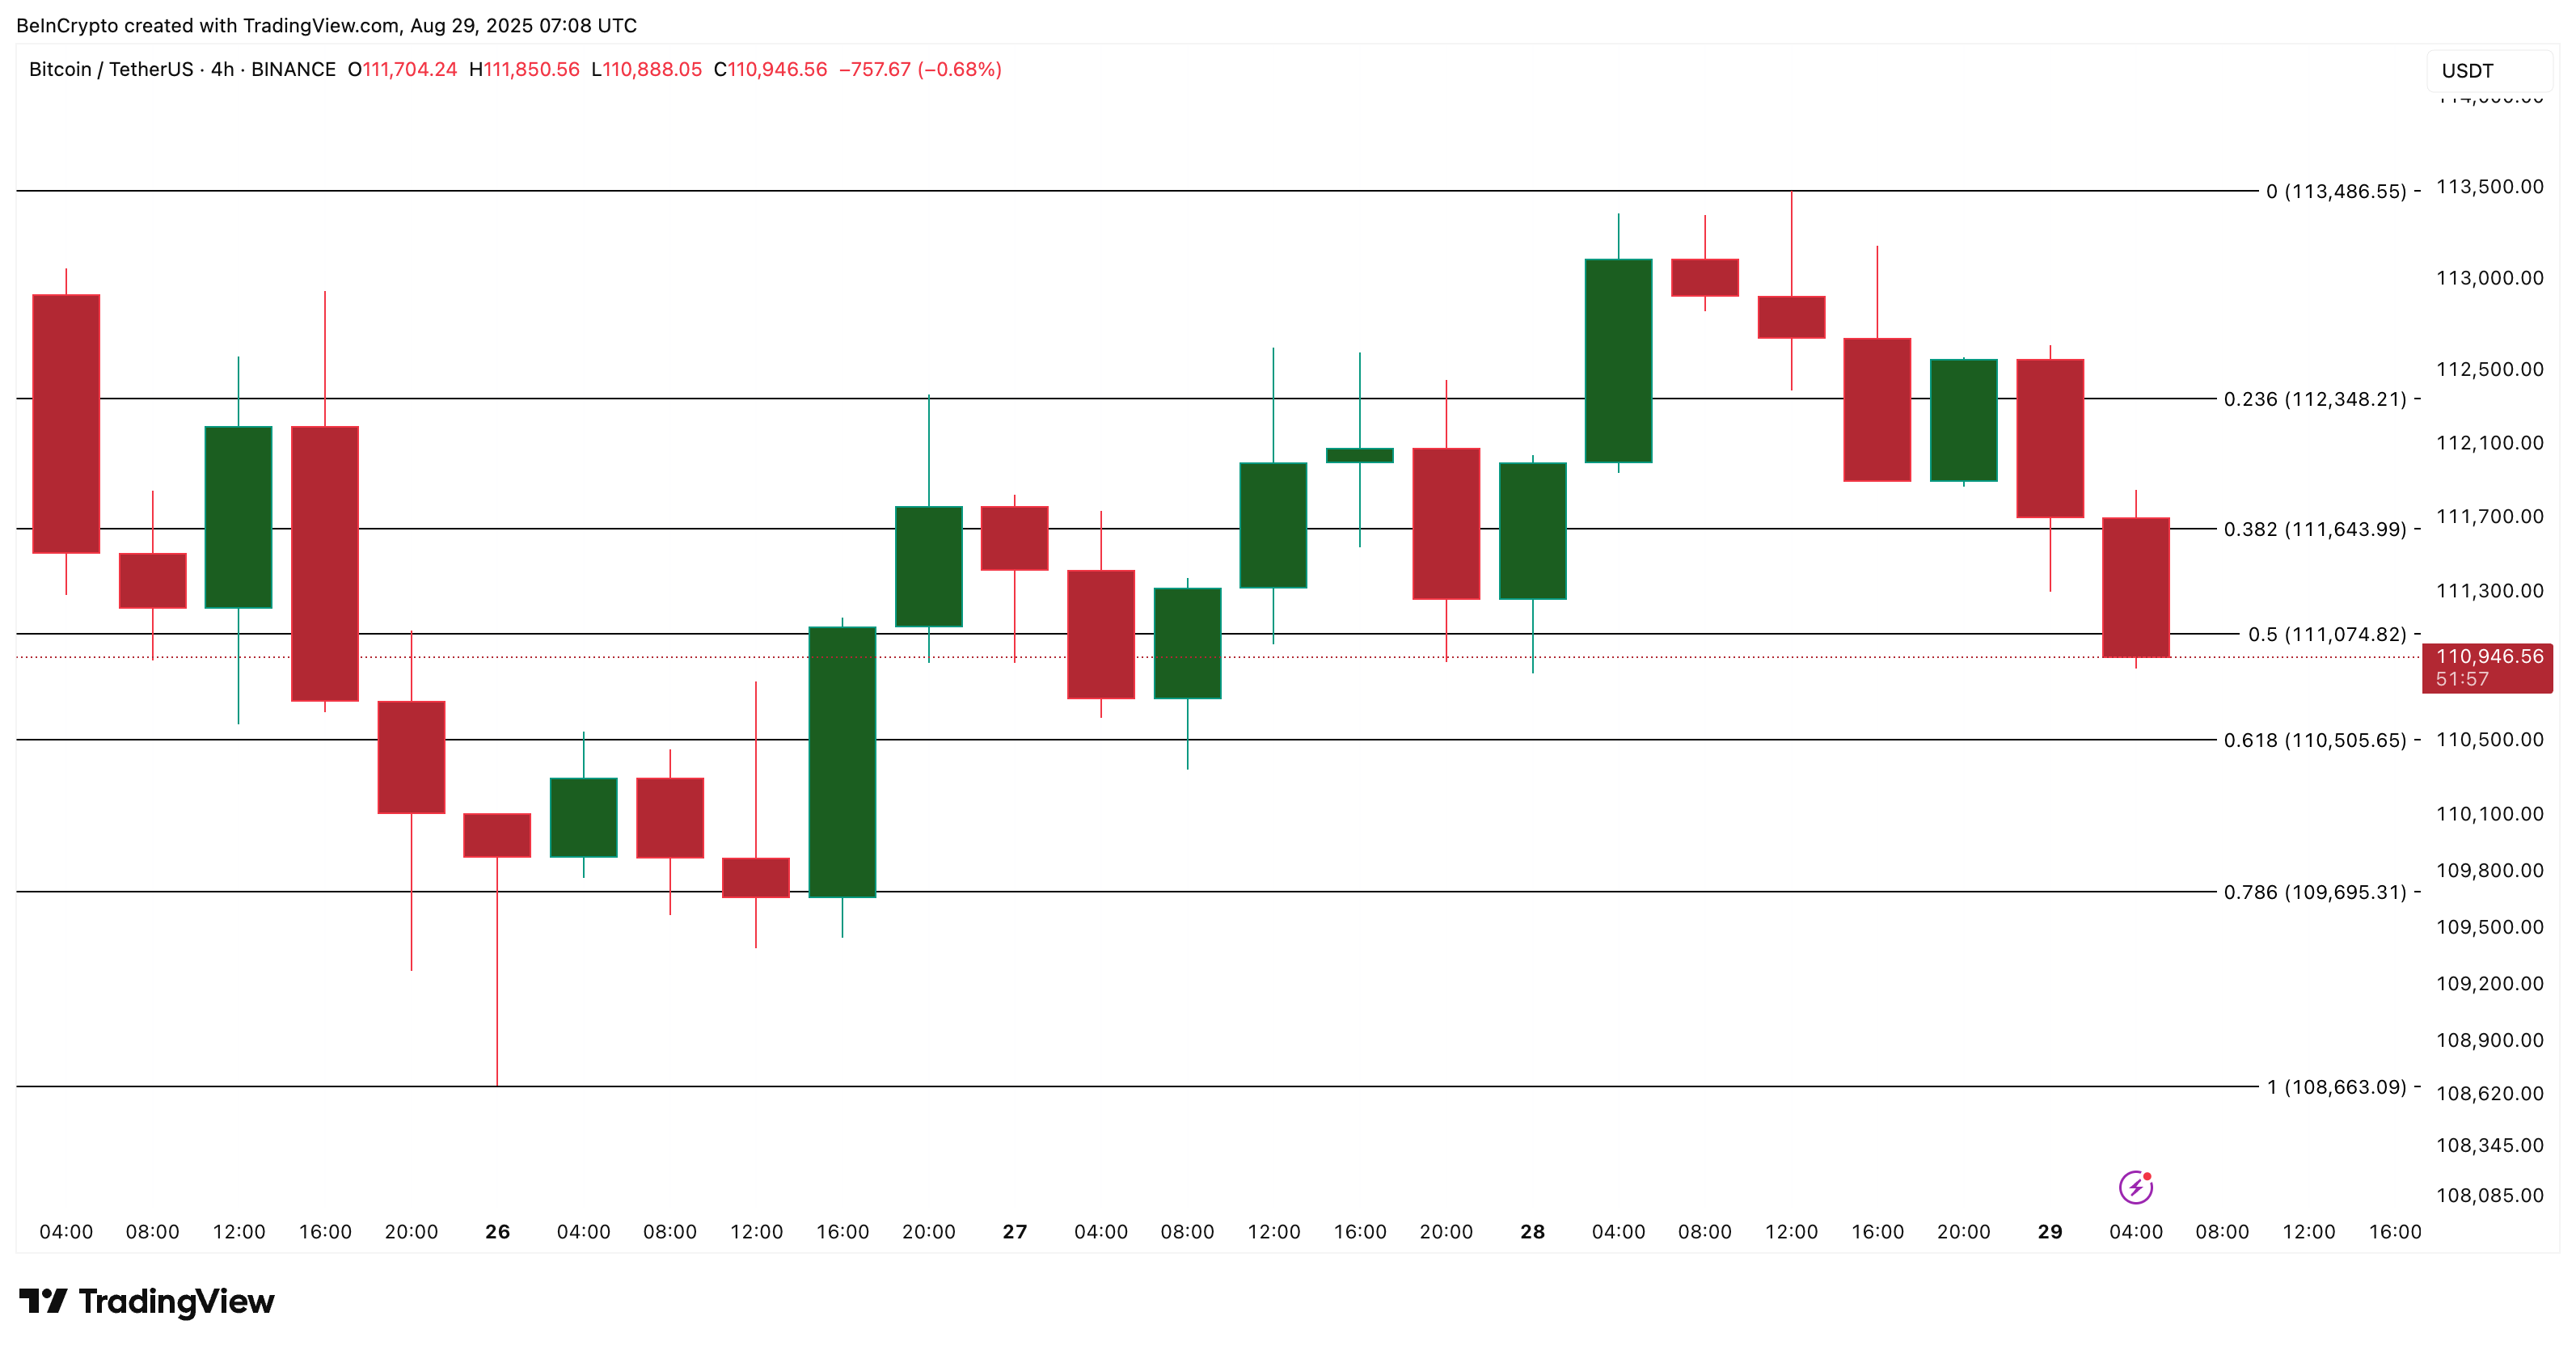
On the upside, however, the picture is different. The first rebound zone emerges around $113,400. Reclaiming and holding above that level WOULD not just be a short bounce — it would give Bitcoin price the signal strength to aim higher again.
