PYTH Targets Another 80% Surge as Buyers Snap Up $22M Amid Volatility Warnings

PYTH bulls are charging again—ignoring volatility risks as massive buying pressure fuels another potential breakout.
Massive Accumulation Underway
Traders just scooped up $22 million worth of PYTH tokens in a single push. That kind of volume doesn’t happen quietly—it screams conviction.
Rally Mode: Activated
An 80% upswing is now in play, repeating recent bullish patterns. Past performance never guarantees future results—but in crypto, everyone acts like it does.
Handle the Hype—And The Risk
High volatility means high stakes. Not for the faint-hearted. Then again, when has crypto ever been?
Another classic crypto setup: huge gains on the line, fueled by big money moves and a community that’s all-in. Just another day in the digital casino.
Buyers Step In As One Cohort Trims
On-chain activity shows a split. Regular whales reduced their holdings by about 2.86% in the last 24 hours, but other buyer cohorts filled the gap.
Exchange reserves fell by 77.2 million PYTH, equal to $17.2 million at $0.223, as tokens left centralized exchanges. This signals accumulation outside exchanges and a reduction in sell pressure.
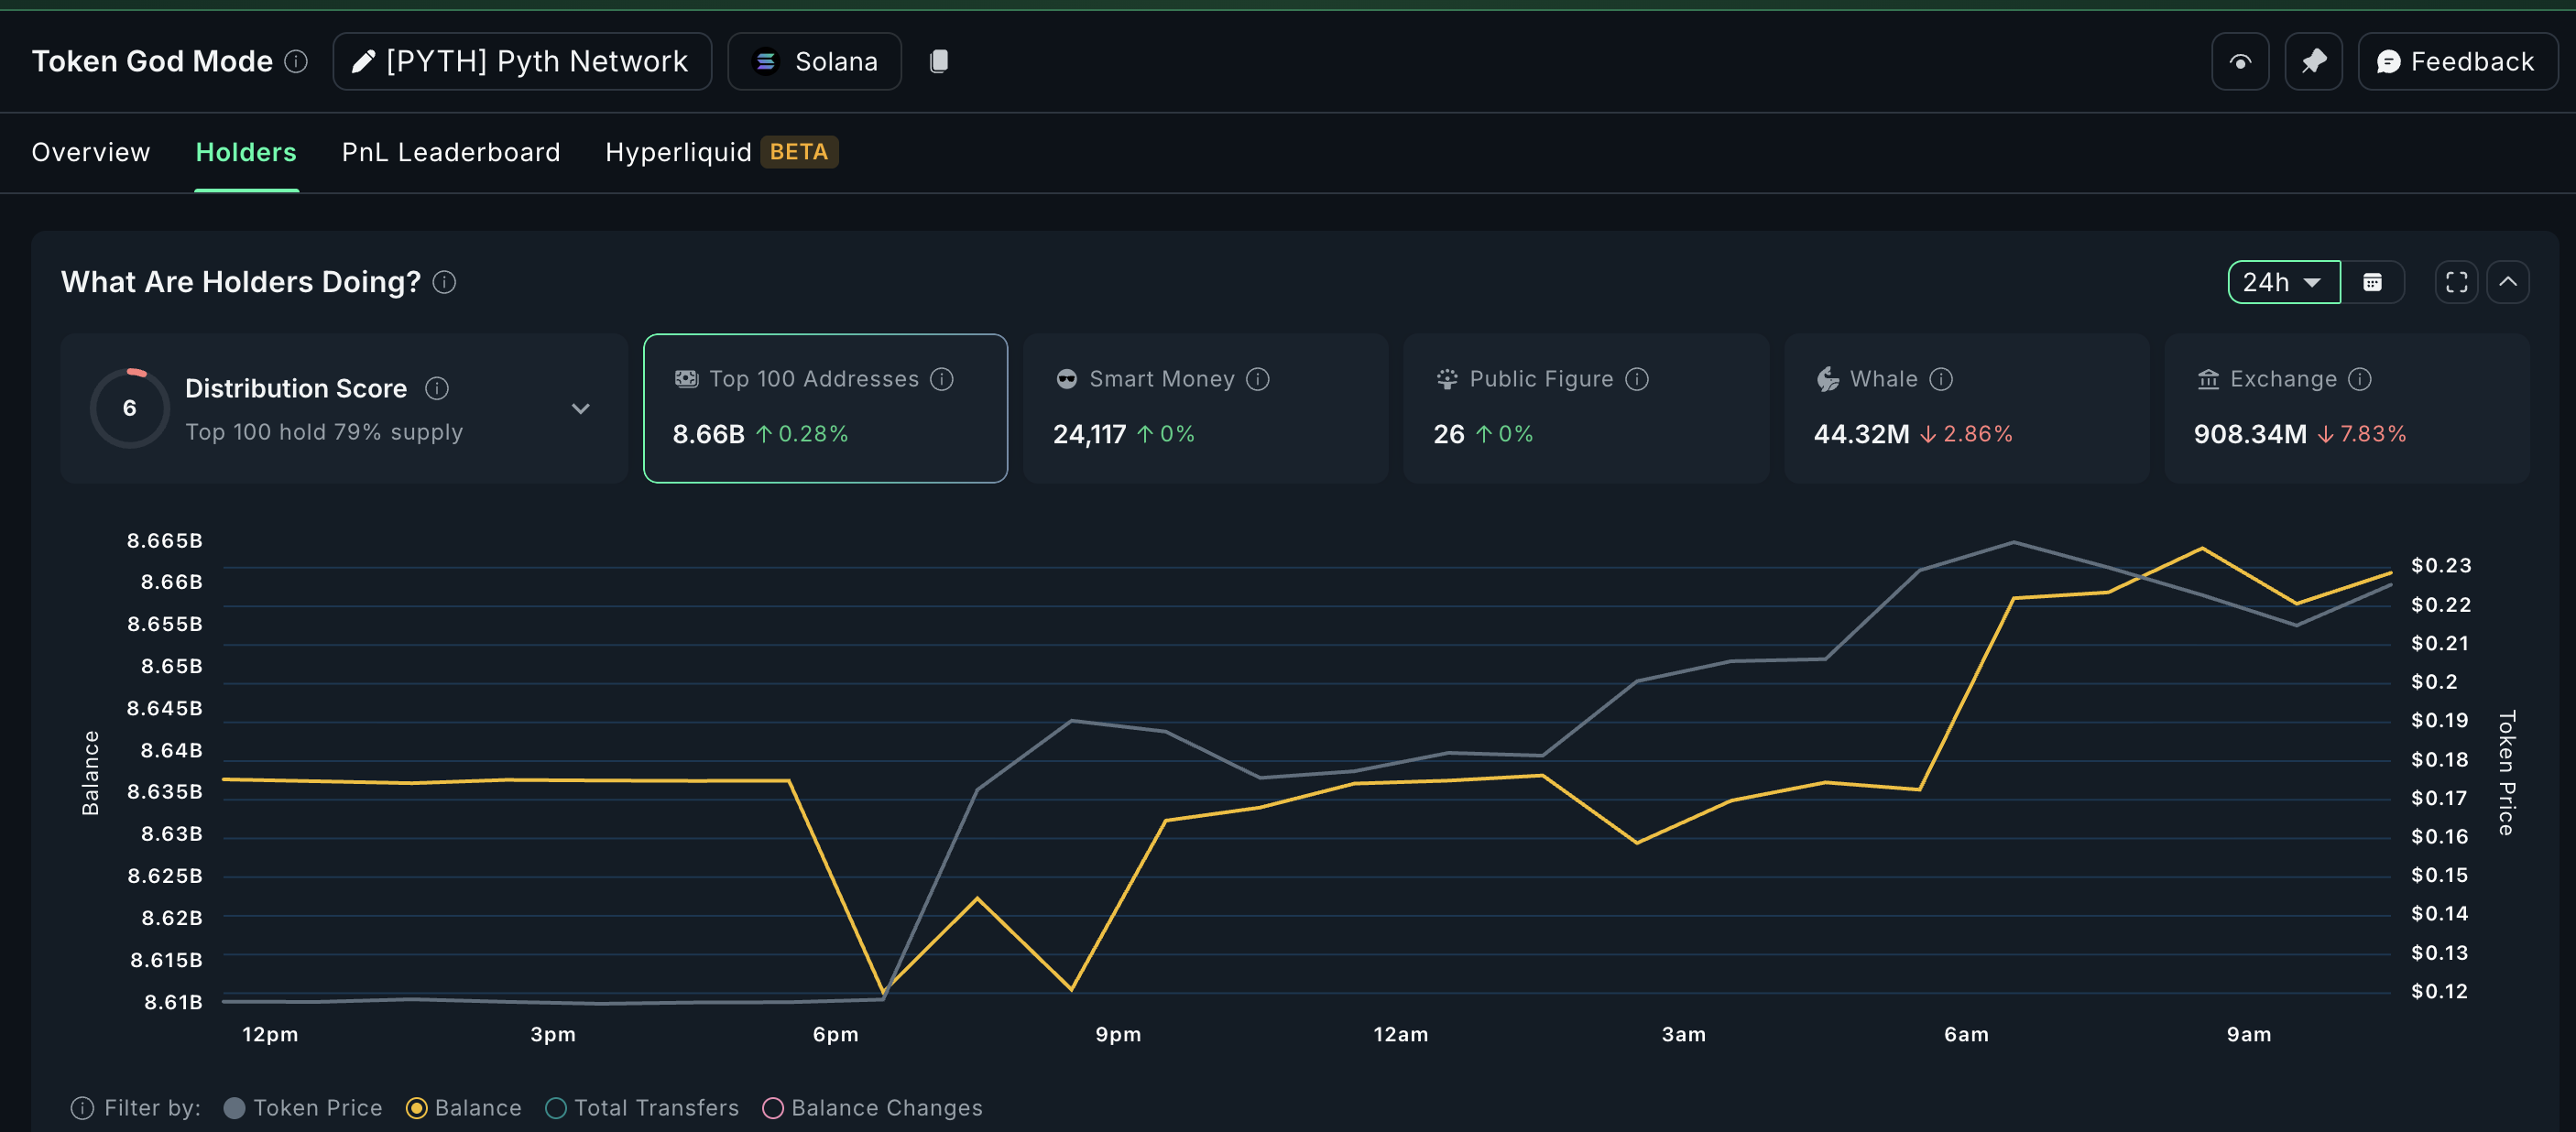
At the same time, the top 100 addresses (another category of whales or mega whales) added 24.1 million PYTH, worth around $5.37 million. Taken together, buyers absorbed more than $22 million worth of tokens. While regular whales took some profit, overall demand stayed strong.
: Want more token insights like this? Sign up for Editor Harsh Notariya’s Daily crypto Newsletter here.
This tug-of-war explains the mixed sentiment. Some traders are selling on the US government data announcement, seeing it as a short-term HYPE play, while others treat it as a long-term adoption signal. So far, the latter group seems to be winning.
Megaphone Pattern Hints At Volatility, But EMA Signals Bullishness
The daily PYTH price chart shows a megaphone pattern, with highs and lows spread further apart. This reflects higher volatility and suggests sharp swings may occur before a breakout.
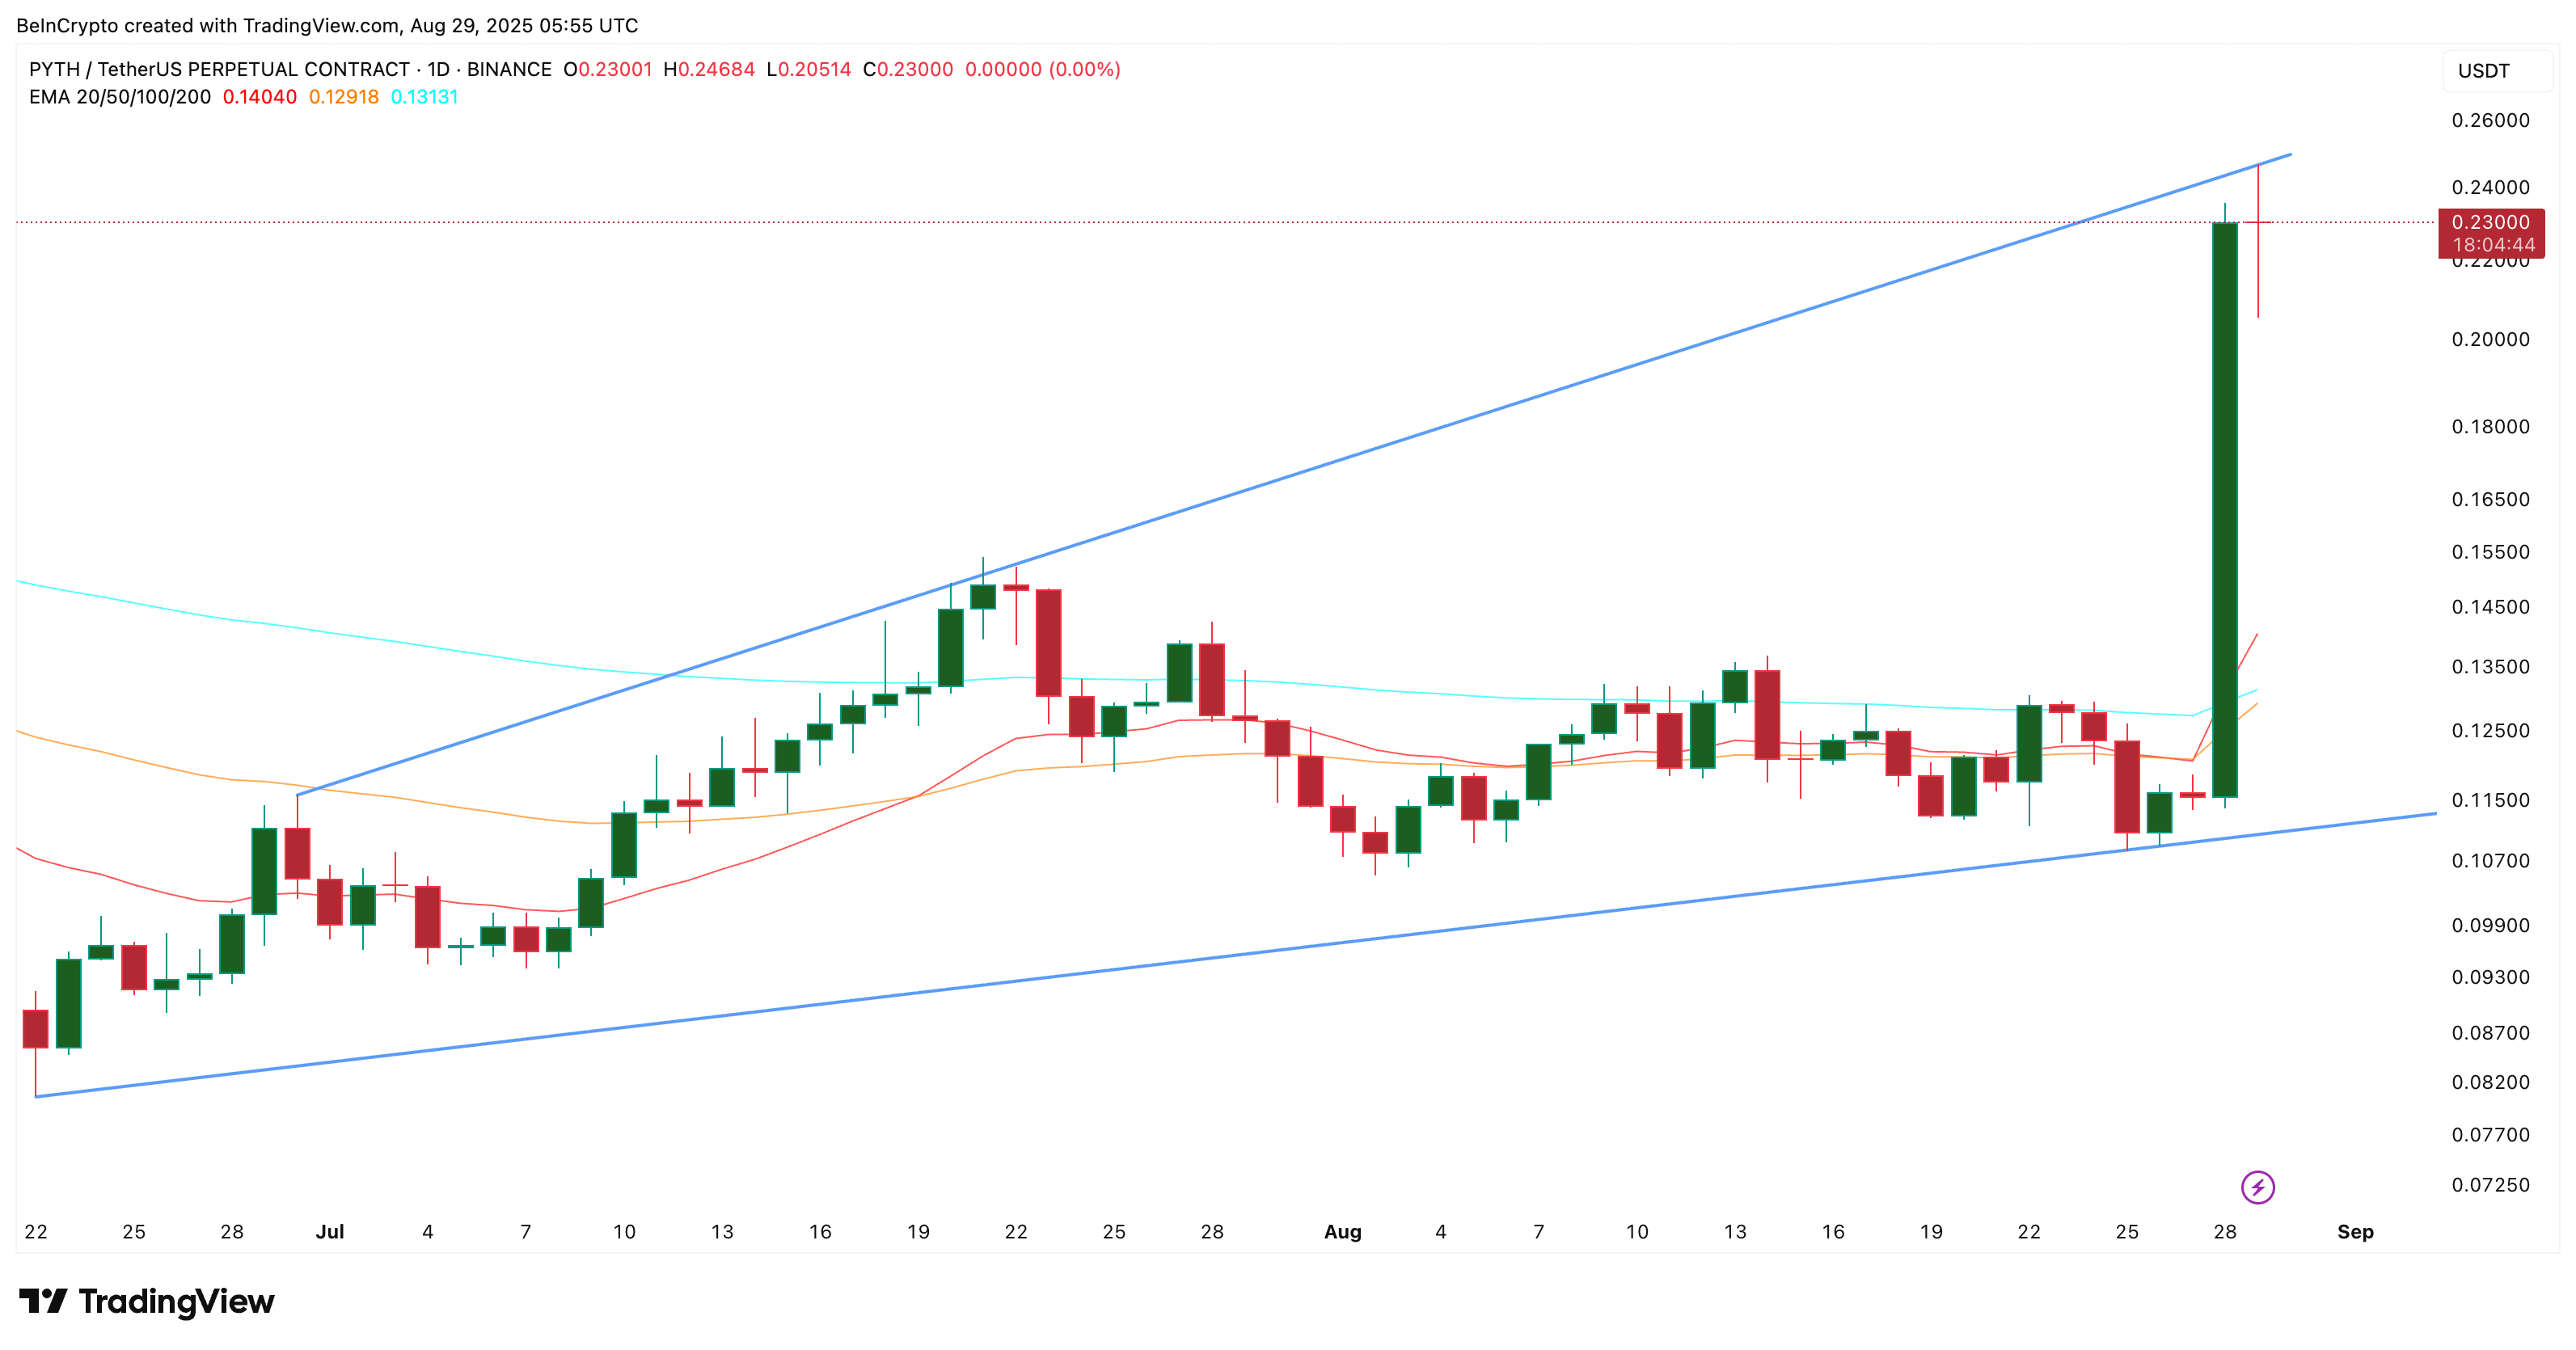
Within this setup, moving averages tell their own story. A past crossover triggered the last rally, and now the 50-day EMA or Exponential Moving Average (orange line) is close to crossing above the 100-day EMA (sky blue line).
The Exponential Moving Average (EMA) is a line on the chart that smooths out price moves by giving more weight to recent data. Traders use it to spot the overall direction of the market. When a shorter EMA (like the 50-day) moves above a longer EMA (like the 100-day), it means buyers are becoming stronger than sellers.
This potential “golden crossover” inside the megaphone adds a bullish trigger. If confirmed, it could help PYTH break out of the pattern despite the expected swings.
The upper trendline breakout could push the PYTH prices higher.
Key PYTH Price Levels To Watch As Bulls Stay In Control
The 4-hour chart is better for spotting near-term price action. On this timeframe, the Bull Bear Power (BBP) indicator remains positive, meaning buying pressure is stronger than selling. This suggests bulls are still in control of momentum, even if intraday PYTH price pullbacks occur.
The Bull Bear Power (BBP) indicator measures the strength of buyers versus sellers by comparing the price to a moving average.
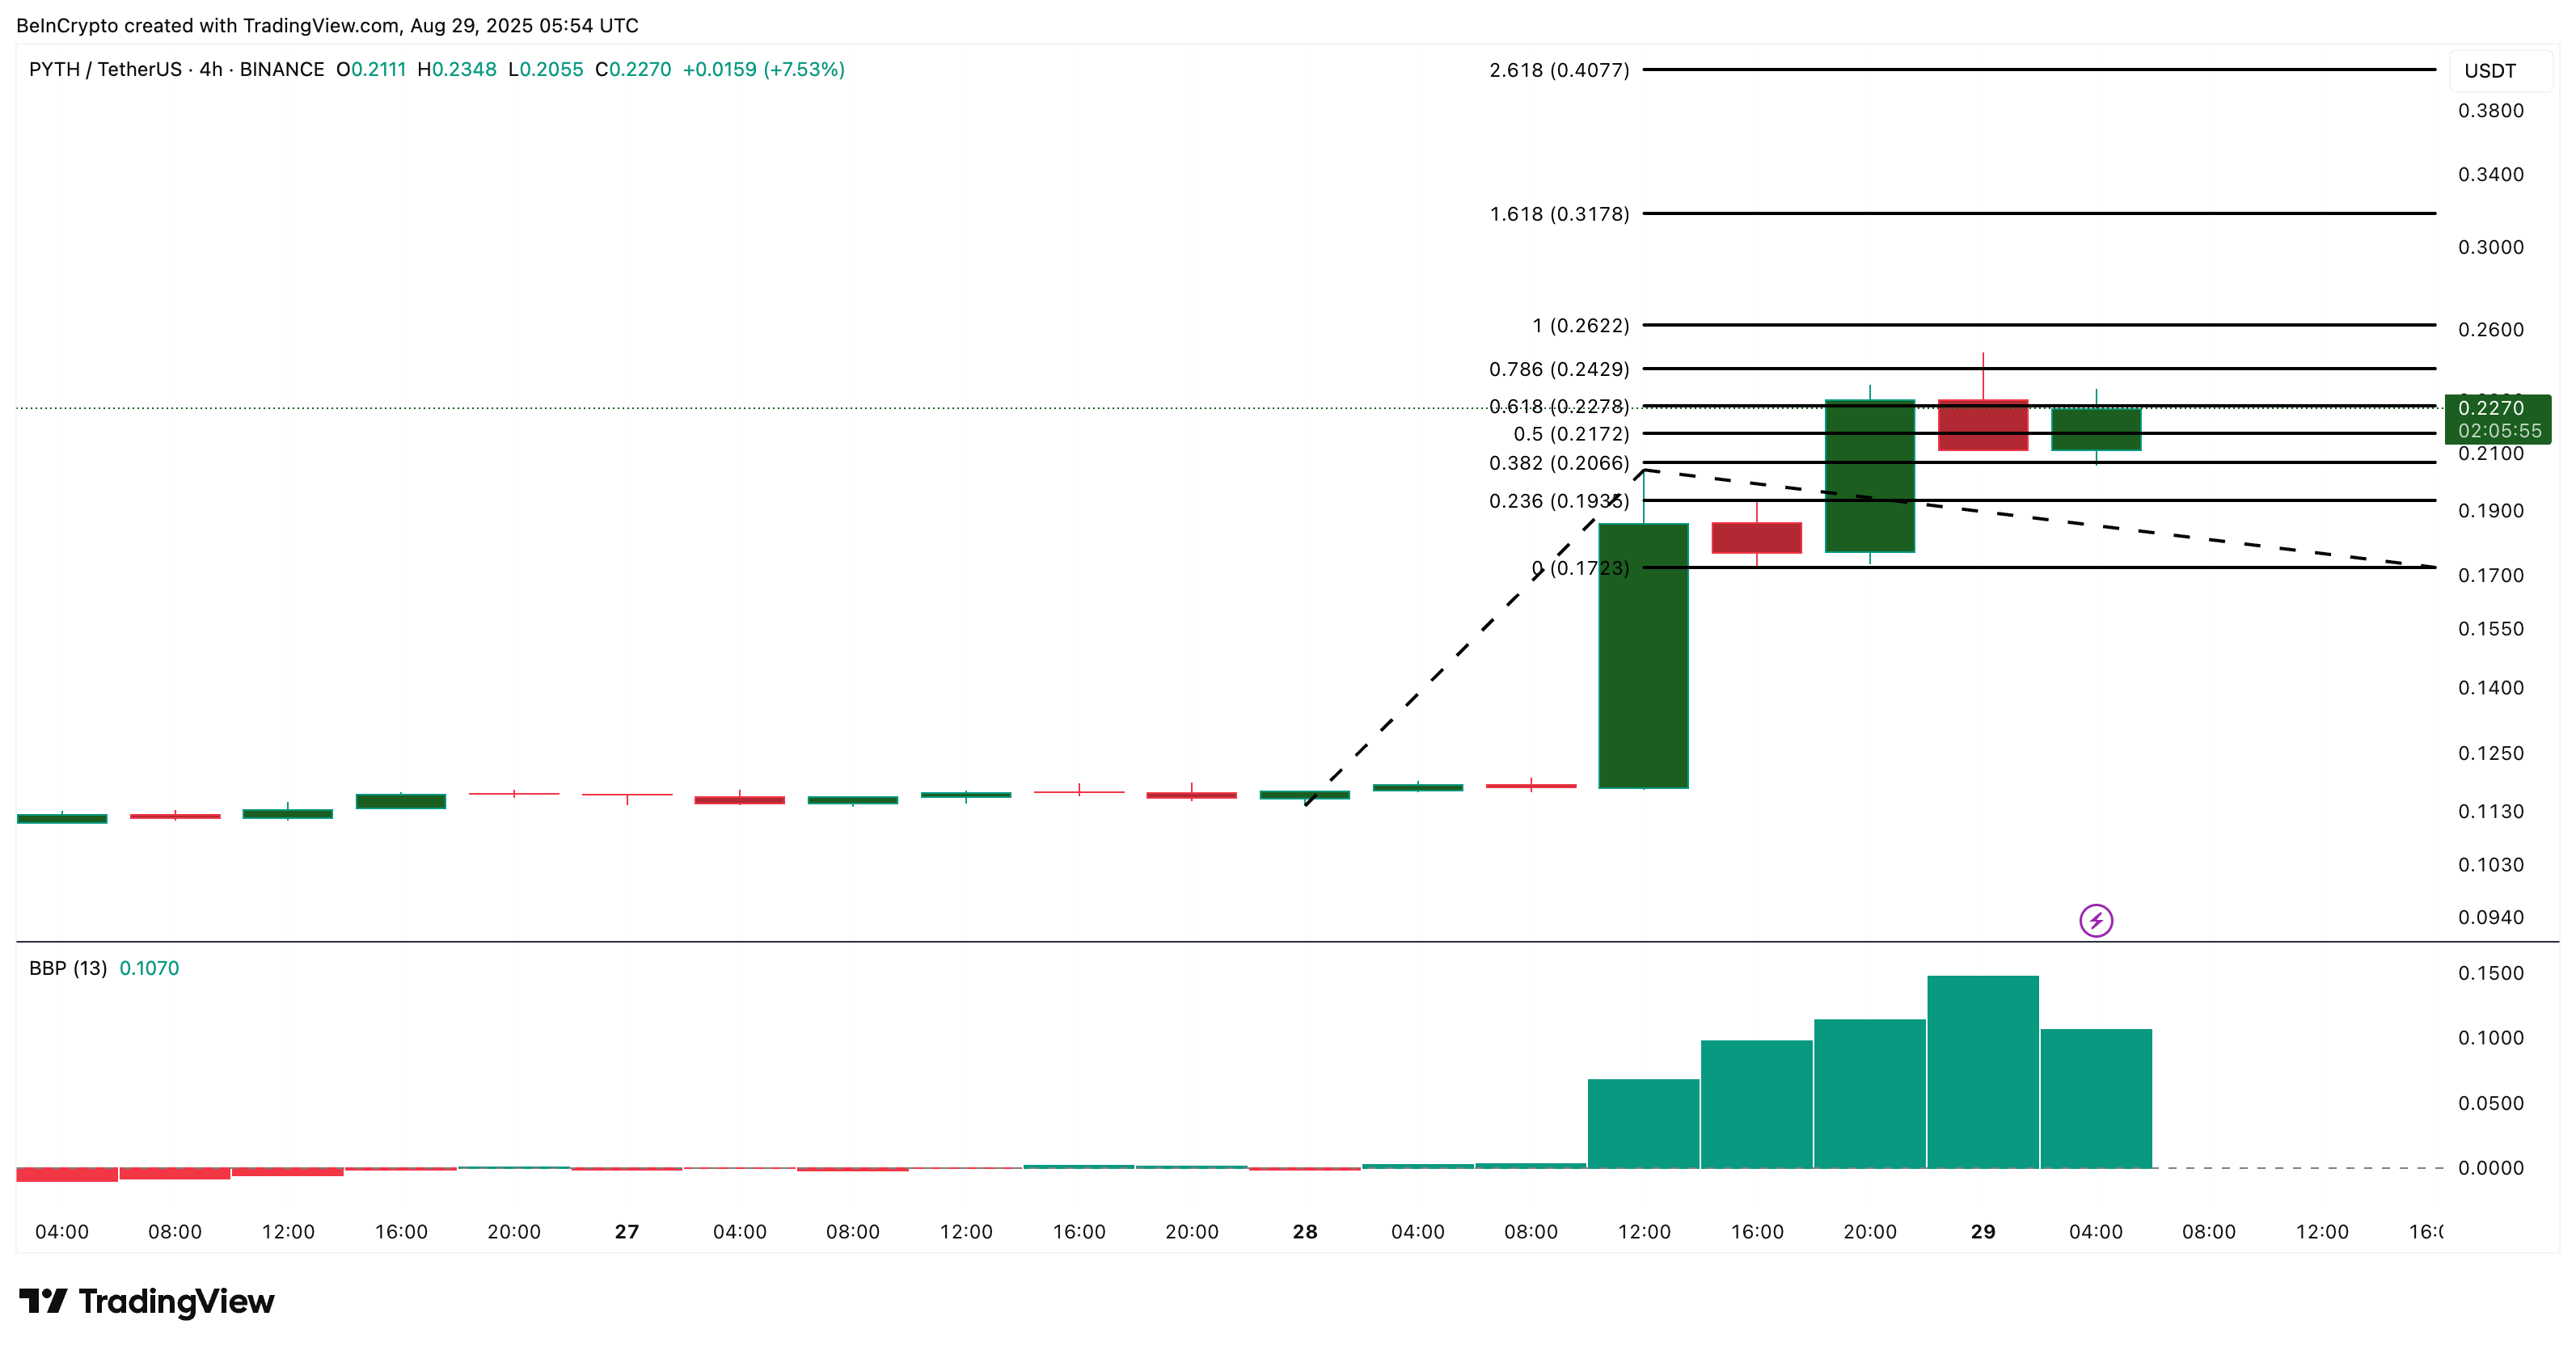
At this time, $0.1935 and $0.1730 are key supports. A drop below these WOULD challenge the bullish view. On the upside, clearing $0.2622 could open the way to $0.40. From $0.223, that would mean nearly an 80% rally.
