Pi Coin Price Nears Another All-Time Low As Key Indicators Turn Bearish

Pi Coin teeters on the brink—technical signals flash red as momentum crumbles.
Bearish Signals Intensify
Key metrics point downward—no recovery in sight. Trading volume shrinks while resistance levels hold firm. The network's much-hyped 'mainnet launch' did little to stabilize the free-fall.
Market Reality Bites
Retail holders watch portfolios bleed out—another classic case of 'number go up' theology meeting actual market mechanics. When your biggest innovation is mobile mining accessibility, maybe don't expect institutional money to care.
Zero fundamental developments, zero institutional interest—just another day in crypto paradise.
Buyers Fail to Regain Control as Selling Pressure Persists
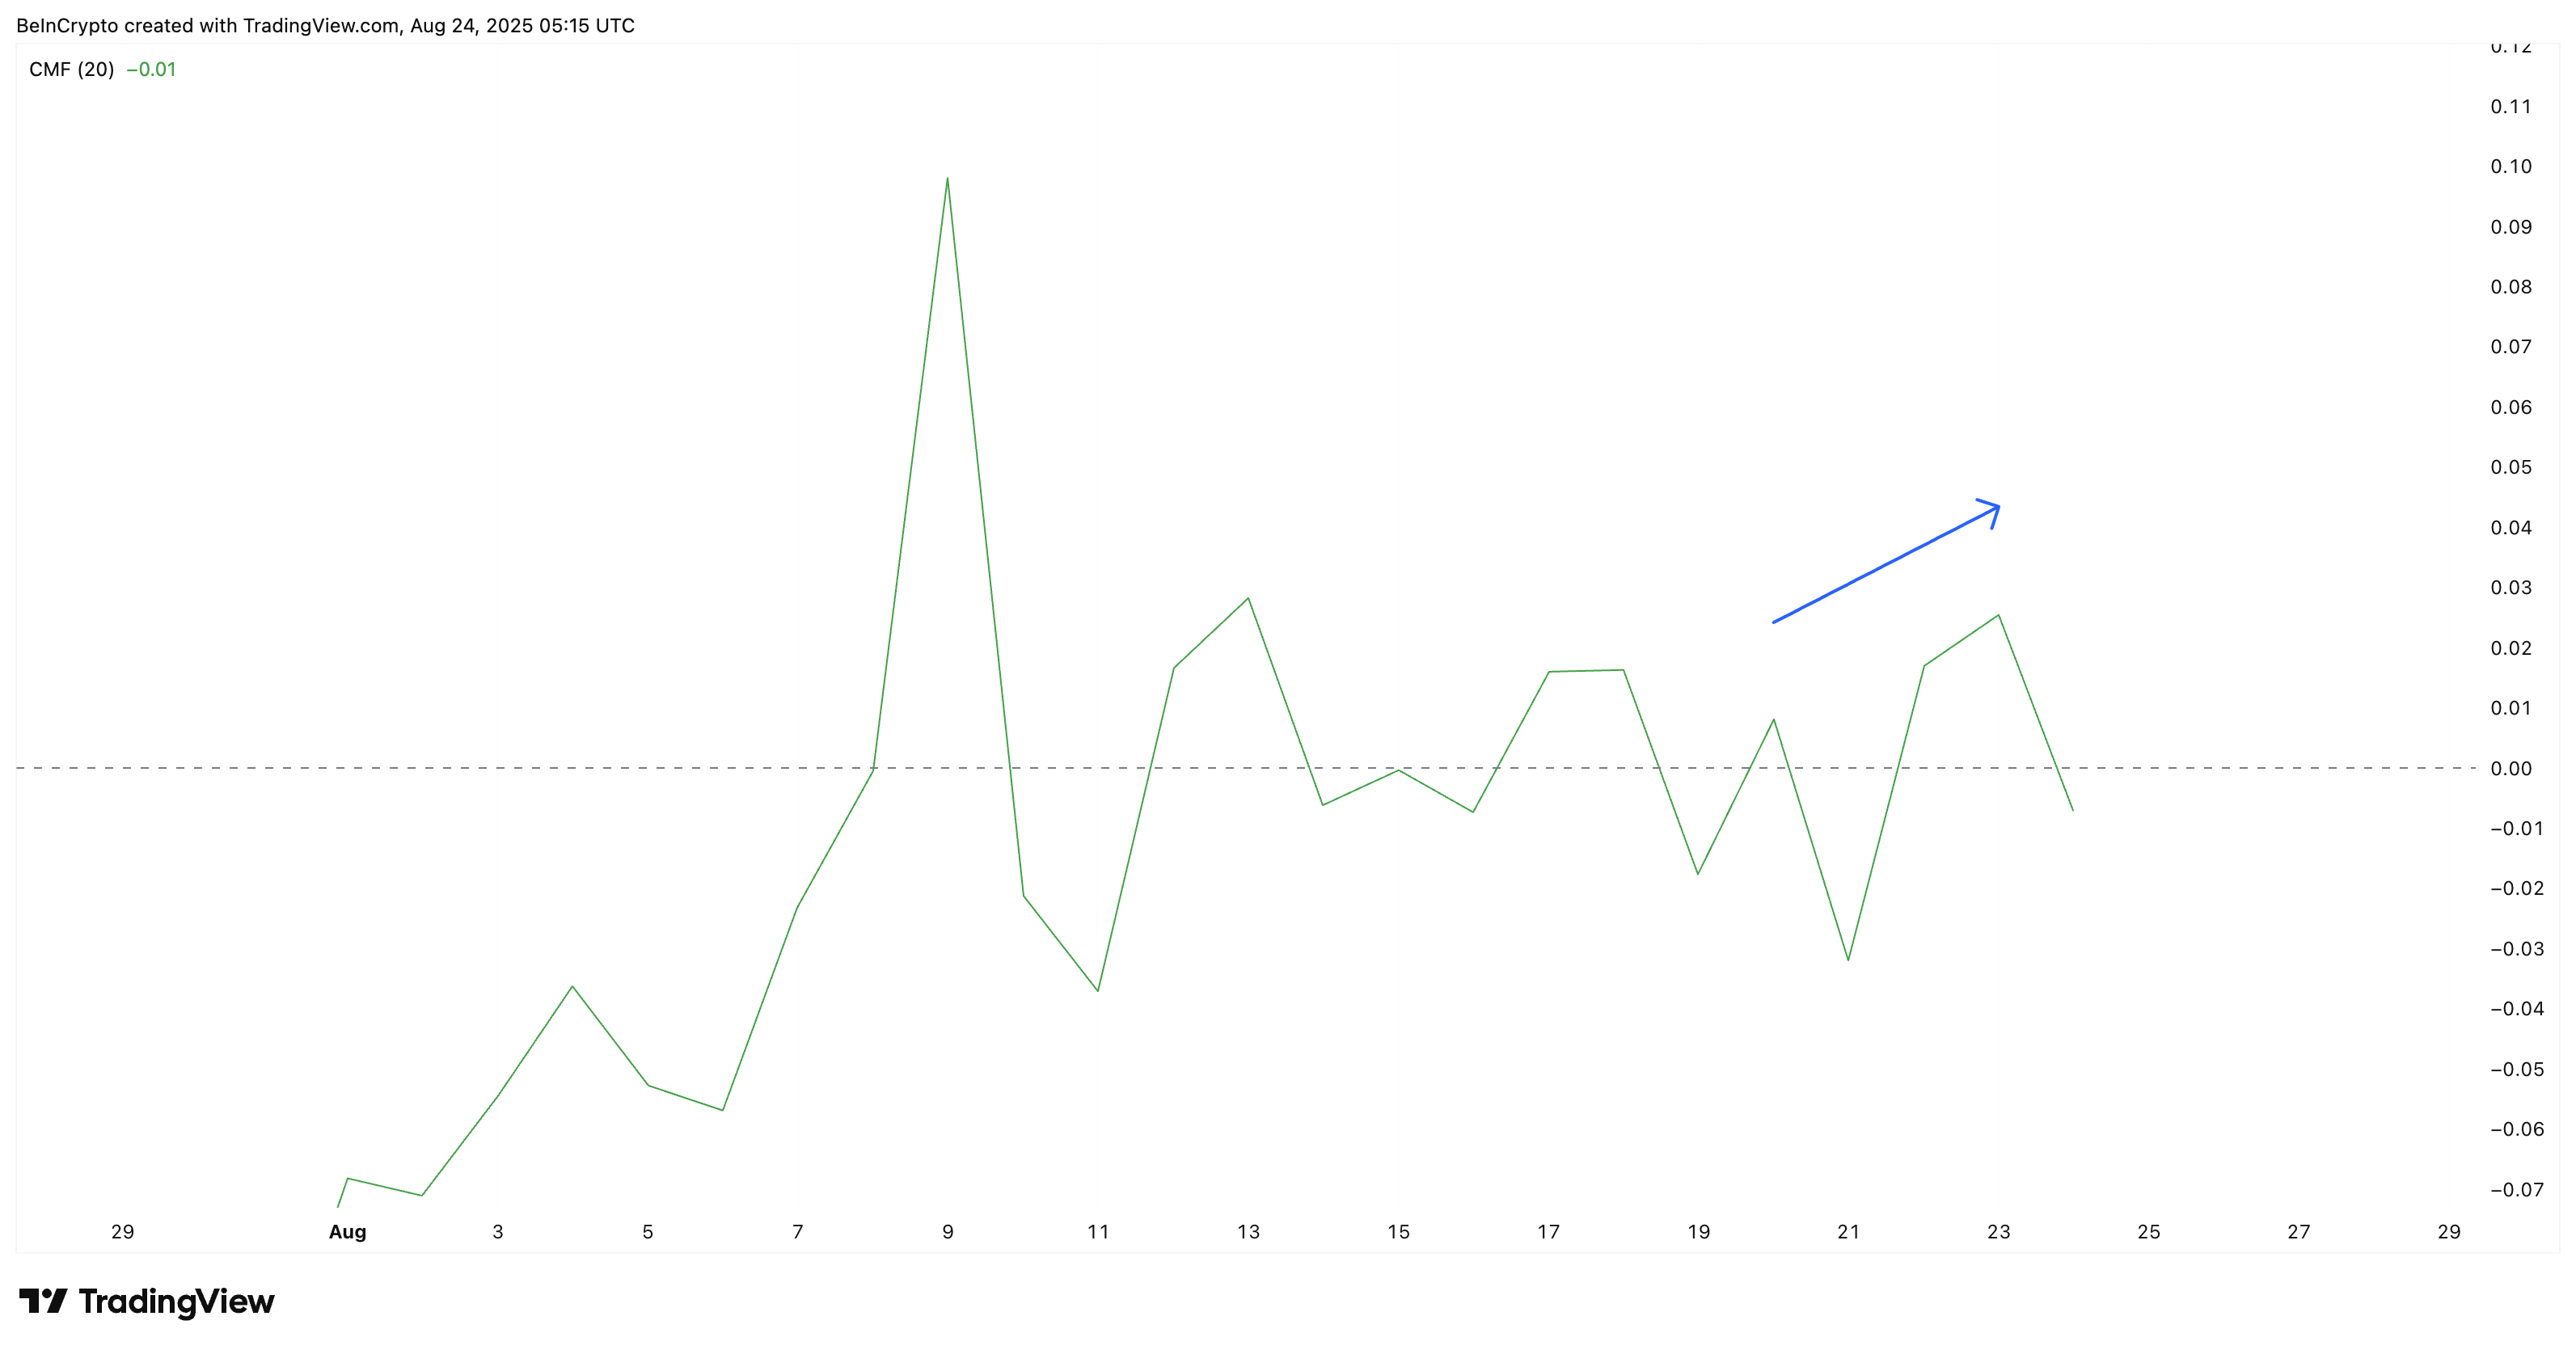
The Chaikin Money FLOW (CMF), which tracks capital inflows and outflows, briefly moved higher earlier in August, hinting at rising demand. But the latest reading has dropped back below zero, confirming that selling pressure still outweighs capital inflows.
For PI, this shift suggests buyers attempted to regain control but failed to sustain it.
The Bull Bear Power (BBP) reinforces the bearish picture. It’s an indicator that gauges whether buyers (bulls) or sellers (bears) control the market.
While the indicator shows that bearish strength has eased slightly, the last two sessions have remained flat. This suggests that bulls attempted a push but failed to overpower sellers.
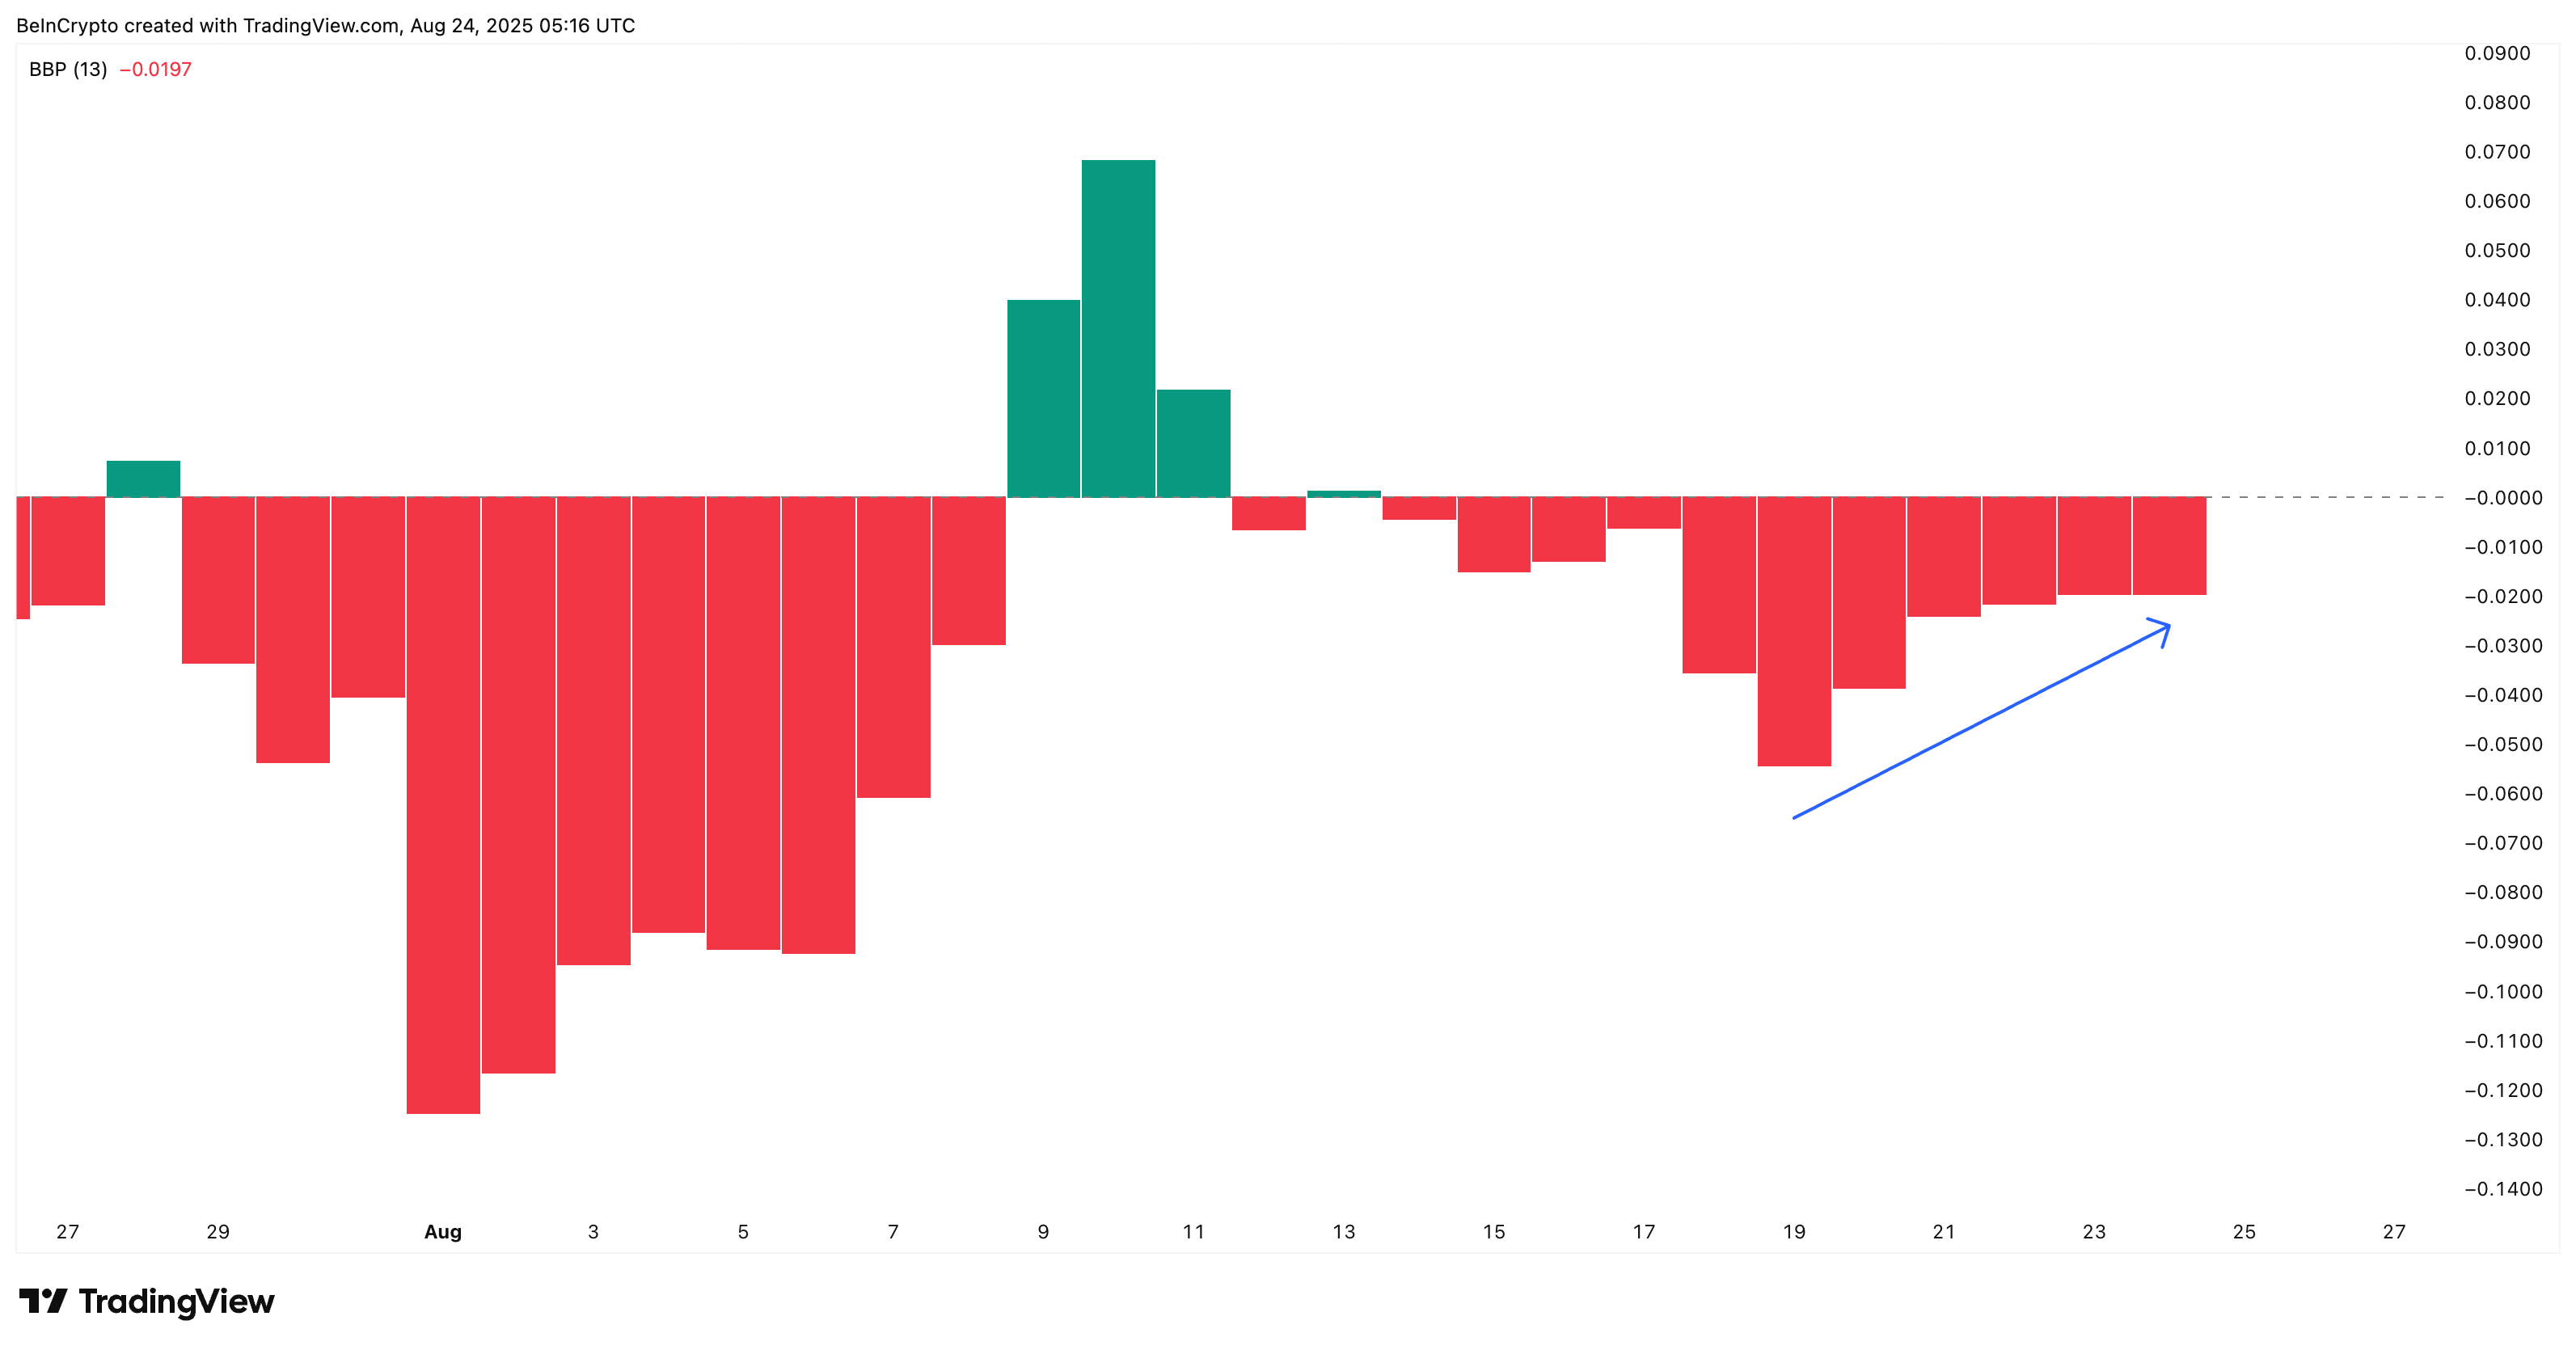
When paired with CMF’s negative reading, the data suggests that selling pressure is still firmly in control despite buyers trying to undo the bearish momentum.
Hidden Divergence Confirms Bearish Bias As Key PI Price Levels Come In Focus
The weakness seen in CMF and BBP is echoed by momentum signals. The Relative Strength Index (RSI) has formed a hidden bearish divergence.
This means while PI’s price chart shows lower highs, the RSI posted higher highs NEAR the mid-40s. This disconnect indicates momentum isn’t translating into upward price action, reinforcing the bearish bias.
The Relative Strength Index (RSI) measures the speed and strength of price moves, showing whether an asset is overbought or oversold. A hidden bearish divergence occurs when the price makes lower highs while the RSI makes higher highs.
This signals that even though momentum seems stronger, sellers still control the trend, and the downtrend is likely to continue.
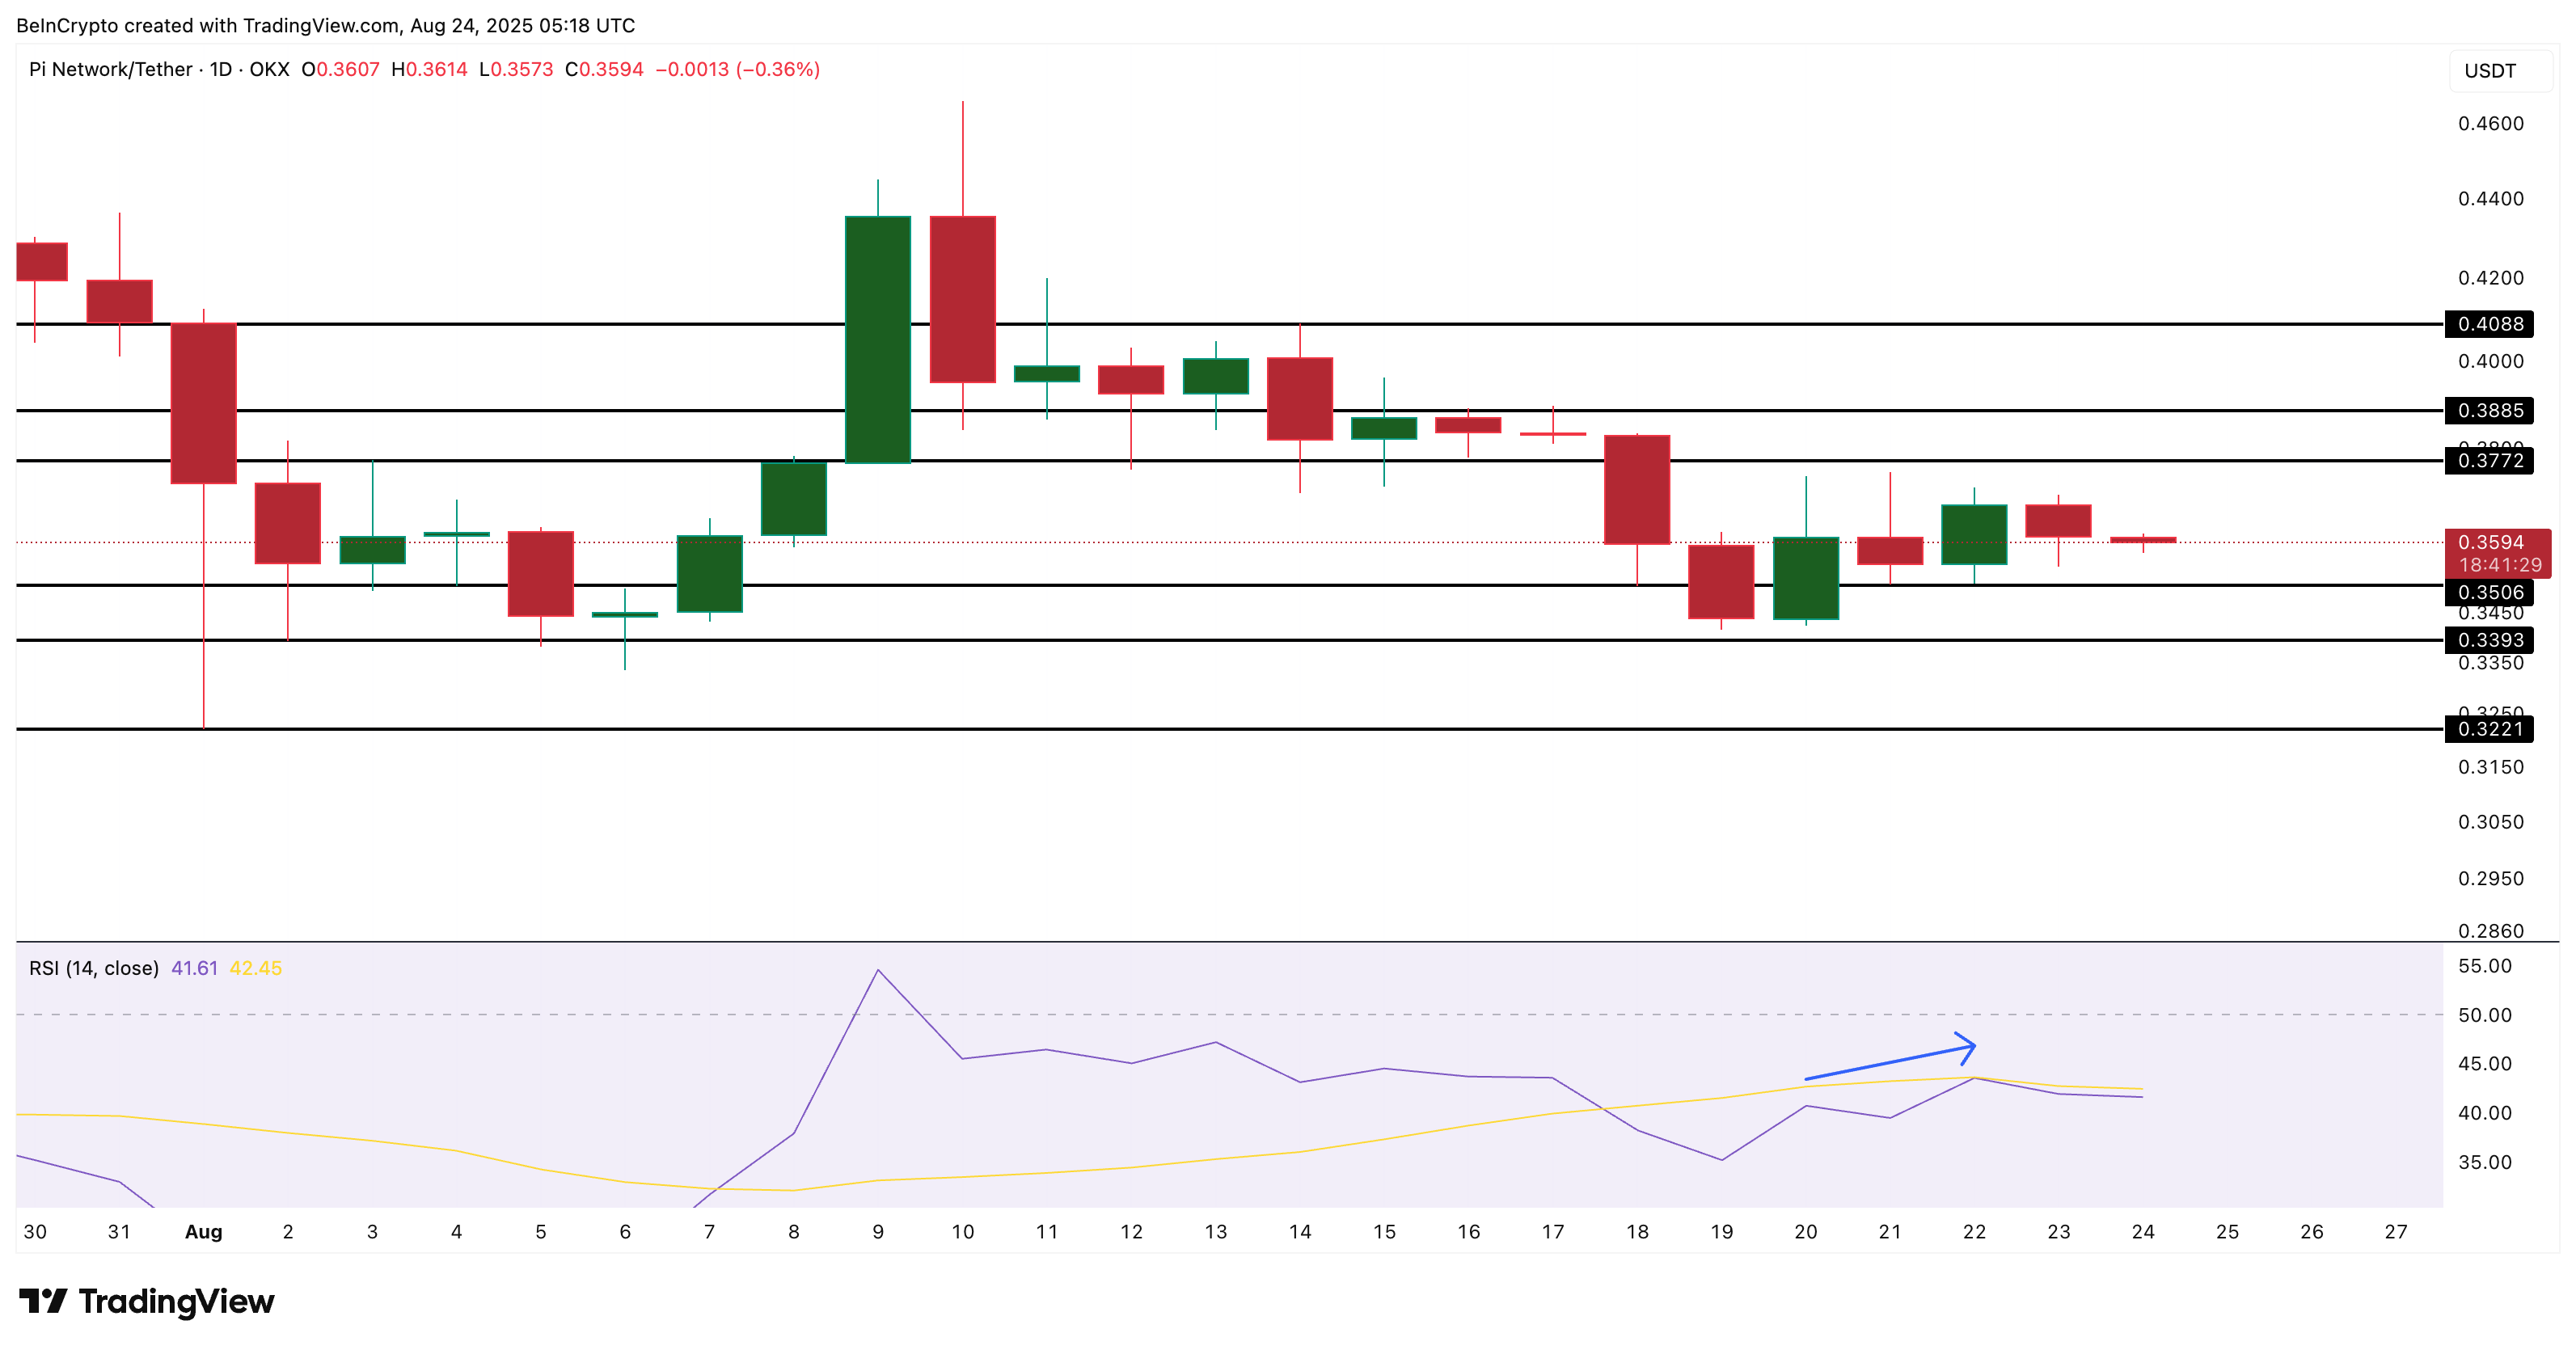
This kind of hidden bearish divergence emphasises the continuation of the downtrend for the Pi Coin price. The pattern flashing on the daily chart (longer timeframe) might be the key reason why a new Pi Coin price low is imminent.
Currently trading near $0.359, the Pi Price faces strong support at $0.350. A breakdown below this level could accelerate losses toward $0.339 and $0.322, with fresh all-time lows likely if $0.322 is breached.
On the upside, bulls WOULD need to reclaim $0.377 and then $0.408 to reverse the structure; a move that looks unlikely unless inflows return decisively.
