3 Altcoins Primed for a Weekend Surge – August 23-24 Trading Watch

Crypto markets are heating up—here’s where smart money’s lurking this weekend.
BNB: The Exchange Token Flexing Muscle
Binance’s native token defies regulatory side-eye, flirting with ATHs again. When the house wins, so do holders—for now.
Ethereum Rival Plays Catch-Up
One smart-contract challenger’s 30% weekly pump hints at rotation from ETH’s gas fee fatigue. Traders chase ‘discounted’ DeFi.
Memecoin Dark Horse Galloping
A dog-themed outlier quietly tripled its open interest. Retail’s back for another spin on the volatility carousel—strap in.
Weekend crypto moves often vanish by Monday—like hedge fund promises. But these three show the market’s bipolar appetite for ‘fundamentals’ and pure degenerate momentum.
Zcash (ZEC)
Zcash, known for its privacy-focused protocol, is showing signs of renewed strength after weeks of sideways trading. It is already up 9% day-on-day.
On the 12-hour chart, the ZEC price is pressing against the resistance at $43.48.
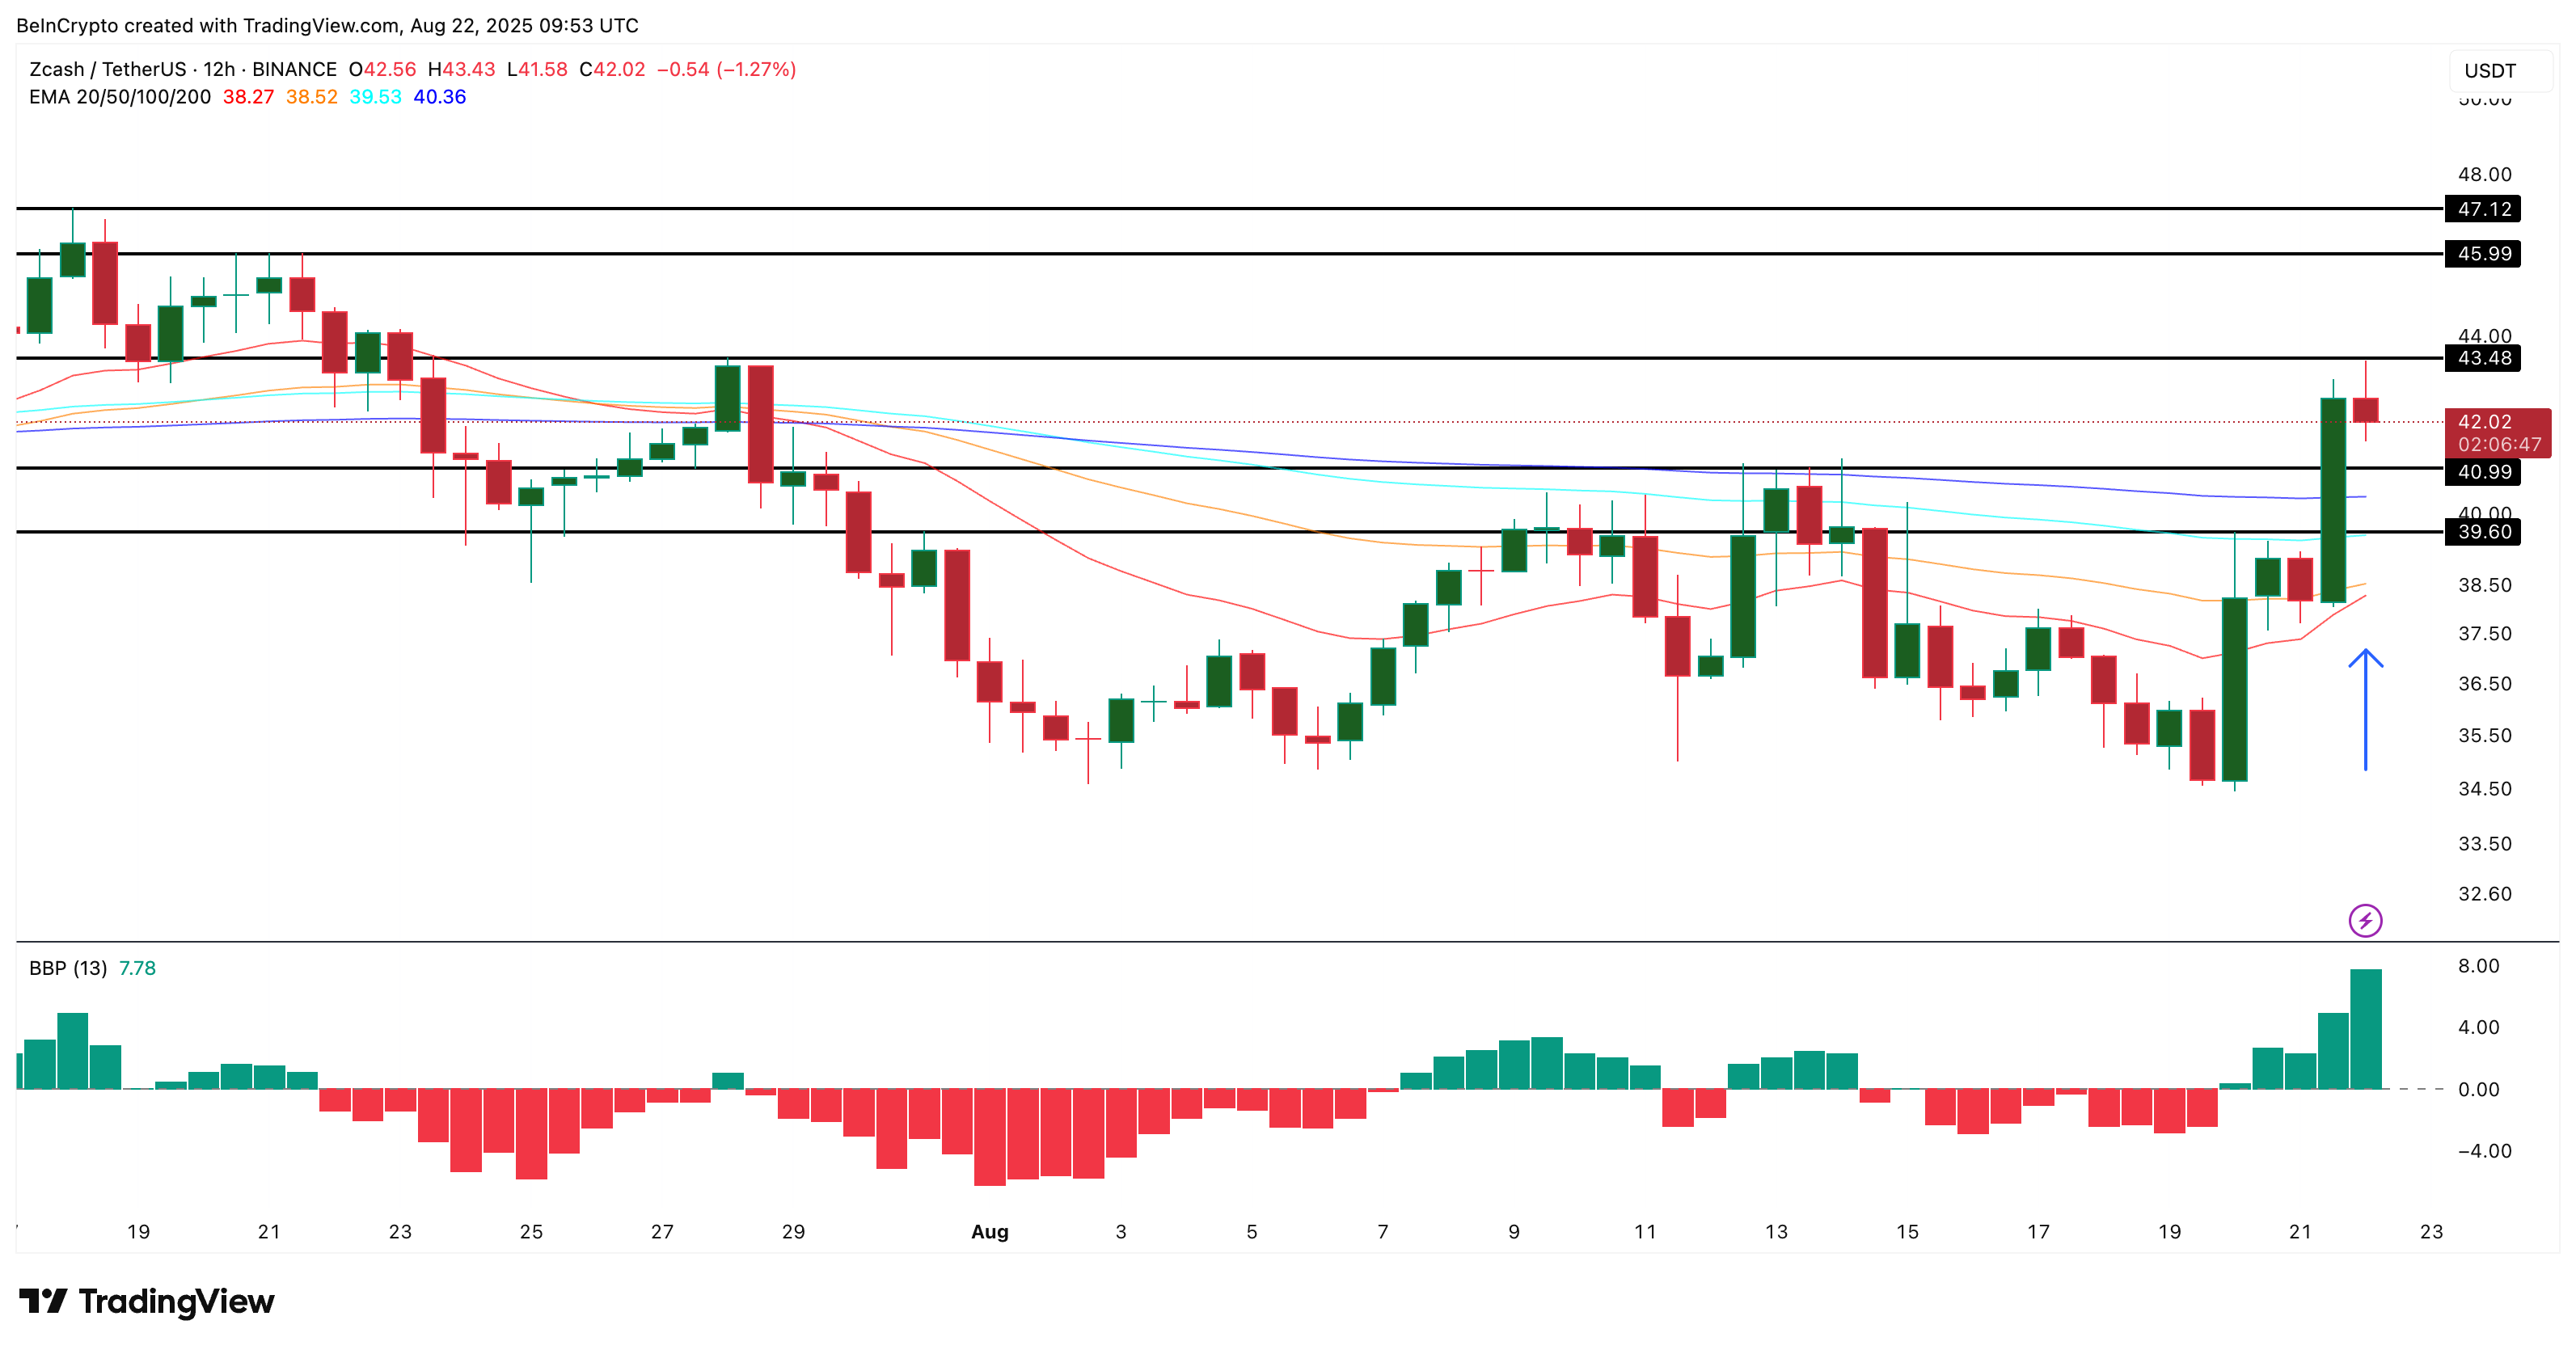
What makes this MOVE notable is the growing alignment of momentum indicators: the 20-day EMA or Exponential Moving Average (red line) is on the verge of crossing above the 50-day EMA (orange line). This bullish shift often precedes sharp rallies.
A bullish EMA crossover happens when a shorter-term EMA (like the 20-day) moves above a longer-term EMA (like the 50-day). It suggests that buyers are gaining strength and the trend may be turning upward.
At the same time, the Bull Bear Power indicator has turned aggressively in favor of bulls, backing the weekend-centric bullish momentum.
The Bull Bear Power shows the tug-of-war between buyers (bulls) and sellers (bears). When it is positive, bulls are stronger; when it is negative, sellers are pressing harder.
If the setup holds, ZEC could extend its rally toward $45.99 and $47.12. However, a complete candle close above $43.48 is required for that. The risk, however, lies in losing the $39.60 base, which WOULD neutralize the bullish crossover narrative and place the token back into consolidation.
: Want more token insights like this? Sign up for Editor Harsh Notariya’s Daily crypto Newsletter here.
Chainlink (LINK)
Chainlink continues to reinforce its reputation as the leading oracle project, and recent on-chain activity has added fuel to the narrative.

In just the past week, whales have accumulated 1.09 million LINK, a 24.77% increase in holdings, now worth almost $27 million at current prices. Such concentrated buying from large holders rarely goes unnoticed, and it often creates a floor beneath the market while hinting at confidence in the project’s outlook.
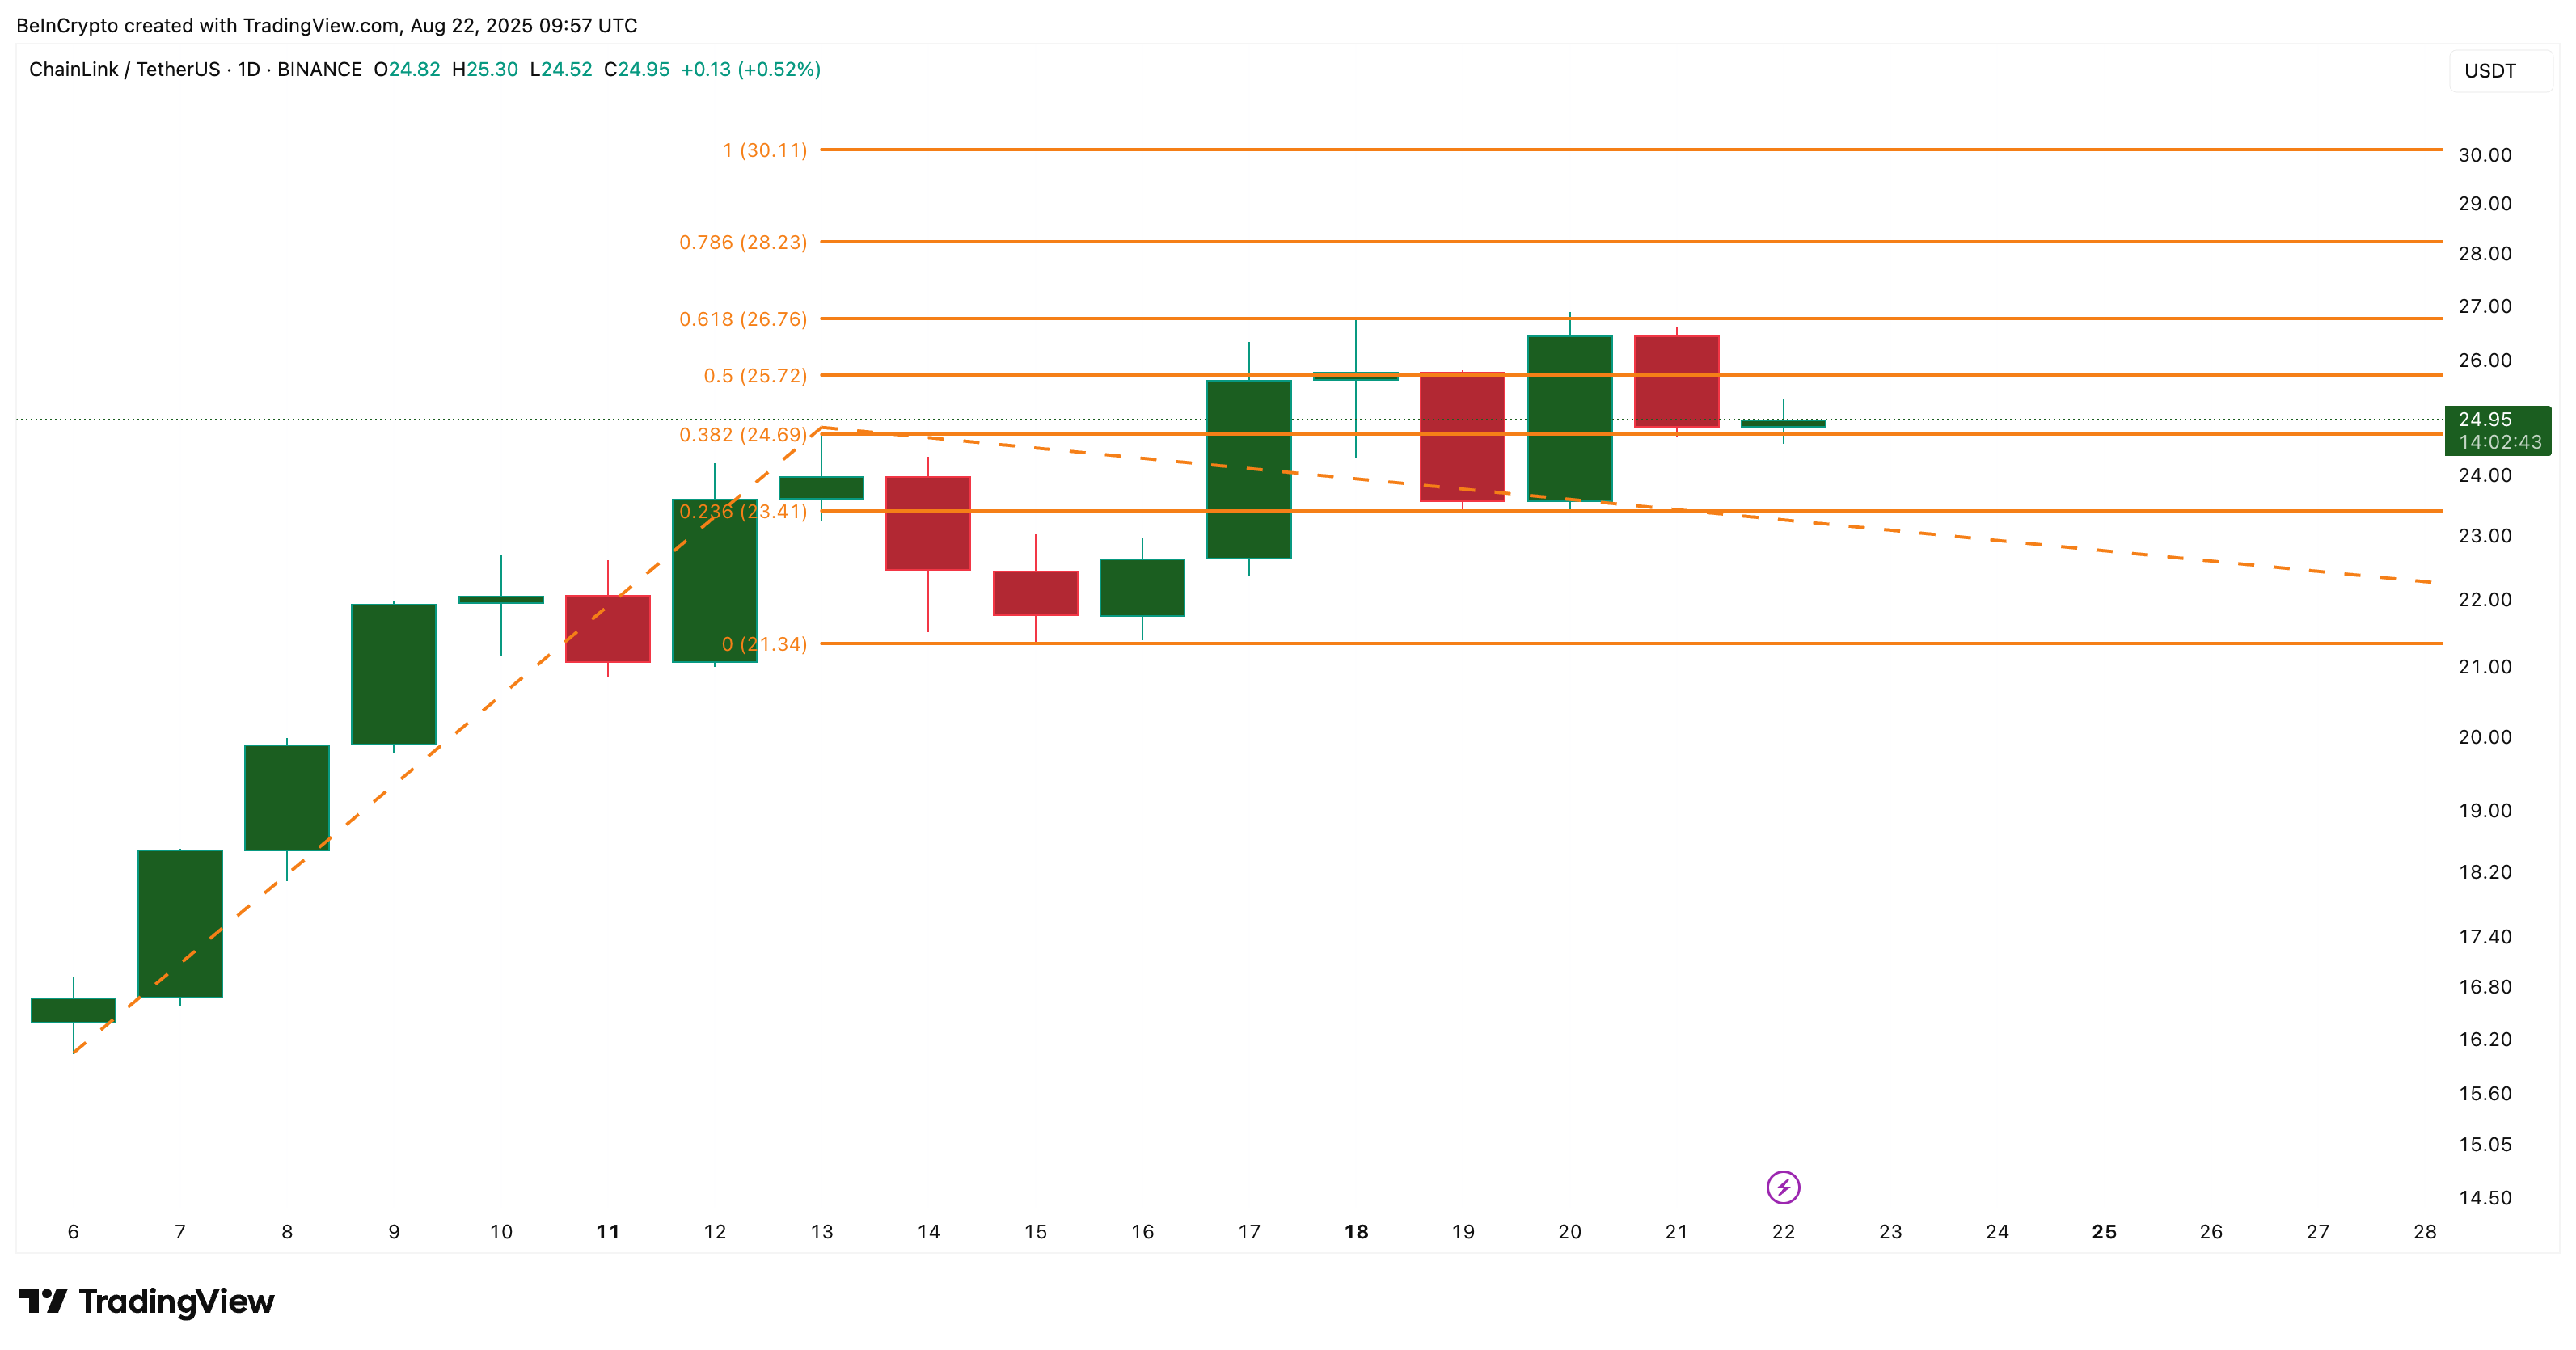
Technically, LINK has been consolidating around $24.95, sitting just between the Fibonacci retracement zones of $24.69 (0.382) and $25.72 (0.5).
A successful breakout above $26.76 (0.618) could propel the token toward $28.23 and eventually the psychological $30.00 level.
Importantly, the current dip has offered new entry zones just as whale demand has increased, underscoring why chainlink remains a top pick in any list of altcoins to watch. A sustained breakdown below $21.34, however, would invalidate the bullish setup.
Toncoin (TON)
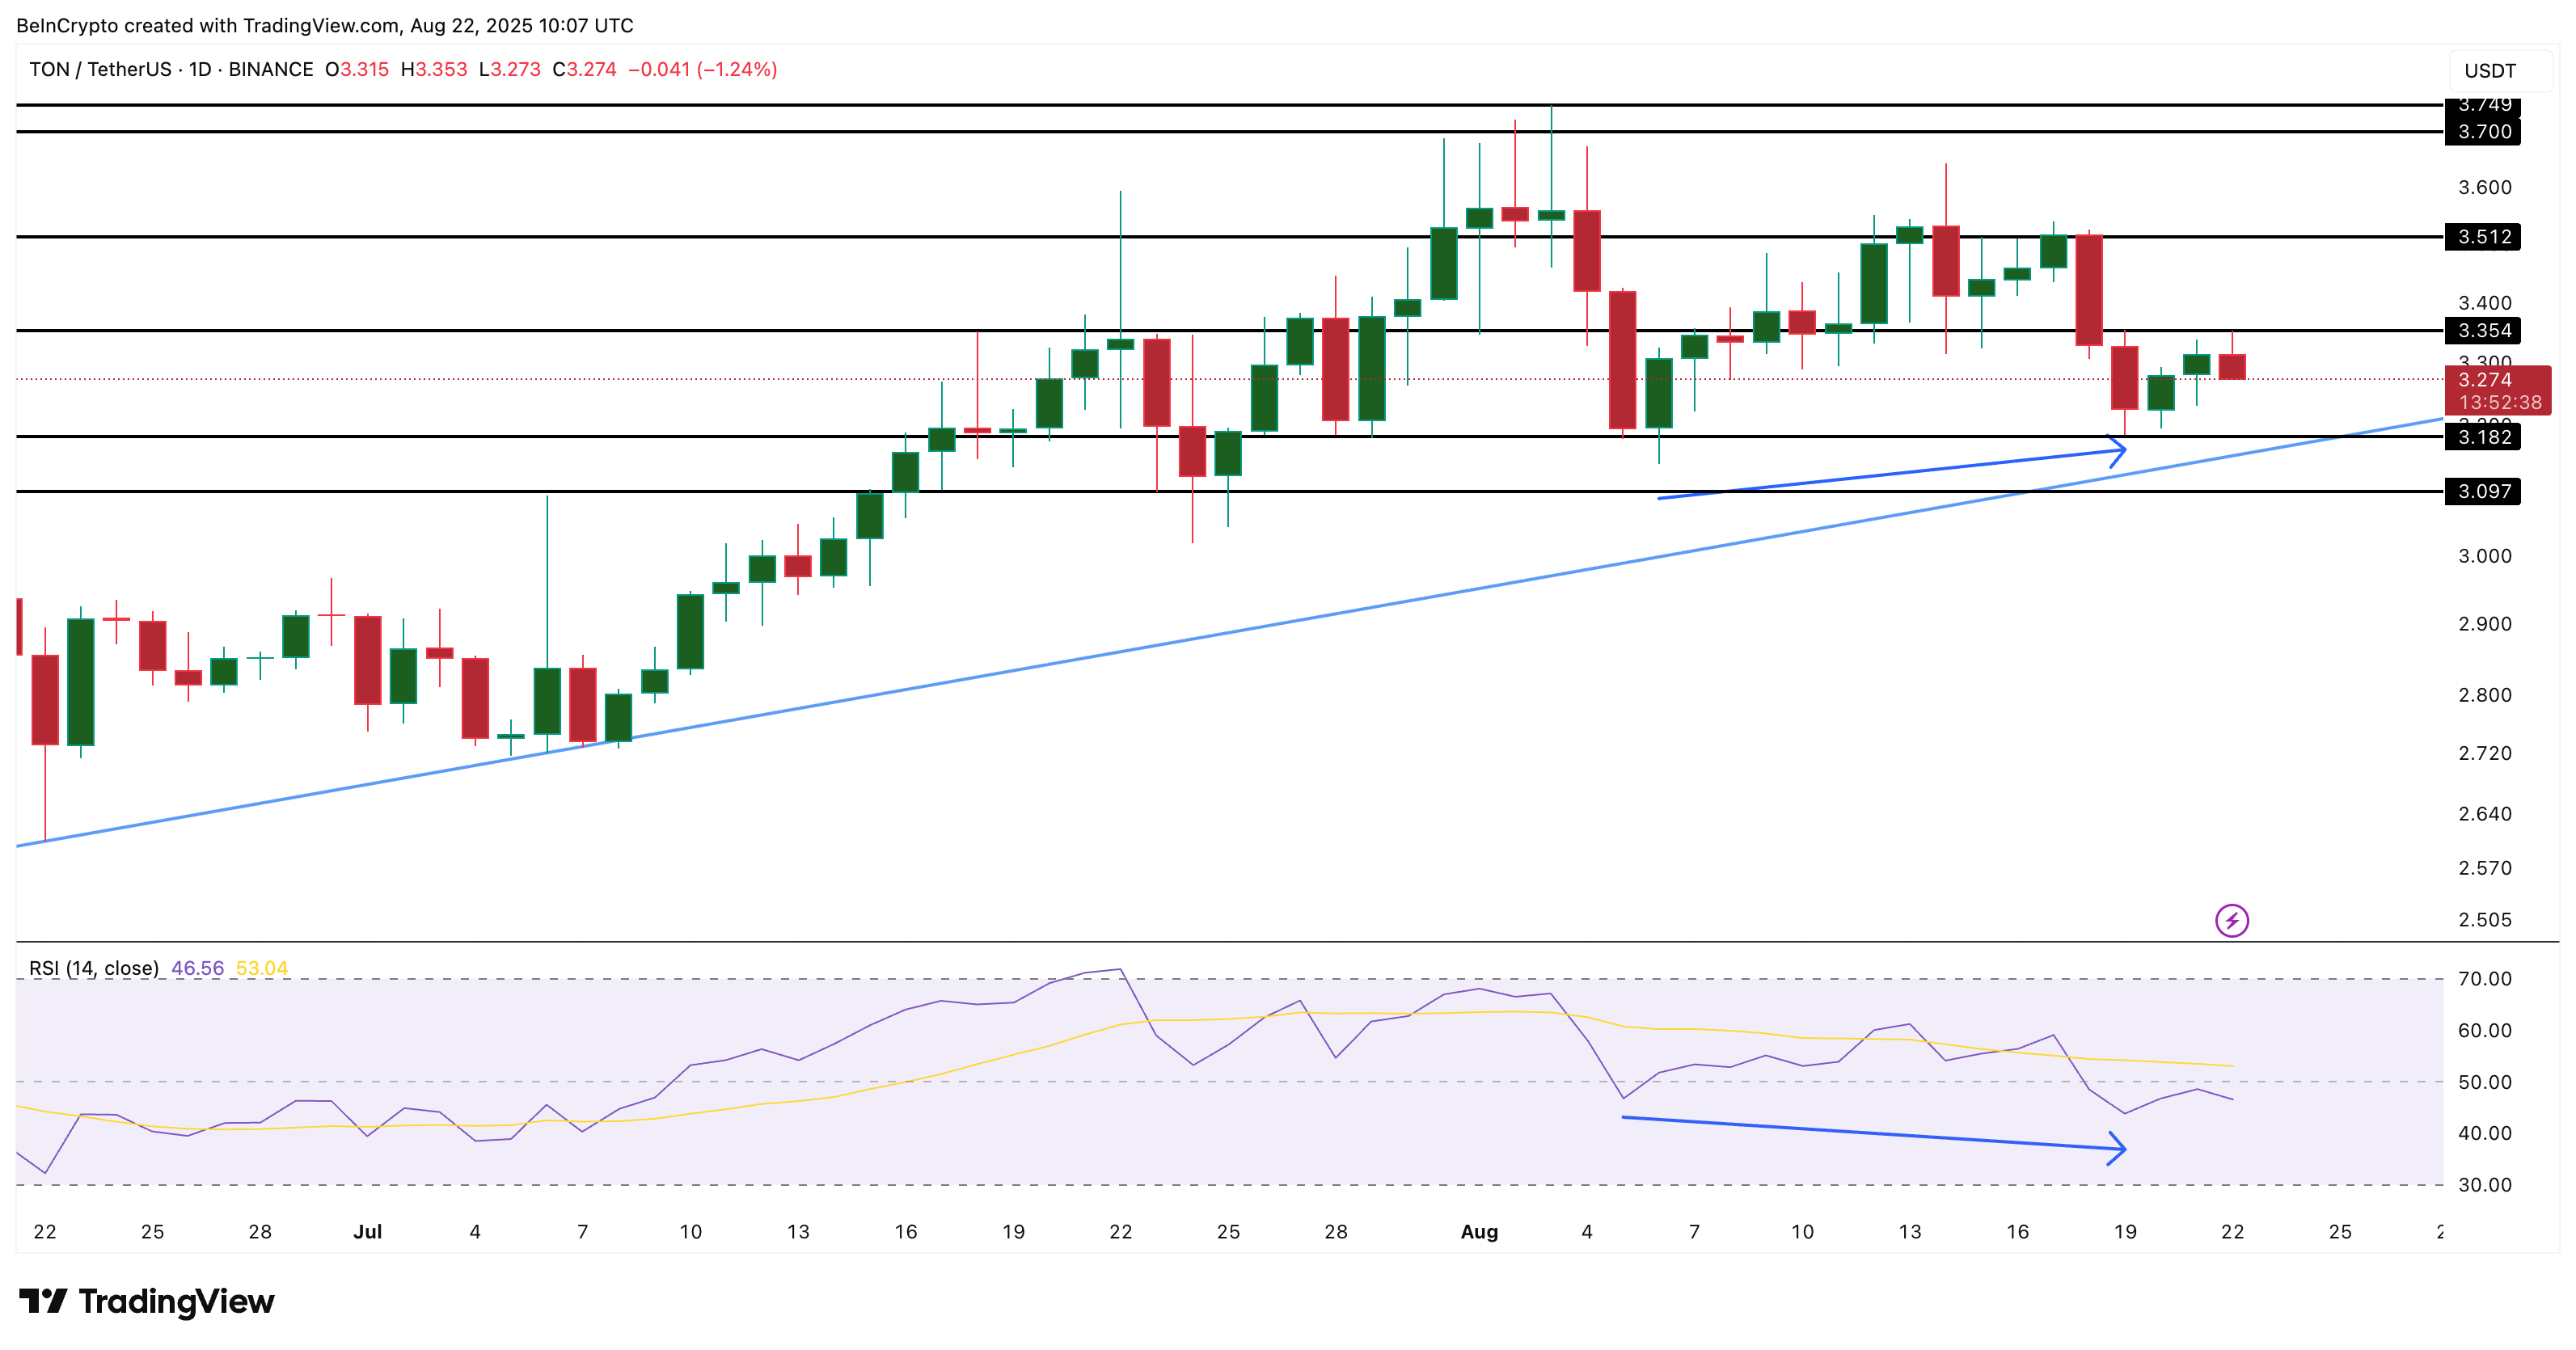
Toncoin has been steadily gaining market attention, both technically and fundamentally. On the charts, TON trades NEAR $3.28, resting within a week-long ascending channel. The price is consolidating just under the resistance at $3.35, and a breakout here could accelerate moves toward $3.51 and $3.70.
Adding weight to the bullish case is a hidden divergence: while the RSI (Relative Strength Index) has made a lower low, the price itself has printed a higher low; a classic signal of underlying buyer strength and a potential reversal ahead.
The RSI tracks buying and selling momentum on a scale of 0 to 100. A divergence happens when price and RSI move in opposite directions. For example, in a hidden bullish divergence, the price makes a higher low while the RSI makes a lower low. This often signals that buying pressure is quietly building even though the chart looks weak.
Fundamentals provide even more support. Verb Technology’s $780 million treasury strategy backing TON has boosted investor confidence, while Ledger Live’s integration of native TON staking has opened secure, non-custodial staking access to millions of users.
Together, these factors position TON as one of the strongest altcoins to watch this weekend. Still, invalidation rests below $3.18, and a deeper slip under $3.09 would shift the bias to neutral.
