Ethereum’s Early August Rocket Ride Crashes Into Reality as Bears Target Sub-$4,000 Plunge

Ethereum's bull run just hit a brutal wall of resistance.
The Correction Hits Hard
After an explosive start to August, ETH's momentum evaporated faster than a meme coin's utility. Bears now circle, hungry to drag prices below the psychological fortress at $4,000. That key level isn't just a number—it's a battleground where sentiment shifts and weak hands get shaken out.
Market Mechanics Exposed
Traders who chased the green got a harsh lesson in crypto volatility. No fundamental news triggered the pullback—just pure, cold market mechanics doing what they do best. Leverage flushes, stop-losses cascade, and suddenly everyone remembers that what goes up must come down. Classic finance pros would call it a 'healthy correction' while quietly shorting it.
Where's the Bottom?
All eyes lock on whether $4,000 holds or folds. A break below could signal deeper losses ahead, no matter what the permabulls tweet. Remember—in crypto, gravity always wins eventually. Even the most ardent HODLers sweat when their portfolio bleeds out, proving once again that digital gold still shines less brightly when Wall Street wants a dip.
ETH Faces Heavy Sell Pressure
ETH’s price has been weighed down by the bearish tilt in sentiment among its derivatives traders. This is reflected by its taker-buy/sell ratio, which has mostly remained under one since the beginning of August.
At press time, this stands at 0.92 per CryptoQuant, indicating that sell orders dominate buy orders across the ETH futures market.
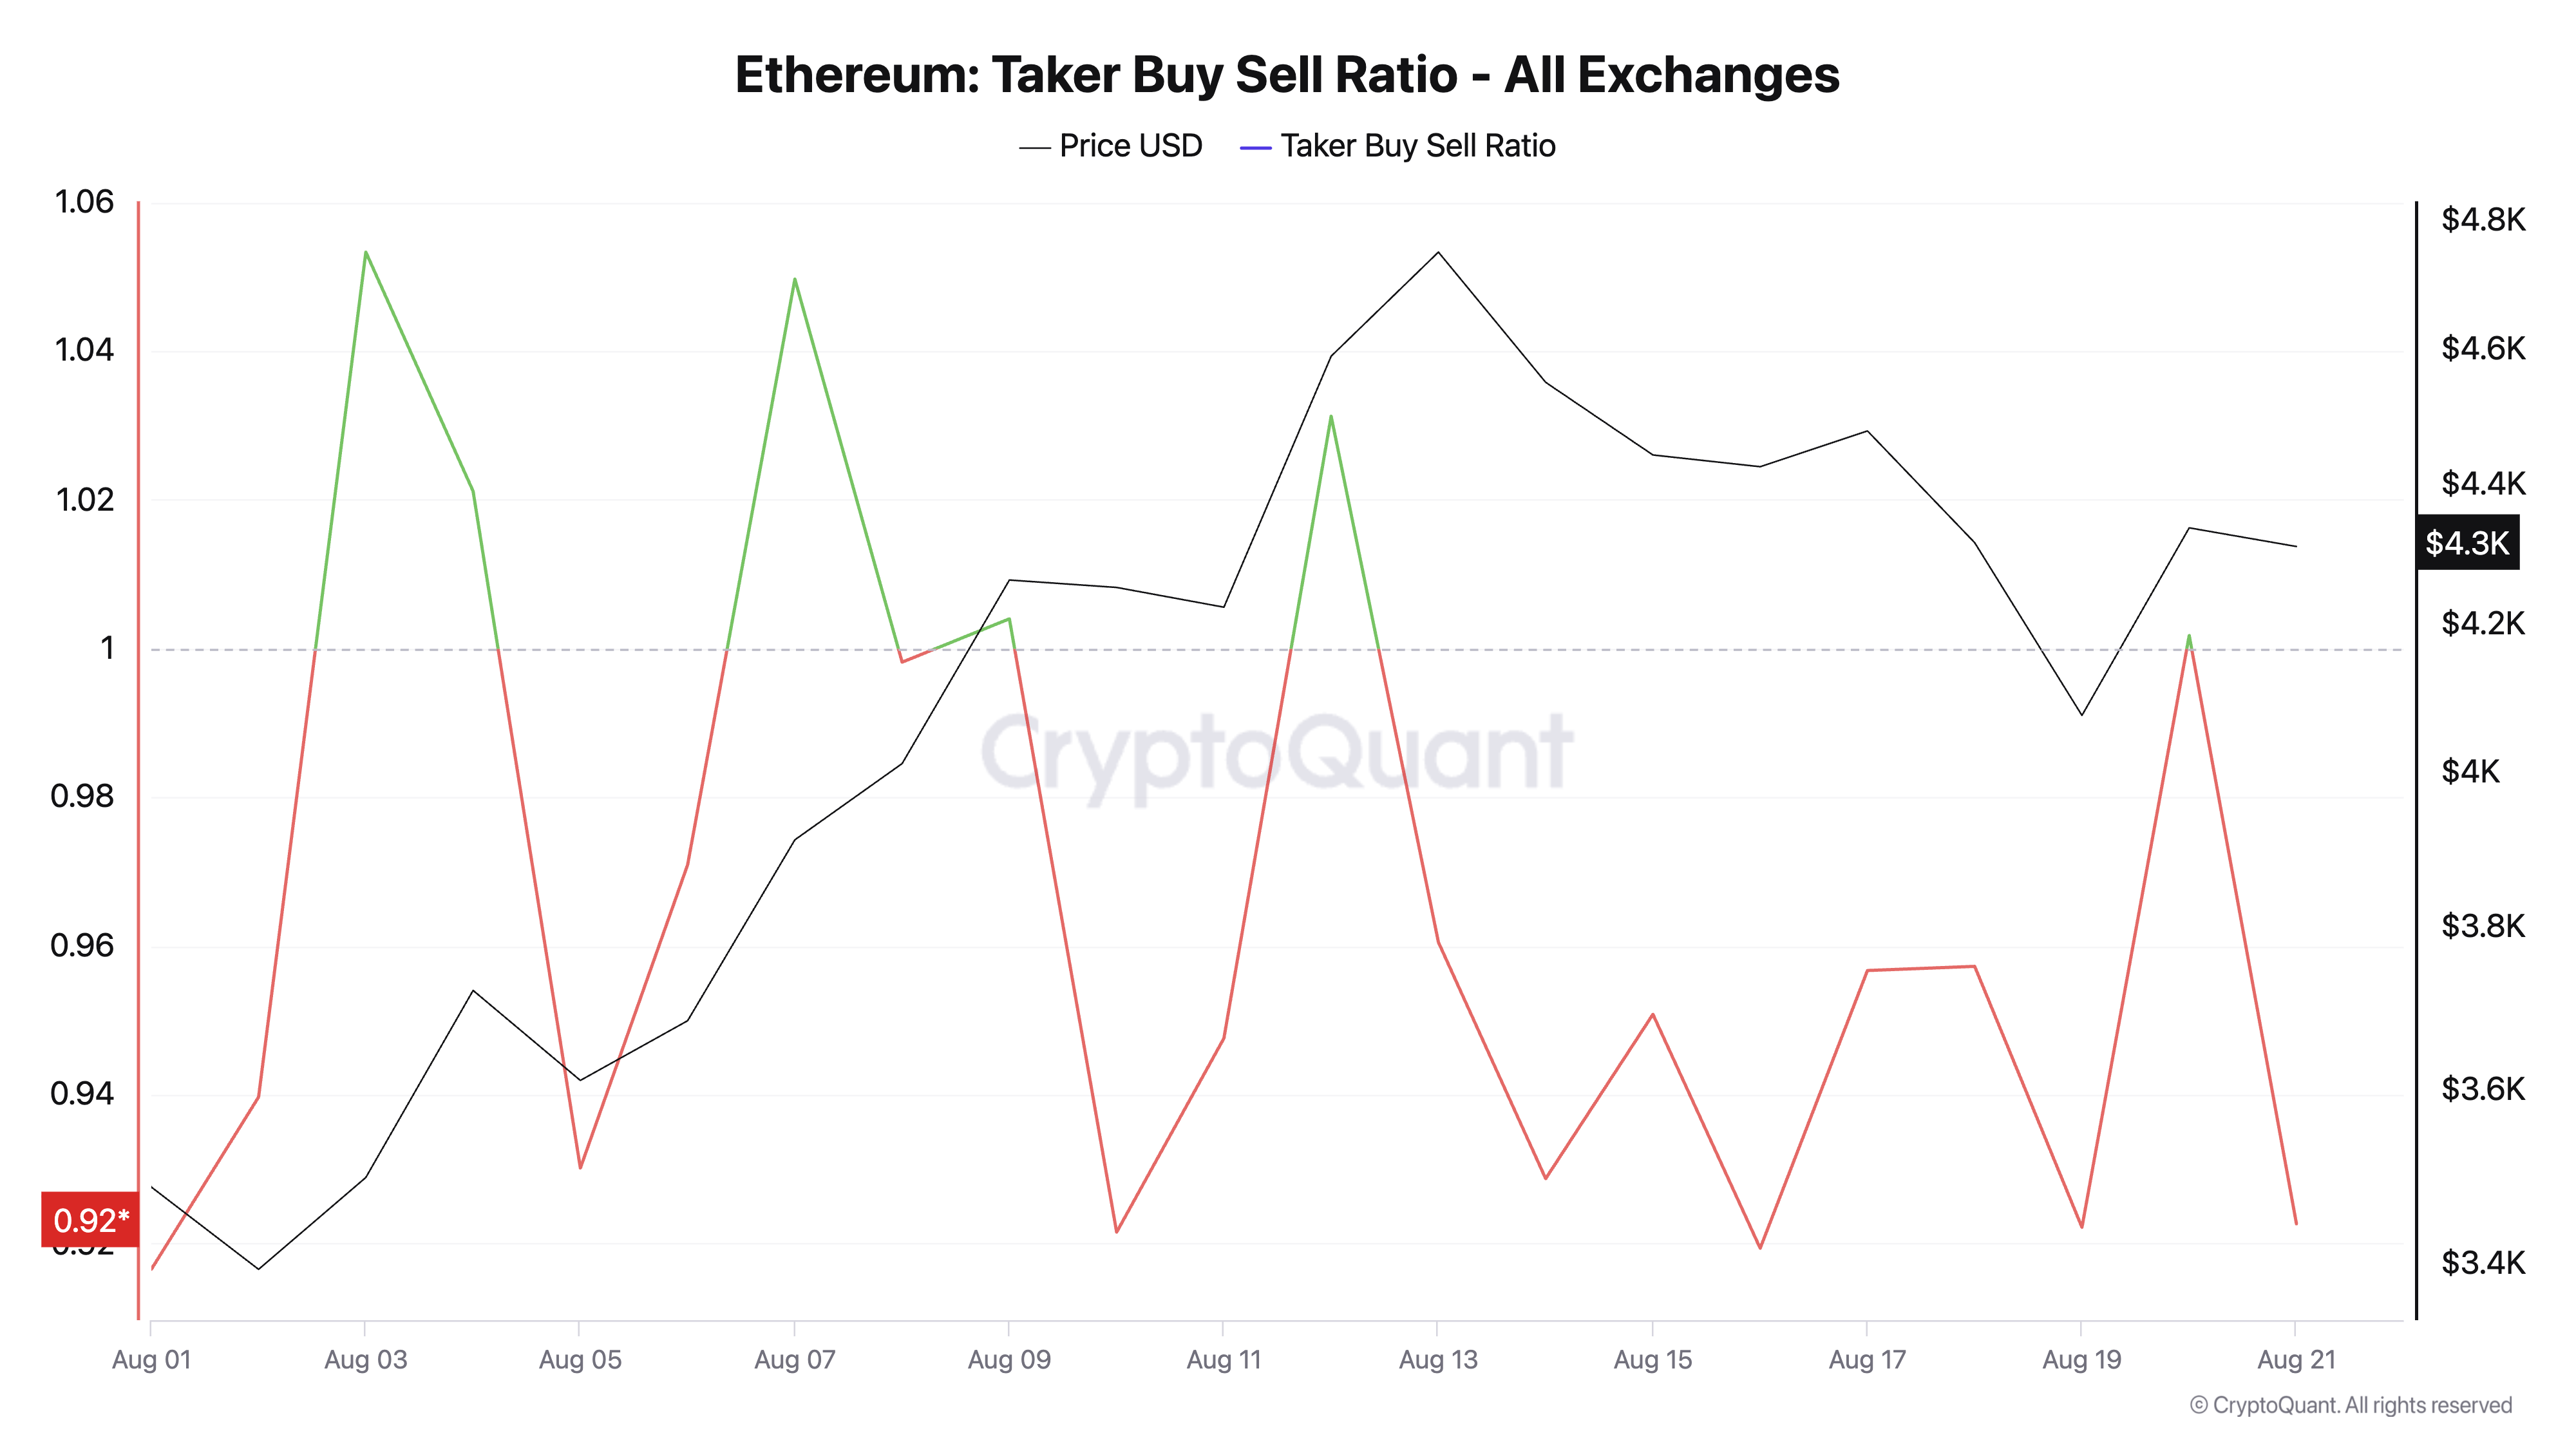
The taker buy-sell ratio measures the balance between buy and sell orders in an asset’s futures market. A ratio above one indicates stronger buying pressure, showing traders are actively chasing price gains. On the other hand, a value below one reflects dominant selling pressure, often linked to profit-taking or bearish sentiment.
Since August began, ETH’s taker buy/sell ratio has stayed mostly below one, confirming persistent sell-offs among futures traders.
For context, the coin’s performance had been largely muted for much of the year, so when an uptrend finally began in July and extended into early August, many traders seized the opportunity to lock in profits.
This mounting sell-side pressure confirms the weakening bullish sentiment and could worsen ETH’s price fall if it continues.
Traders Ditch High-Risk Bets Amid Price Pressure
The recent decline in ETH’s Estimated Leverage Ratio (ELR) also confirms the low confidence among coin holders. According to CryptoQuant, ETH’s ELR currently sits at 0.66 — its lowest value in the past five days.
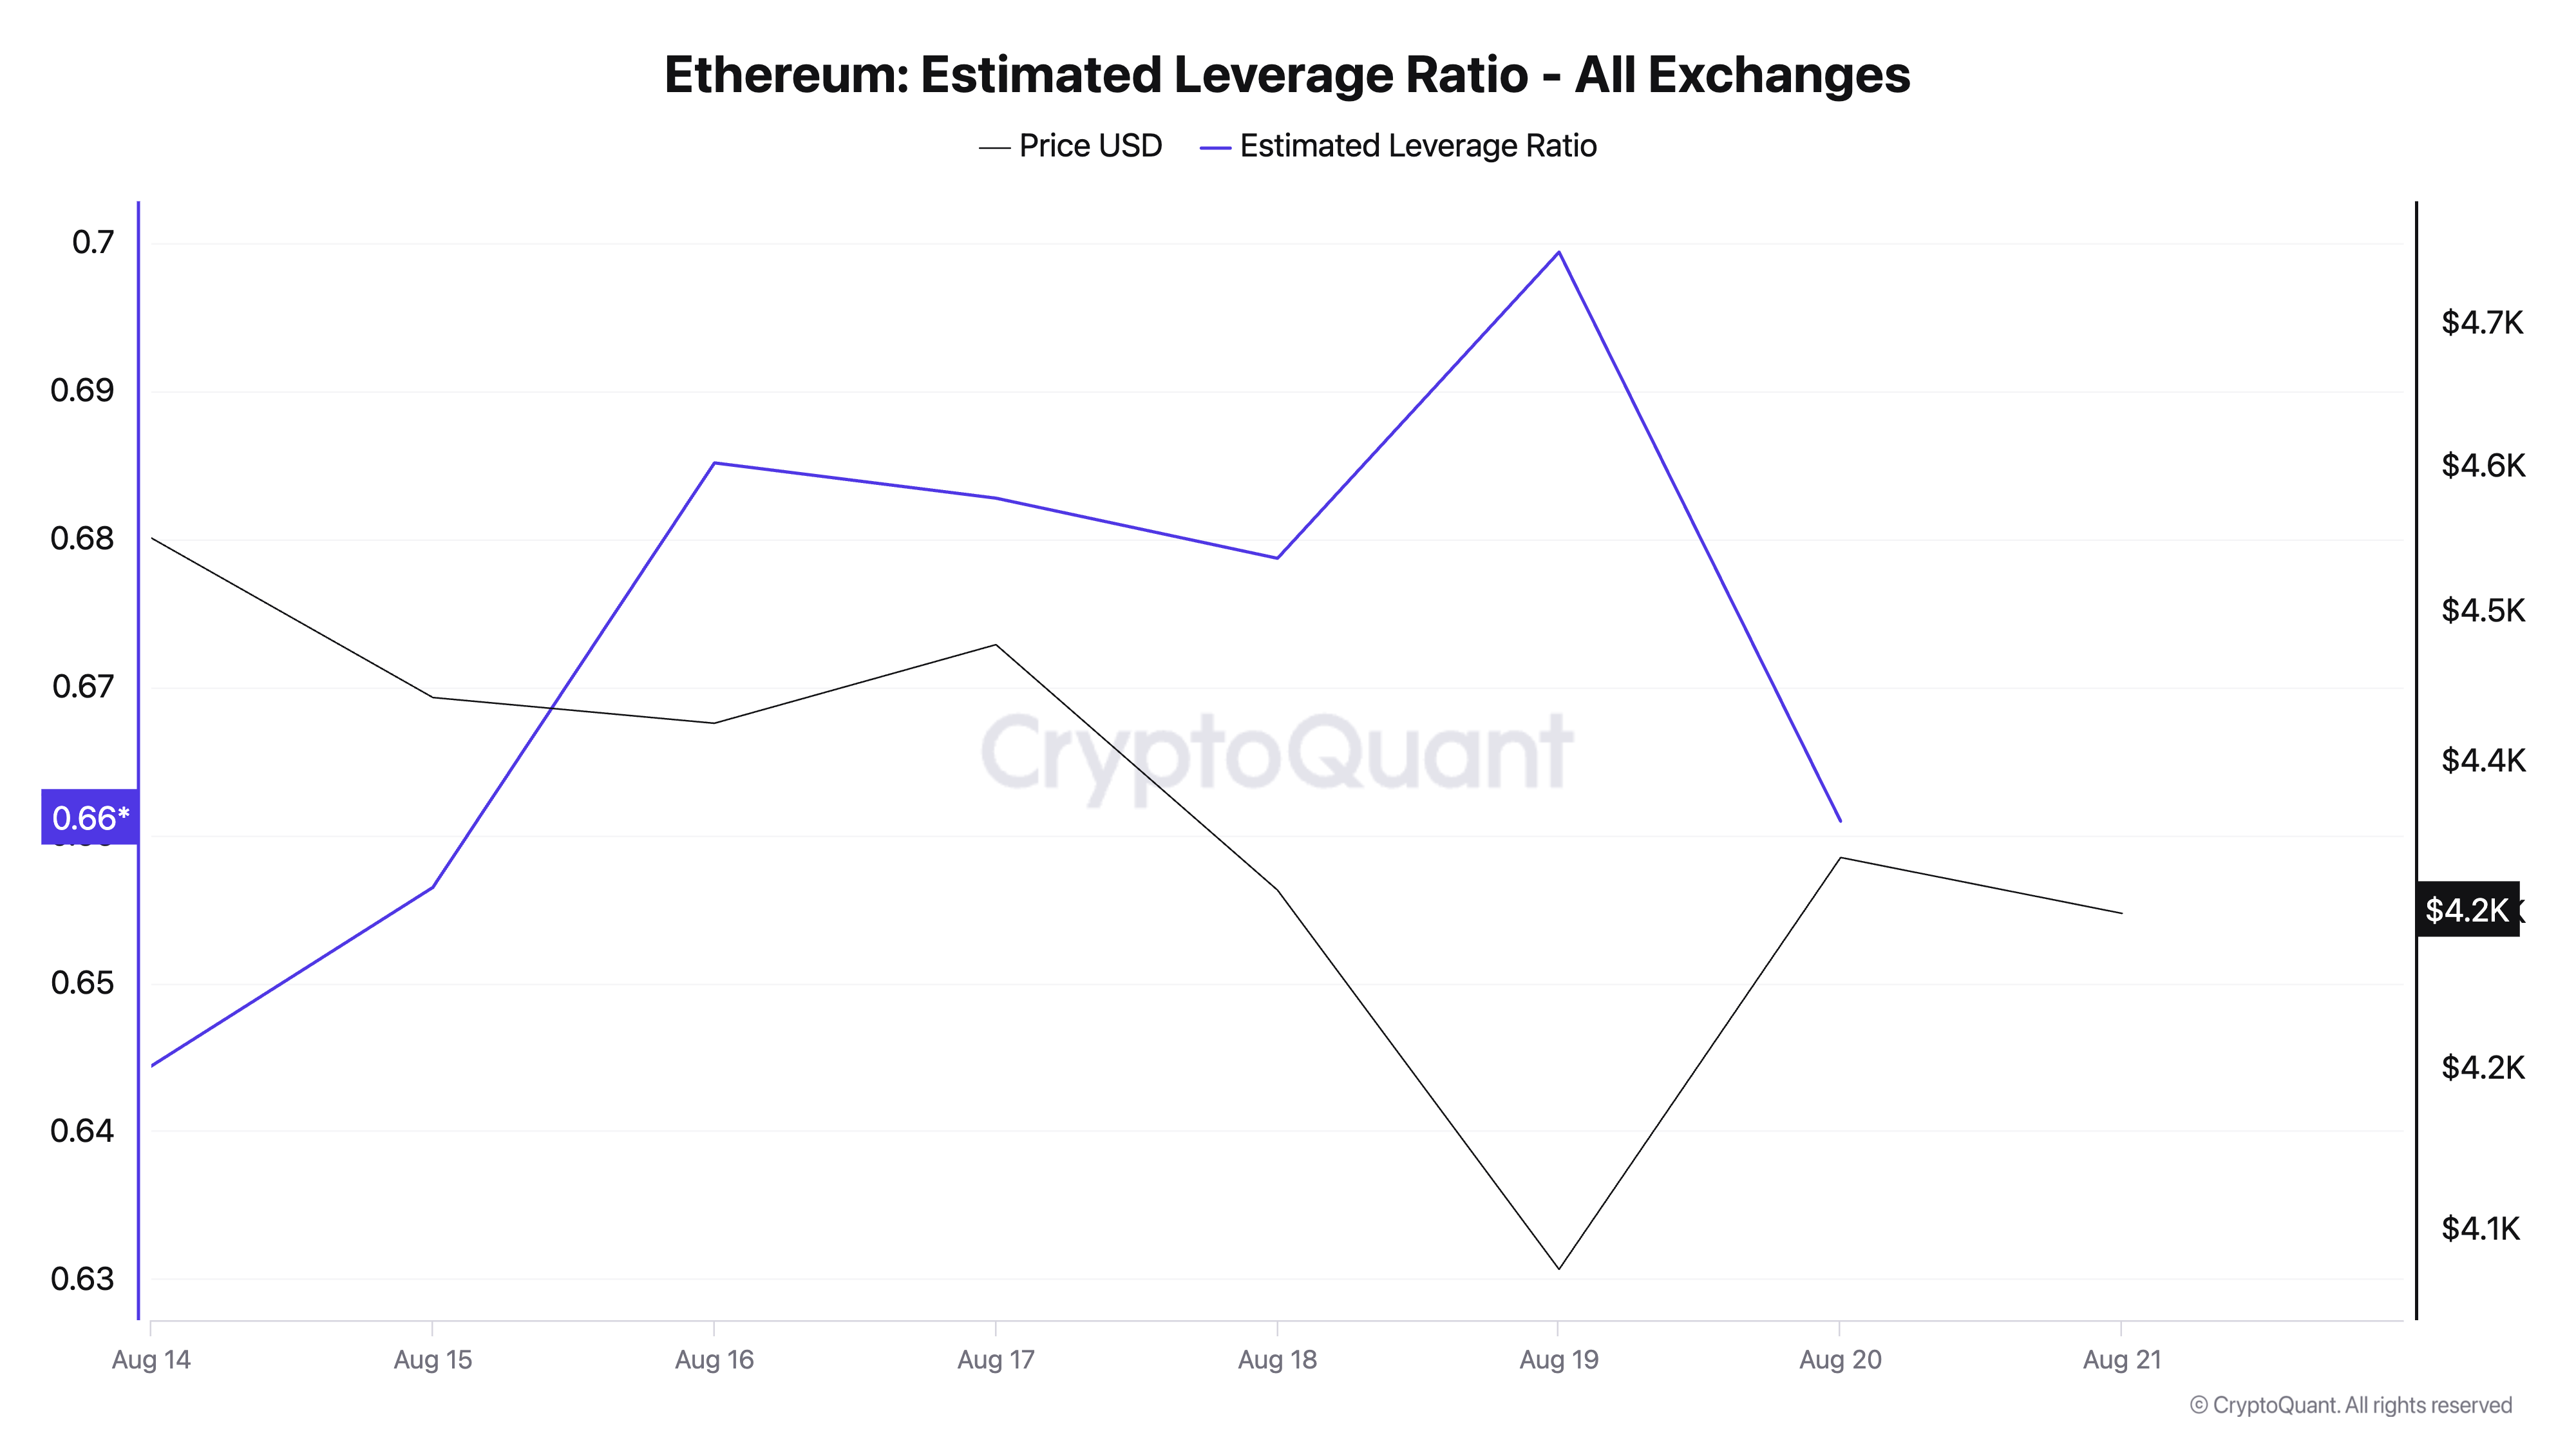
An asset’s ELR measures the average leverage its traders use to execute trades on a cryptocurrency exchange. It is calculated by dividing the asset’s open interest by the exchange’s reserve for that currency.
When an asset’s ELR falls, it indicates a reduced risk appetite among traders. This trend signals that ETH investors have grown increasingly cautious this week and are now avoiding high-leverage positions that could worsen potential losses.
Which Comes First: $3,491 or $4,793?
As of this writing, ETH trades at $4,295. If sell-side pressure strengthens, the altcoin could retest the support floor at $4,063. Should this key price mark give way, ETH could plunge to $3,491.
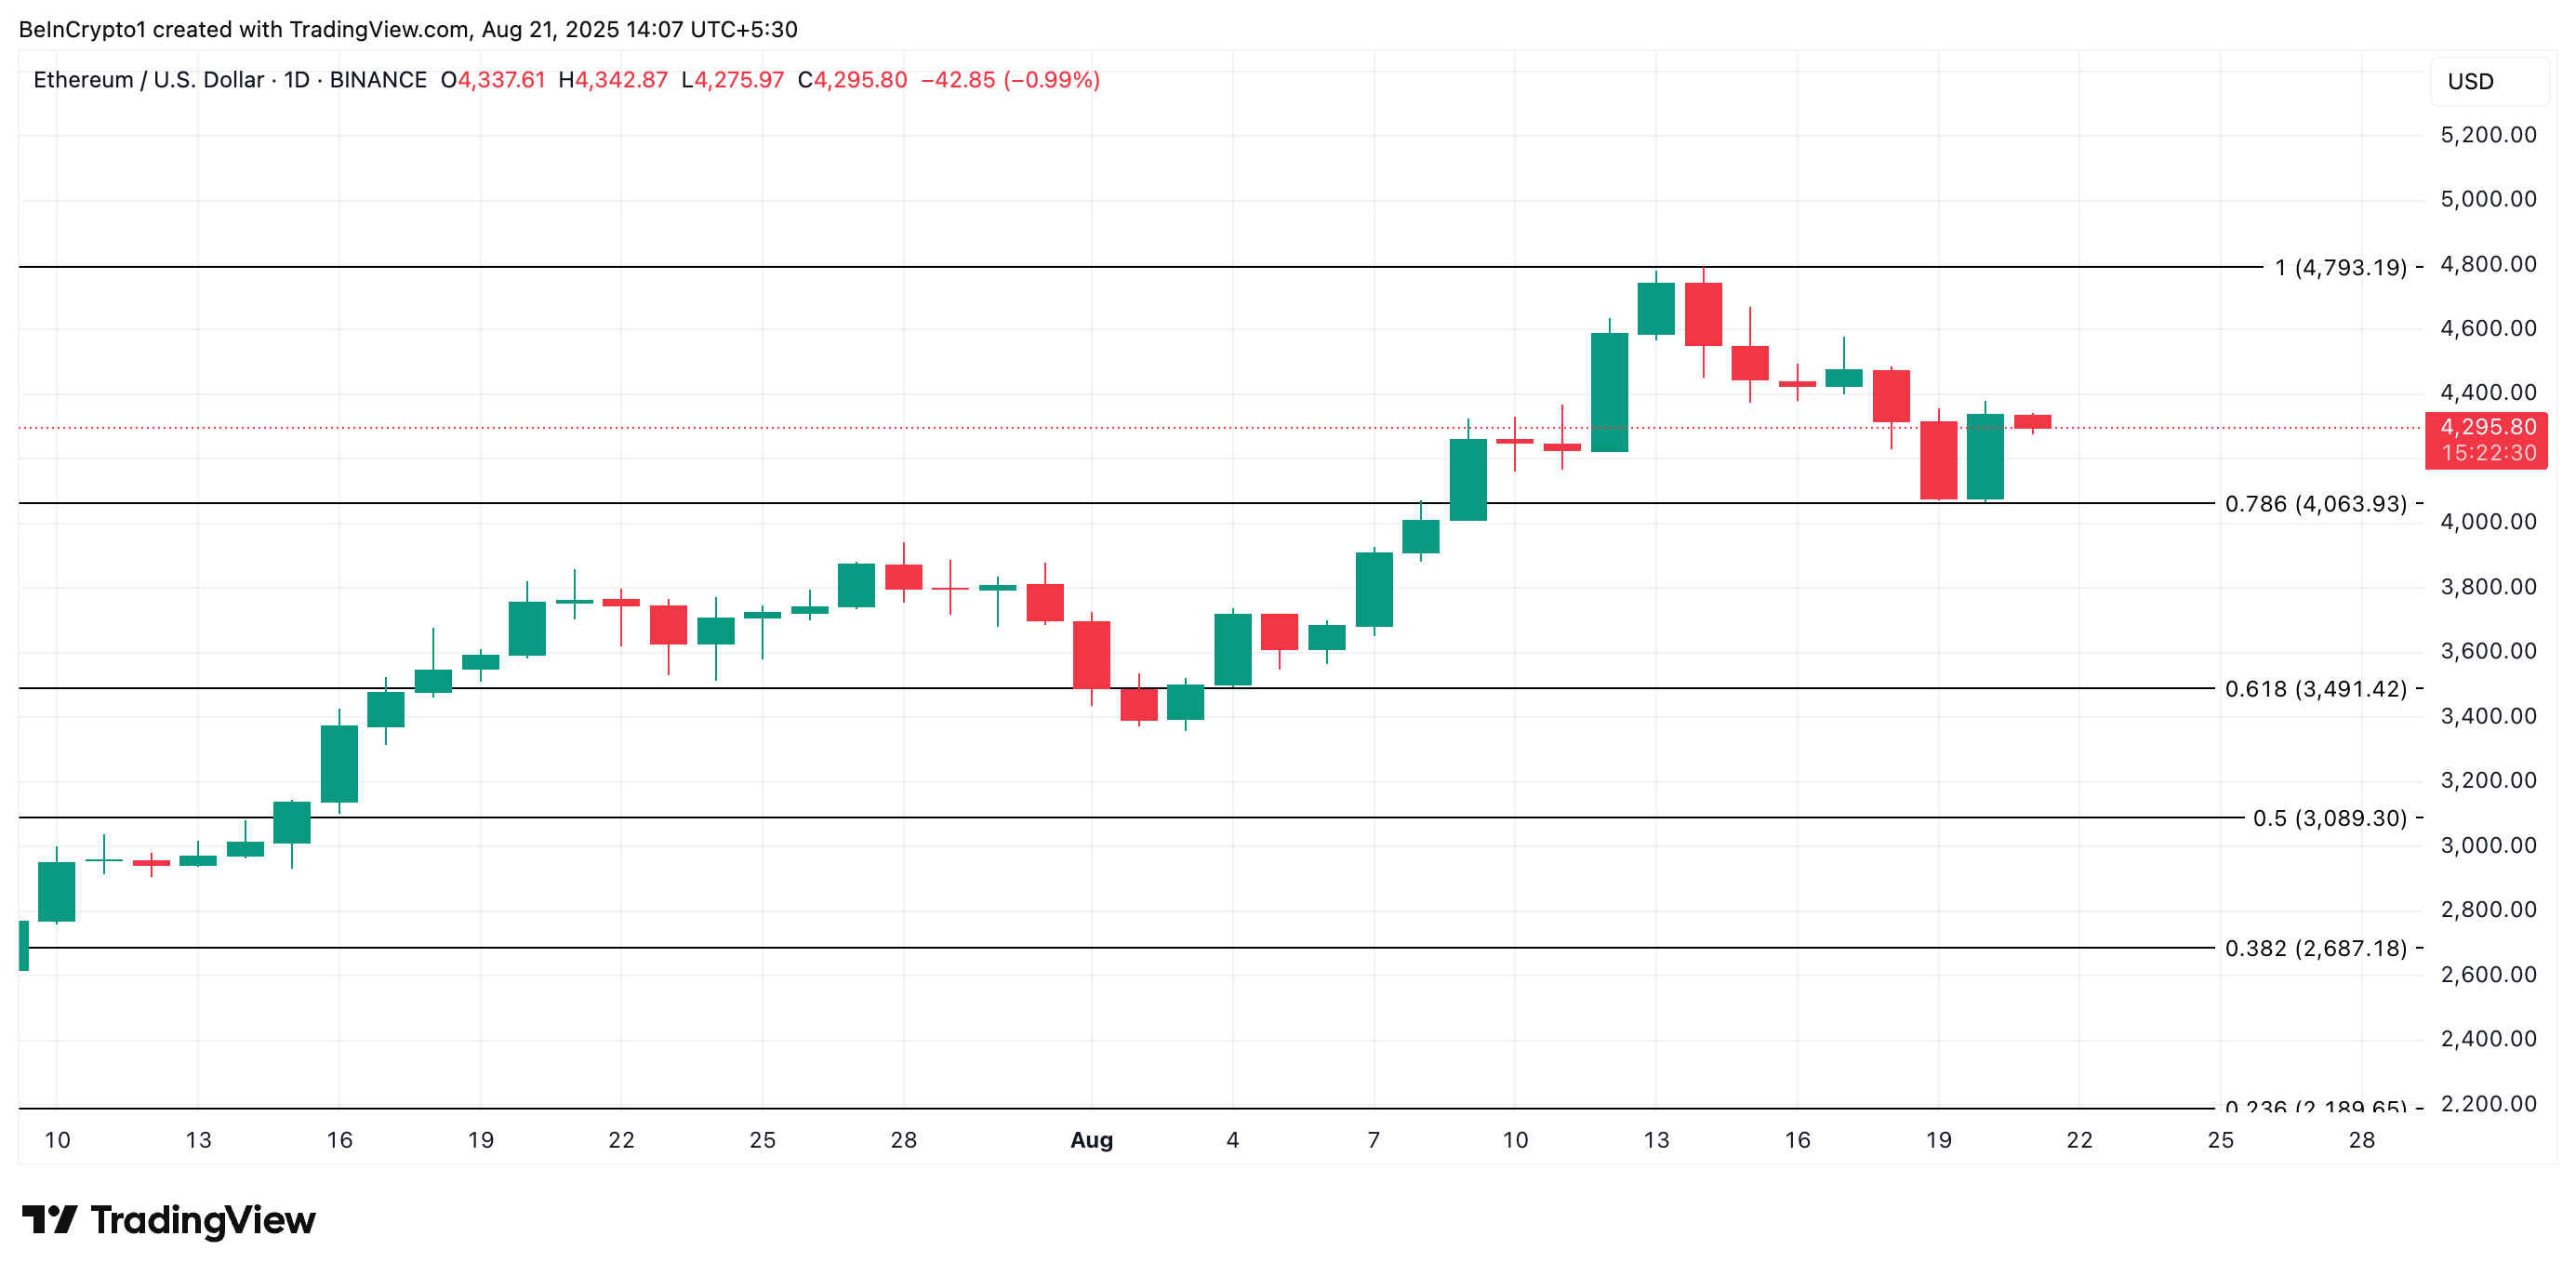
Conversely, ETH could see a rebound and rally to $4,793 if new demand enters the market.
