API3 Price Rally Stuck Between Bullish Buys and Bearish Bias

API3's momentum hits a wall as bulls and bears clash at critical resistance.
Oracle token faces make-or-break moment amid conflicting market signals.
Traders pile into long positions while institutional money stays sidelined—classic crypto volatility meets traditional finance skepticism.
Technical indicators scream overbought, yet retail FOMO keeps pumping the bid.
Will real-world data adoption finally justify the hype, or is this another 'fundamentals-optional' crypto pump? Sometimes the market's just guessing—and charging 2% fees for the privilege.
Shorts Stack Up as Funding Rate Drops
Funding rates on API3 flipped deeply negative over the past 24 hours. On August 19, the OI-weighted funding rate stood at -0.47%. By August 20, it plunged further to -1.10%. That means most traders are now paying to hold short positions, betting heavily on a price drop.
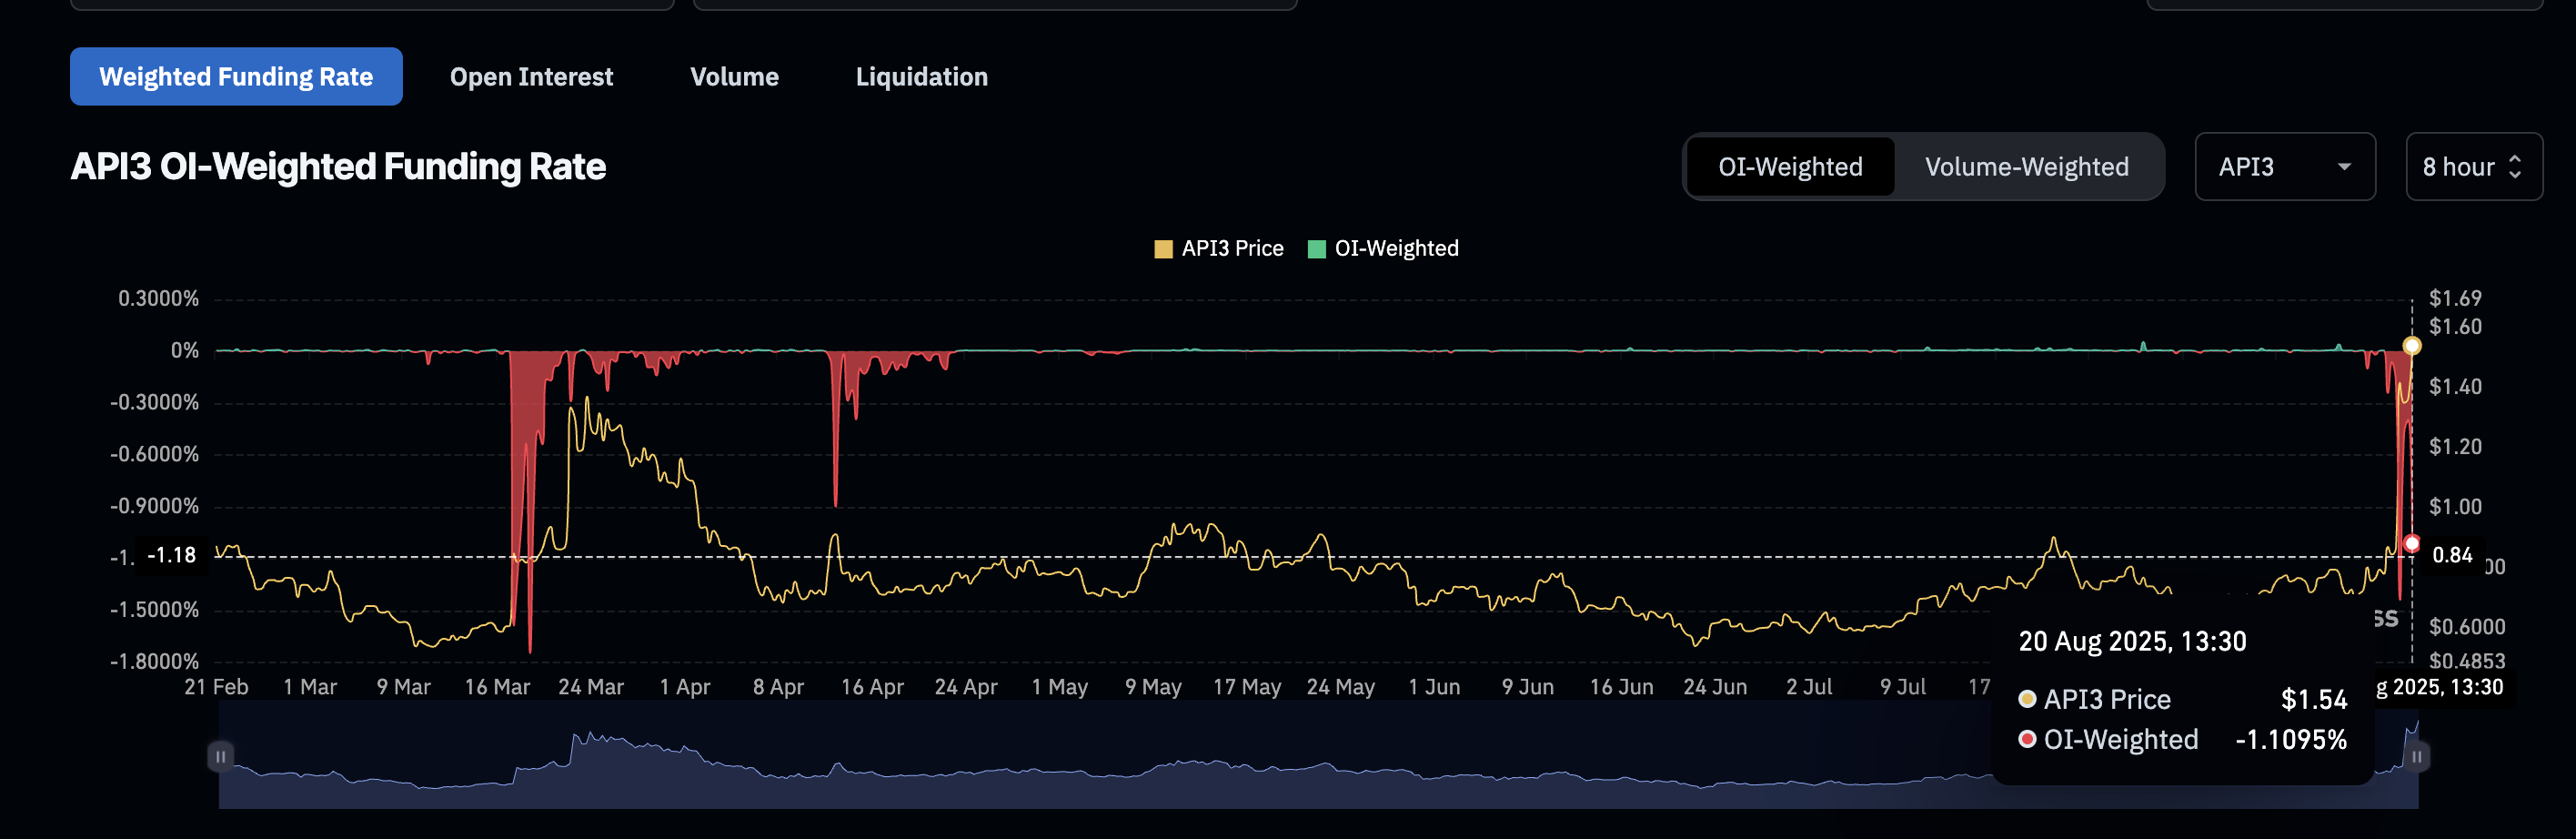
This shows aggressive short-side sentiment. Yet, the API3 price hasn’t collapsed. It dipped slightly from the peak, but API3 bulls haven’t fully backed off. So despite bearish bets piling up, sellers haven’t taken control at press time.
: Want more token insights like this? Sign up for Editor Harsh Notariya’s Daily crypto Newsletter here.
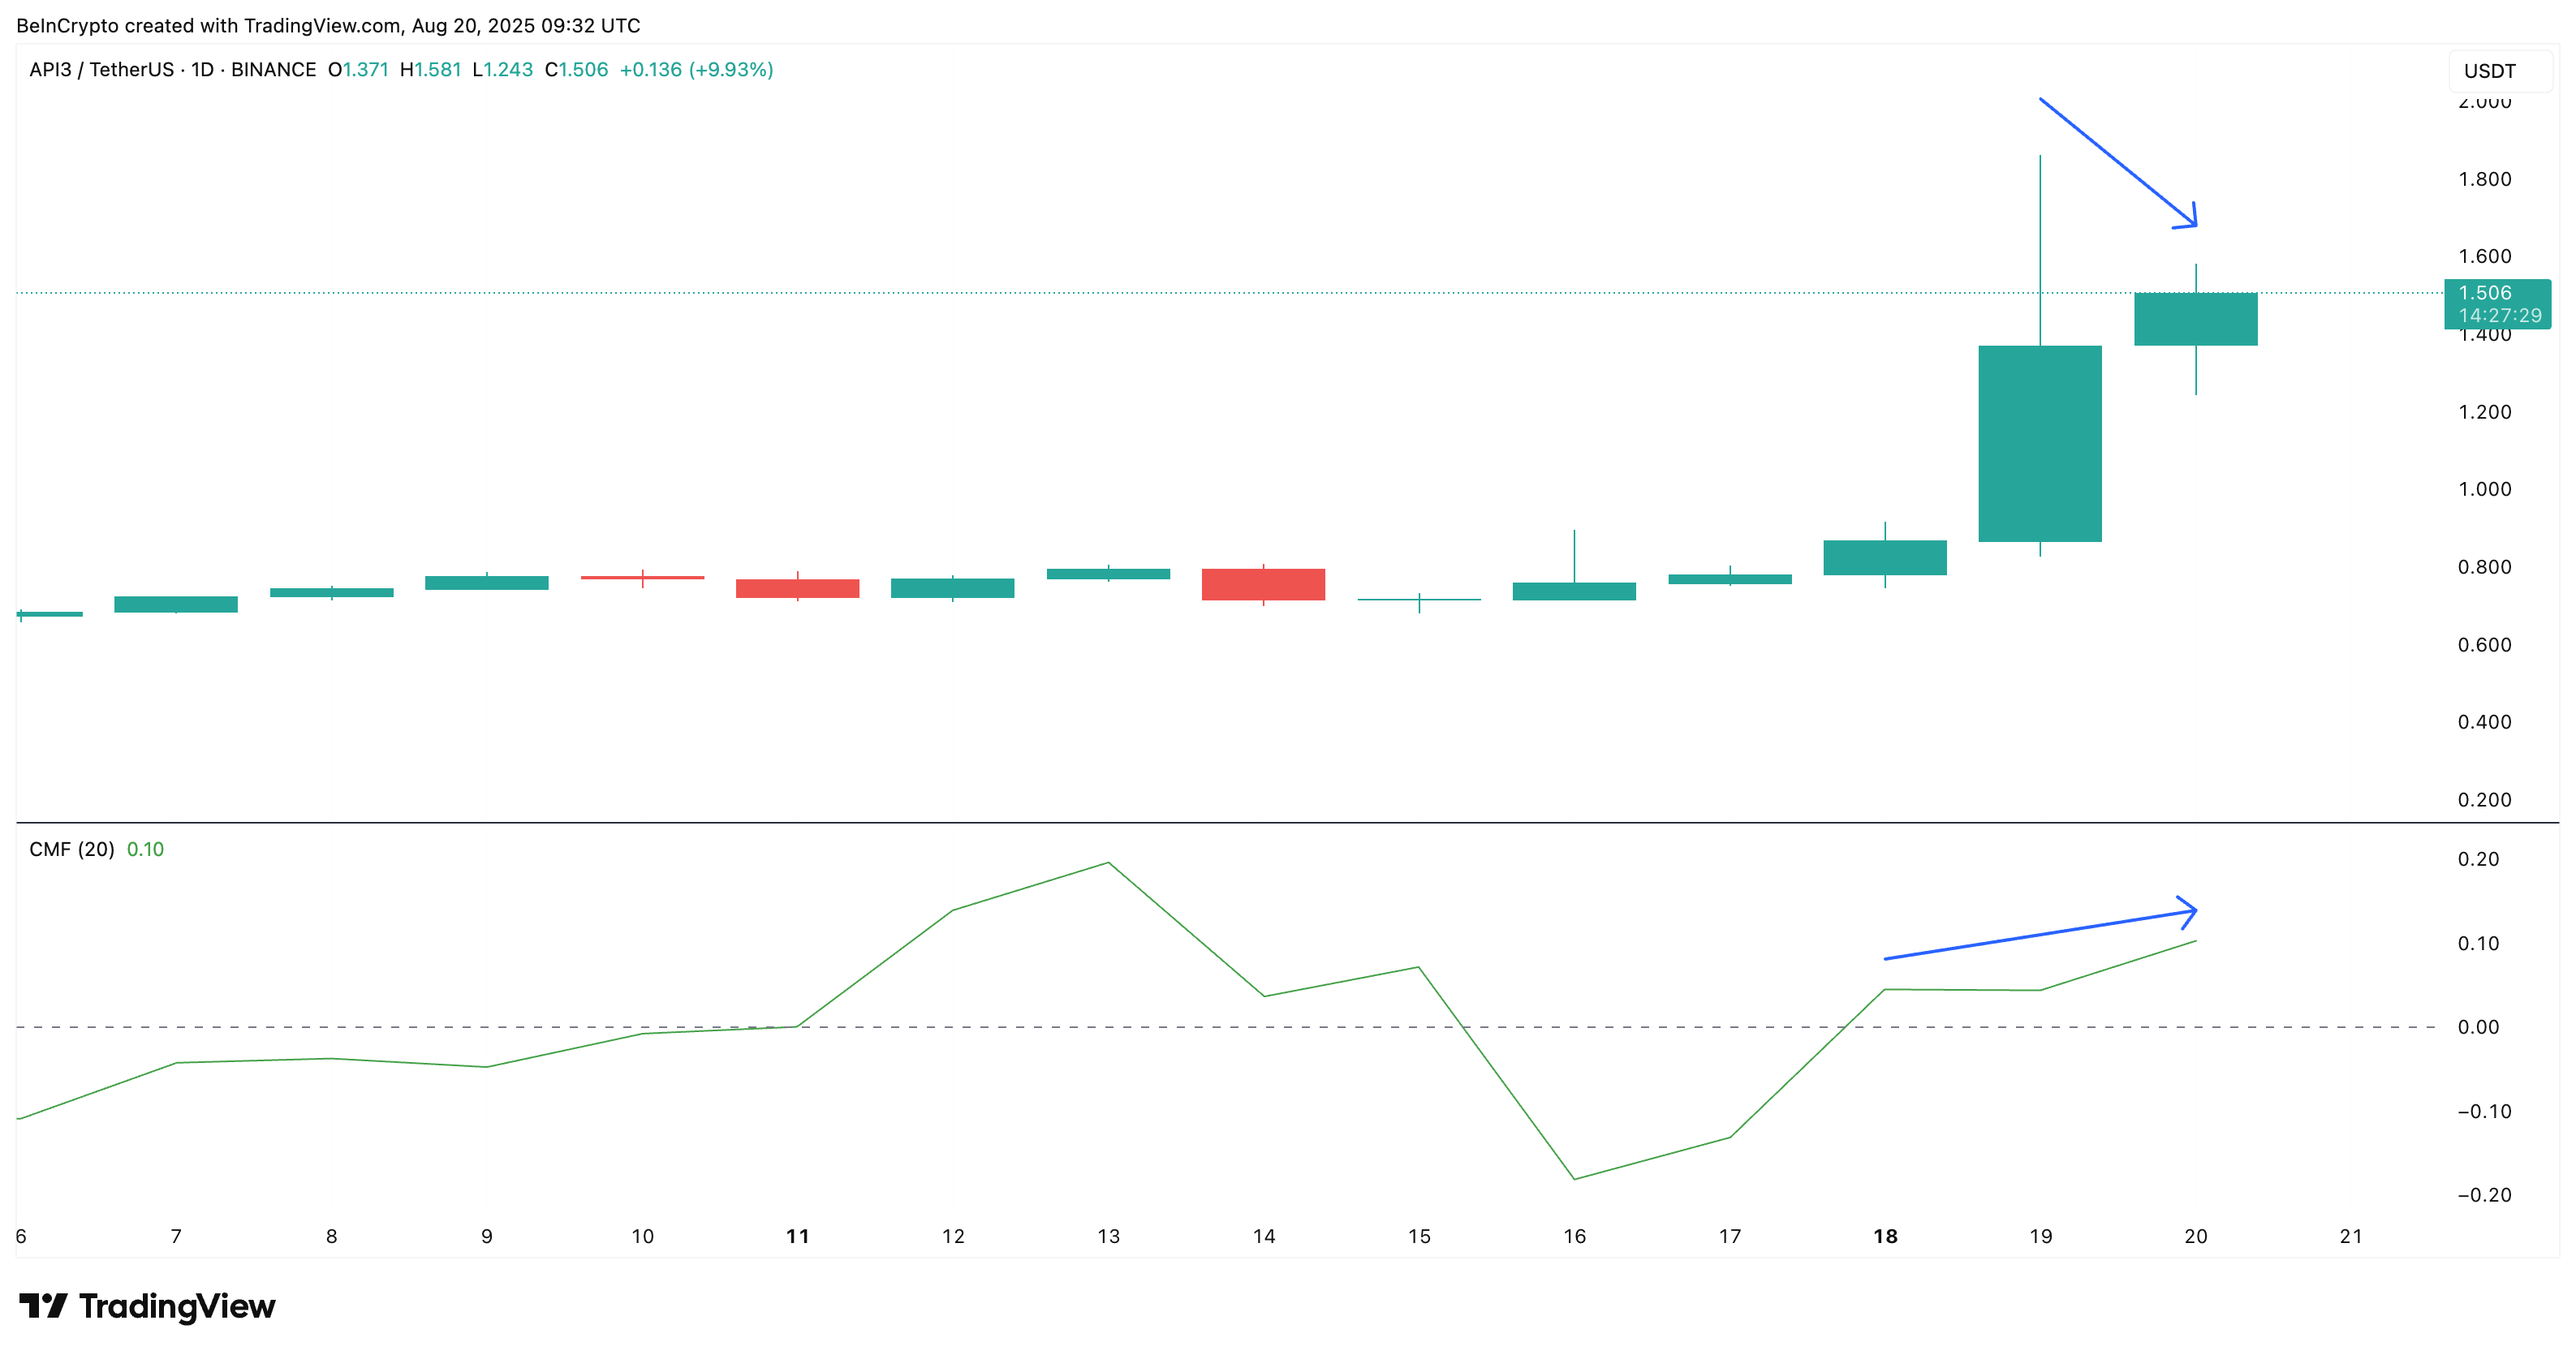
Smart Money Buys While CMF and Exchange Data Stay Bullish
Under the hood, buyers are still stepping in. The Chaikin Money FLOW (CMF) on the daily chart has climbed steadily from 0.04 to 0.10 over the last few hours, even while the API3 price cooled down slightly. CMF increasing despite a small price pullback suggests accumulation: more capital is flowing in than out.
CMF is a volume-weighted indicator that shows if money is flowing into or out of a token based on price and volume.
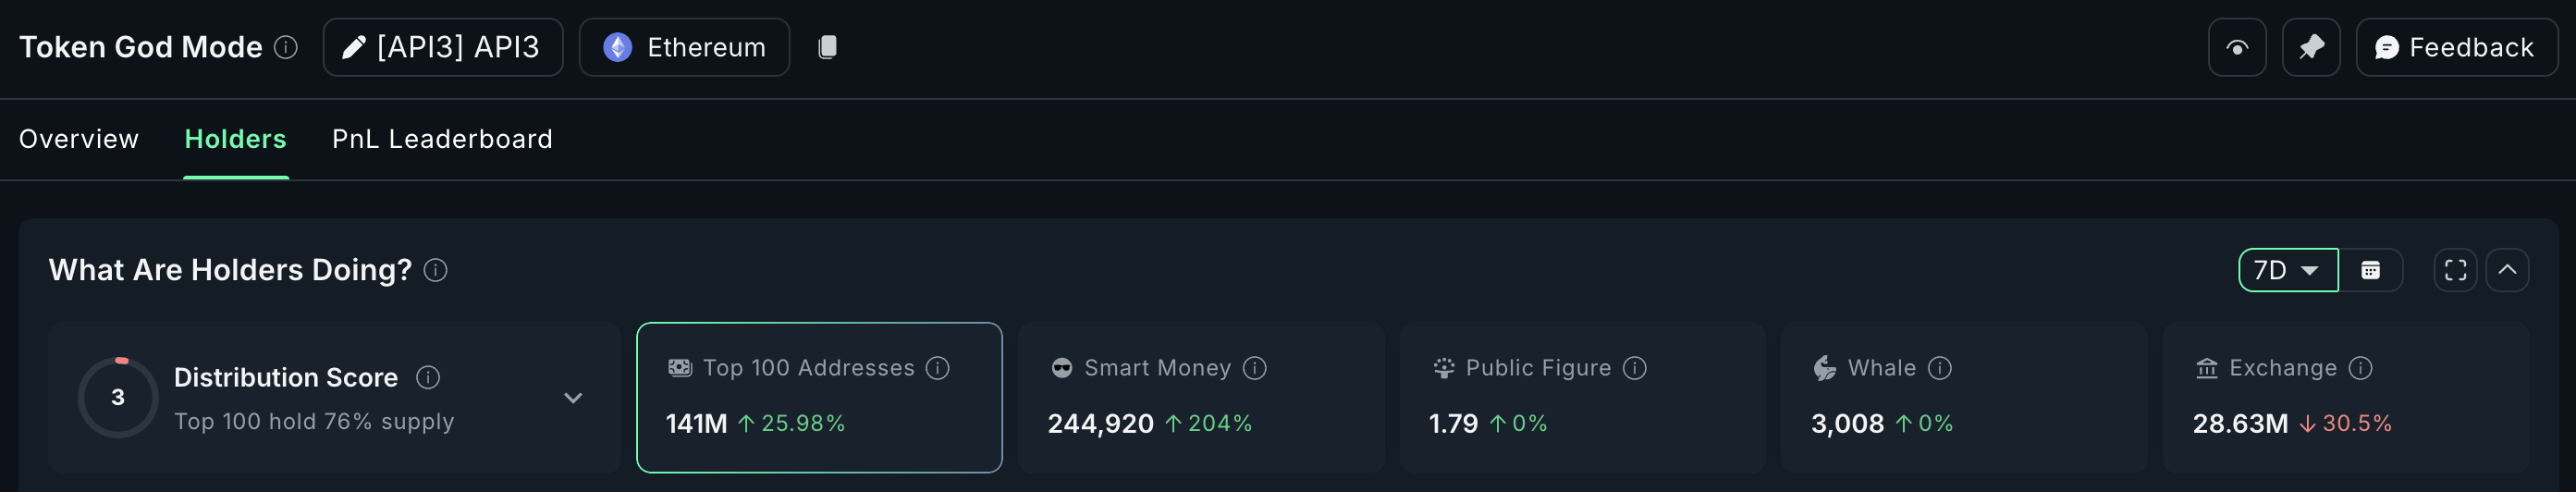
Exchange reserves confirm this. Over the past 7 days (during the rally), API3’s exchange balances fell 30.5%, now sitting at 28.63 million tokens.
At the same time, the top 100 addresses increased holdings by 25.98%, while Smart Money wallets jumped 204%.
API3 Price Chart Shows Bullish Bias
On the 4-hour chart, API3 is still showing bullish momentum. The price bounced off the 0.236 Fibonacci level NEAR $1.49, and the Bull-Bear Power (BBP) index remains positive at 0.464.
This suggests bulls aren’t done, and if buying continues, the short-heavy crowd or the bearish bets could get liquidated fast. That WOULD push the prices higher, with the immediate targets sitting at $1.64 and $1.77.
As the bullish momentum seems to be picking up, with rising green bars, an API3 price rally continuation looks more likely. The BBP indicator measures the strength of bulls vs. bears by comparing highs and lows with a moving average.
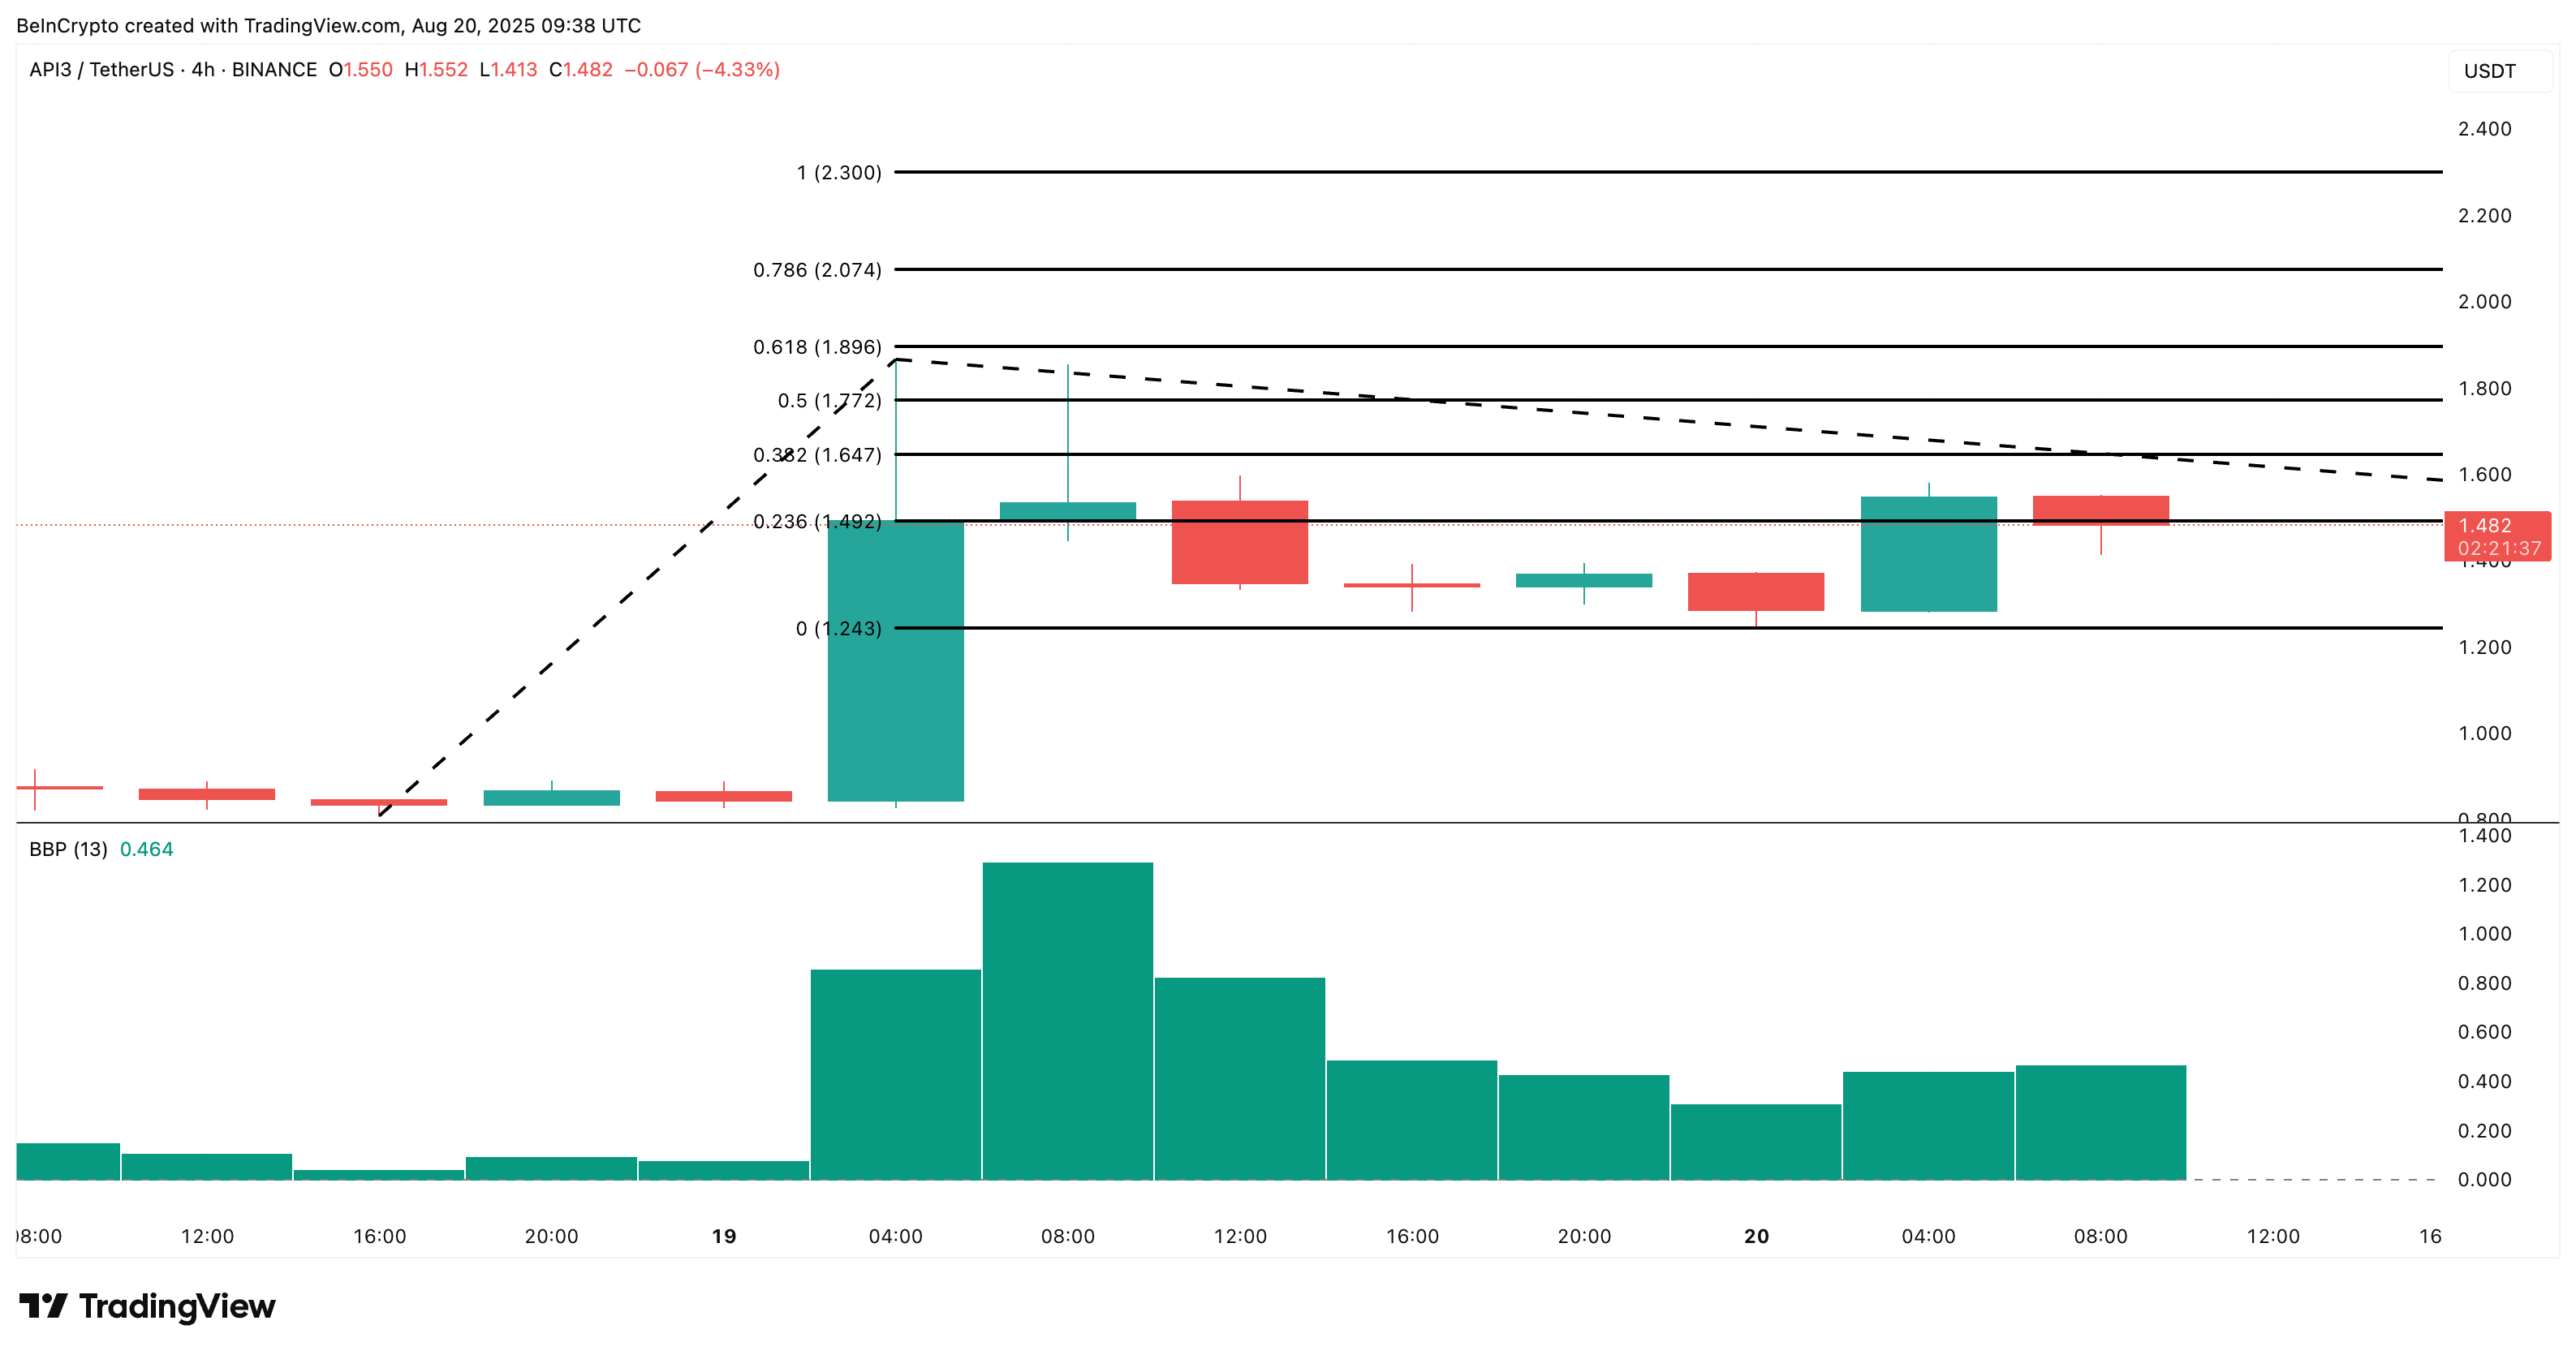
But if price breaks lower than $1.24 and buyers cool off, the same shorts could win the round, invalidating the bullish outlook. Longs would then be exposed, and liquidations could deepen the drop fast.
