Chainlink’s Next Move: Breaking This Key Barrier Could Send It Soaring Past $30

Chainlink bulls eye the prize—$30 or bust.
Breaking the Barrier
LINK faces one critical resistance level standing between current prices and a run toward that coveted $30+ target. The oracle network's token needs to slice through this technical ceiling—no 'enabling,' just pure momentum.
Market Mechanics at Play
Traders watch for a clean breakout. No fuzzy math, just price action. A successful breach could trigger a cascade of buying, pushing LINK into uncharted territory for this cycle.
Finance's Ironic Twist
Meanwhile, traditional asset managers still debate whether 'digital gold' is a real thing—right before they quietly add another crypto ETF to their portfolios. Classic.
Watch the charts. Watch the volume. If LINK clears this hurdle, it's off to the races.
Exchange Reserves Are Flashing the First Signal
On-chain data shows a steady drop in chainlink exchange reserves since June 20, 2025. Back then, the reserves stood at 172.23 million LINK. As of August 19, they’ve dropped to 162.45 million LINK, marking a 5.67% decline.
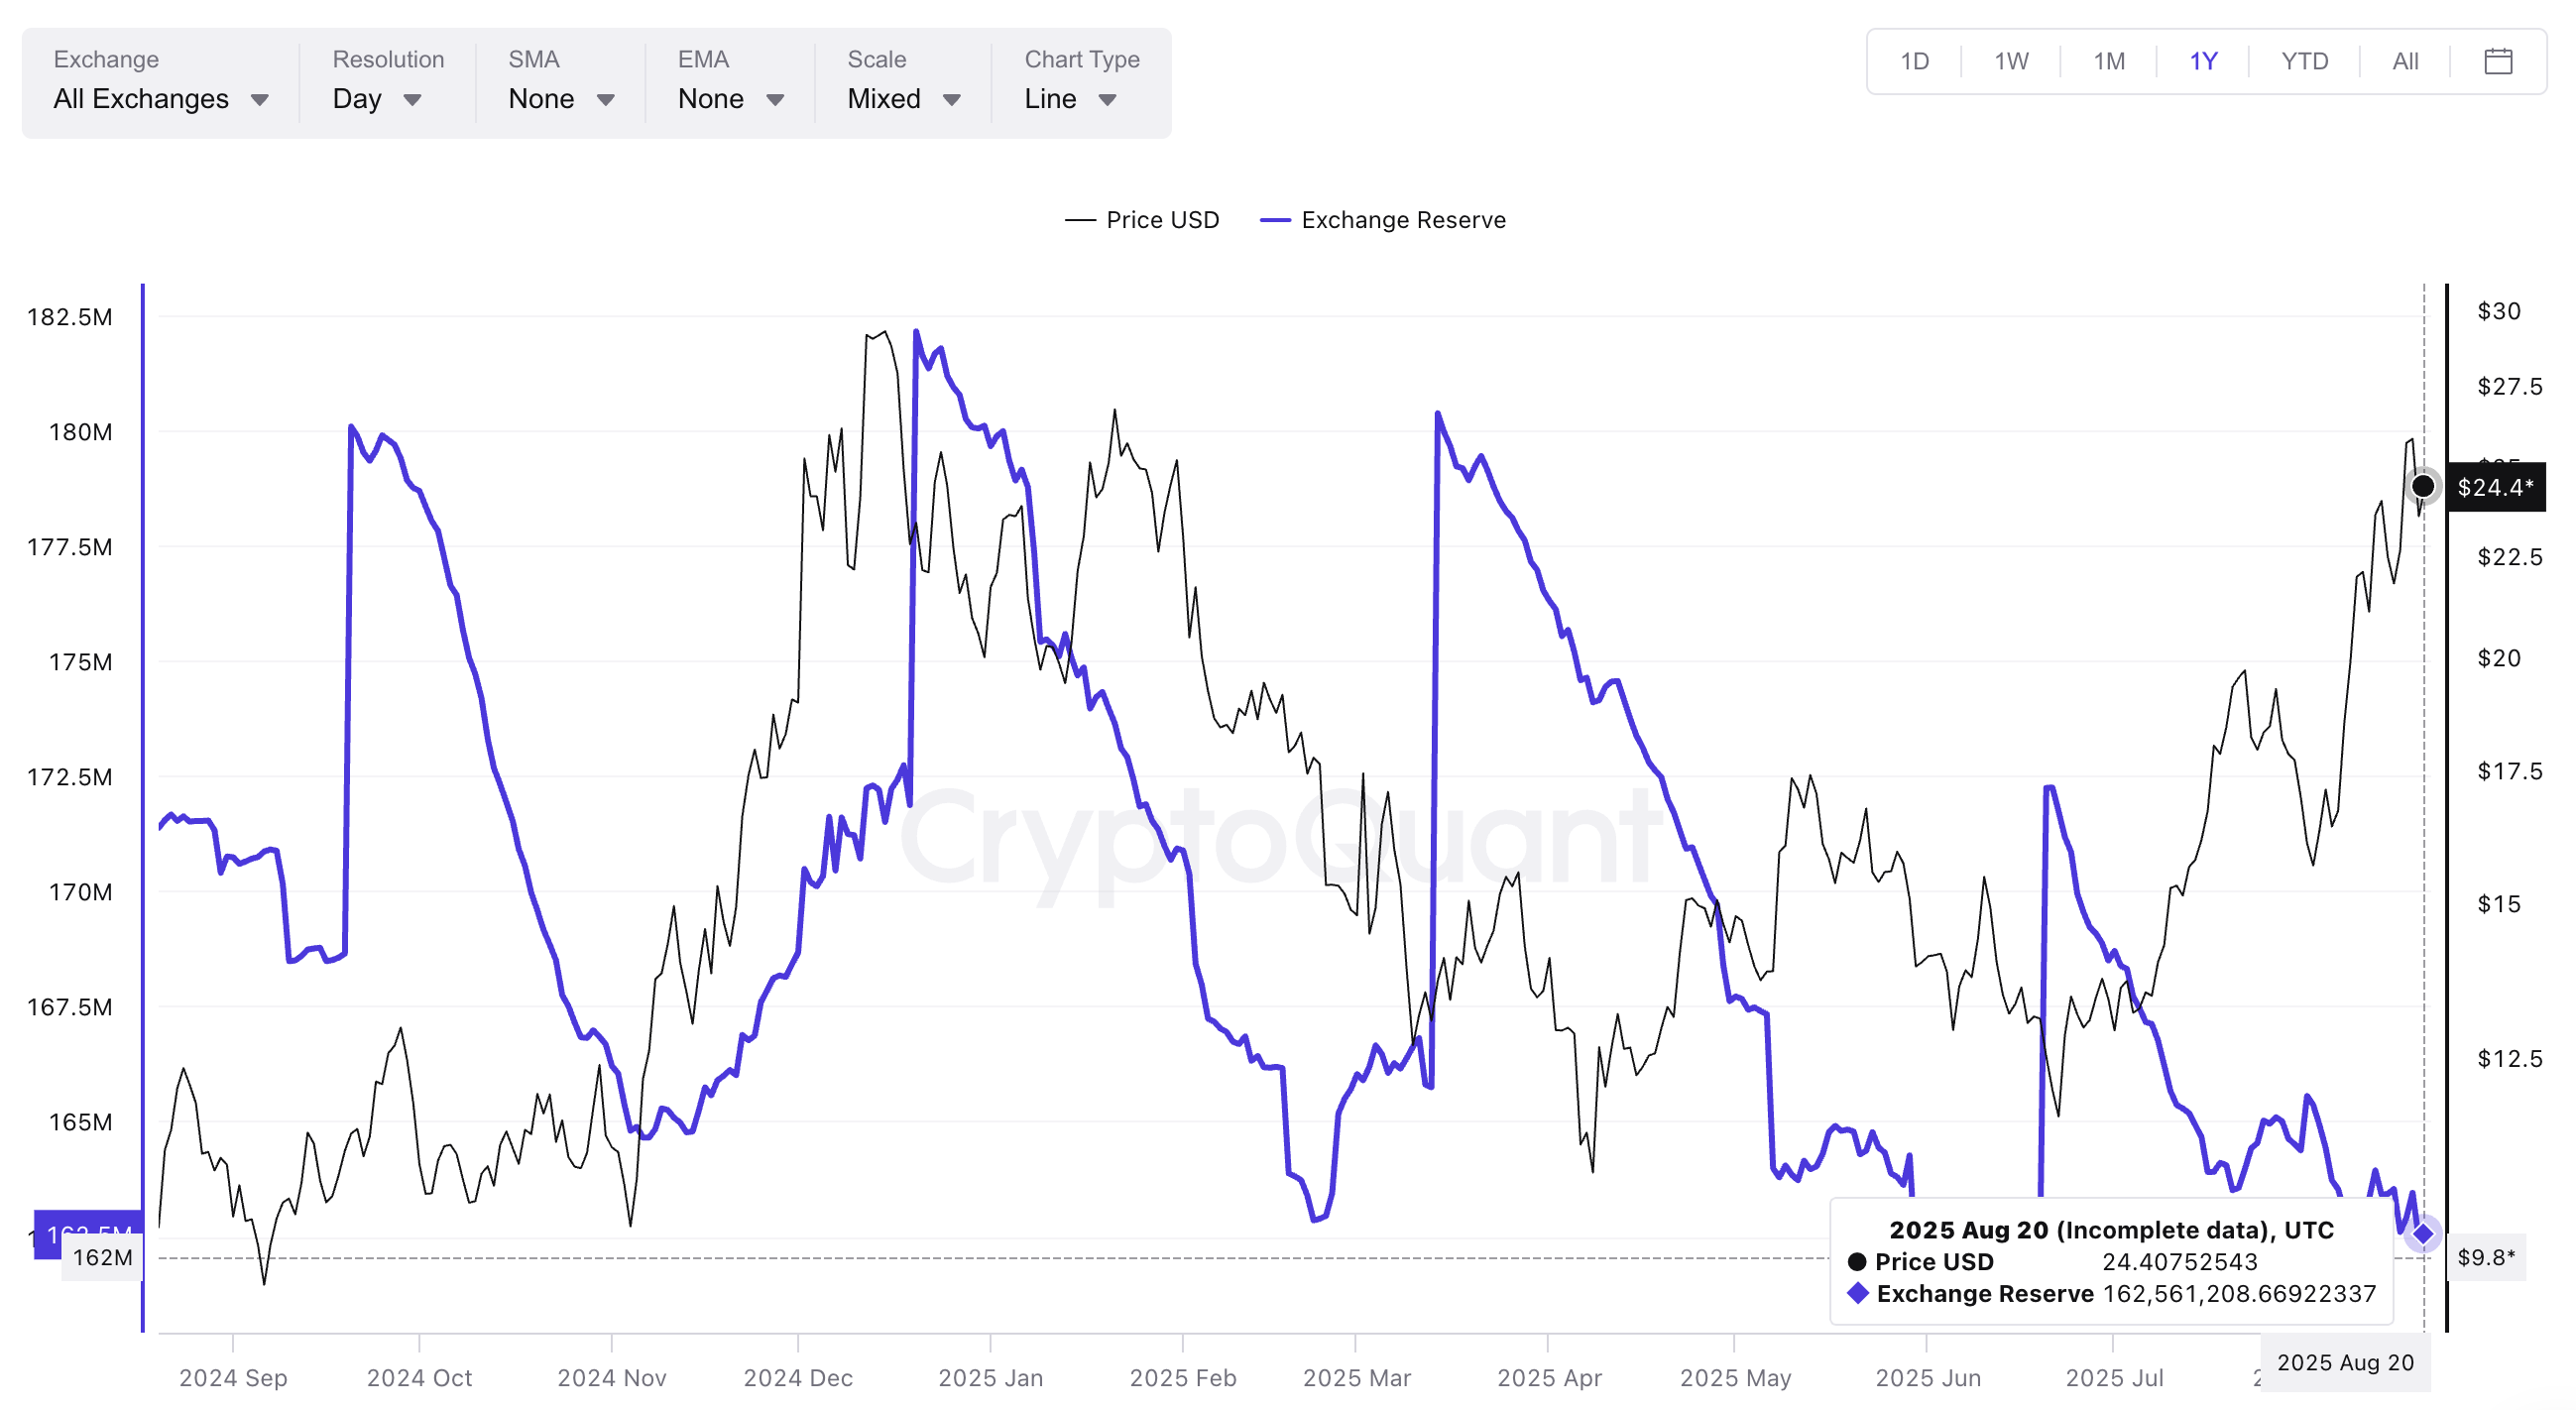
This matters because in previous cycles, local lows in exchange reserves have preceded major price rallies:
- November 13, 2024: Reserves bottomed, and LINK rose from $13.49 to $29 in under a month.
- February 23, 2025: A Local low formed, and LINK jumped from $10 to $17 by April.
- June 19, 2025: Reserve bottomed, and LINK price surged from $11.65 to $25.79.
Now, reserves are nearing the yearly low of 161.44 million LINK. If they drop further, it WOULD mark a fourth consecutive local low on the yearly chart, a pattern that has triggered rallies each time.
Even with LINK trading around $24.65, reserves remain tight. That implies holders aren’t eager to sell, keeping sell pressure low and the upside potential intact.
: Want more token insights like this? Sign up for Editor Harsh Notariya’s Daily crypto Newsletter here.
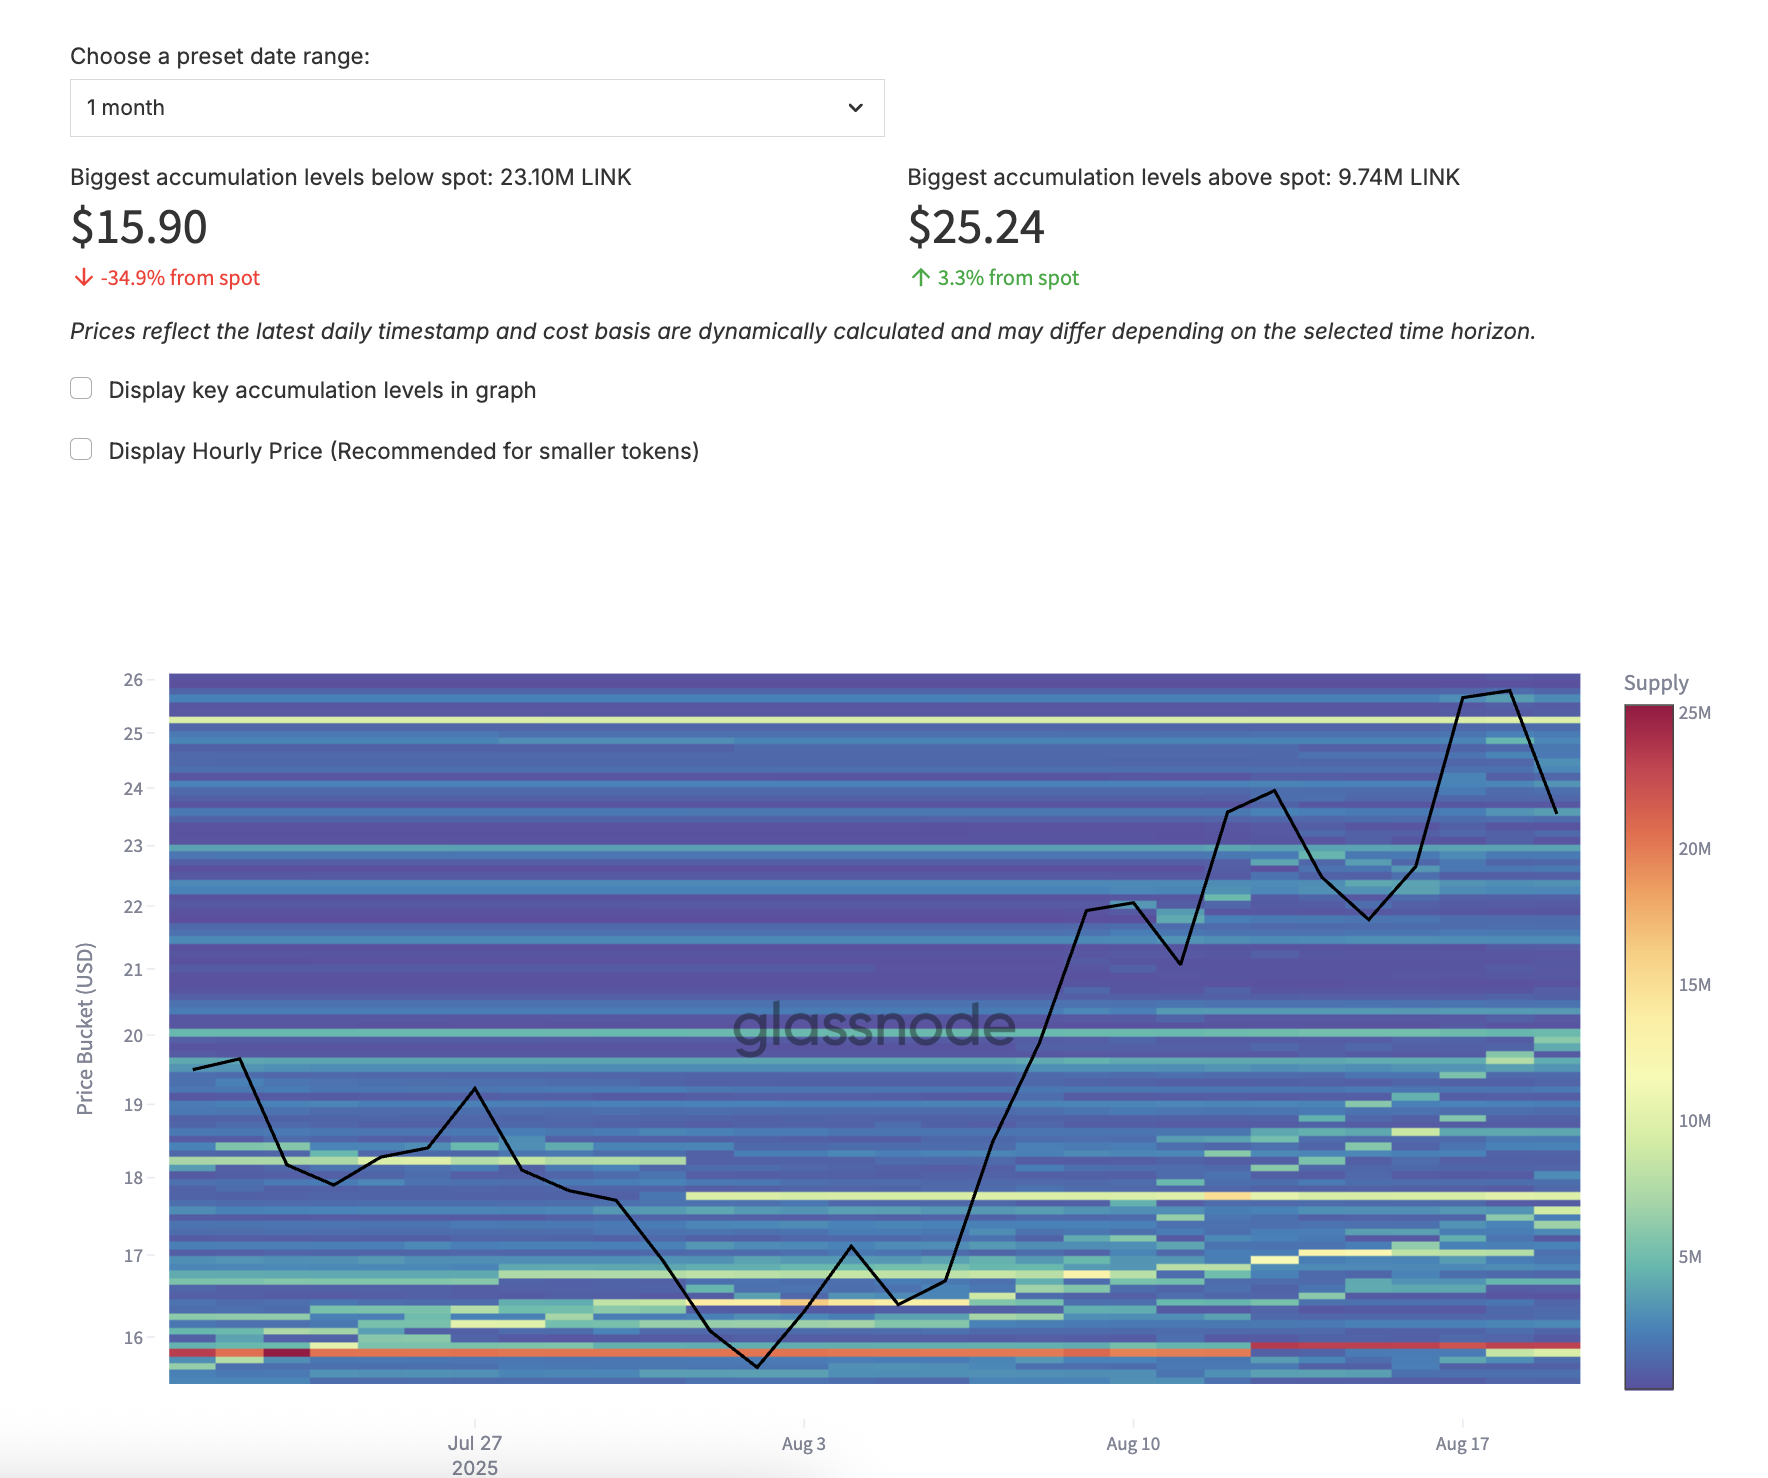
Heatmap and Chainlink Price Chart Align at One Barrier: $25.24
From a chainlink price structure angle, using a trend-based Fibonacci extension tool makes sense as it is still in an uptrend. The levels are drawn from $15.44 low (August 2) to the $24.78 high, with a retracement to $21.32.
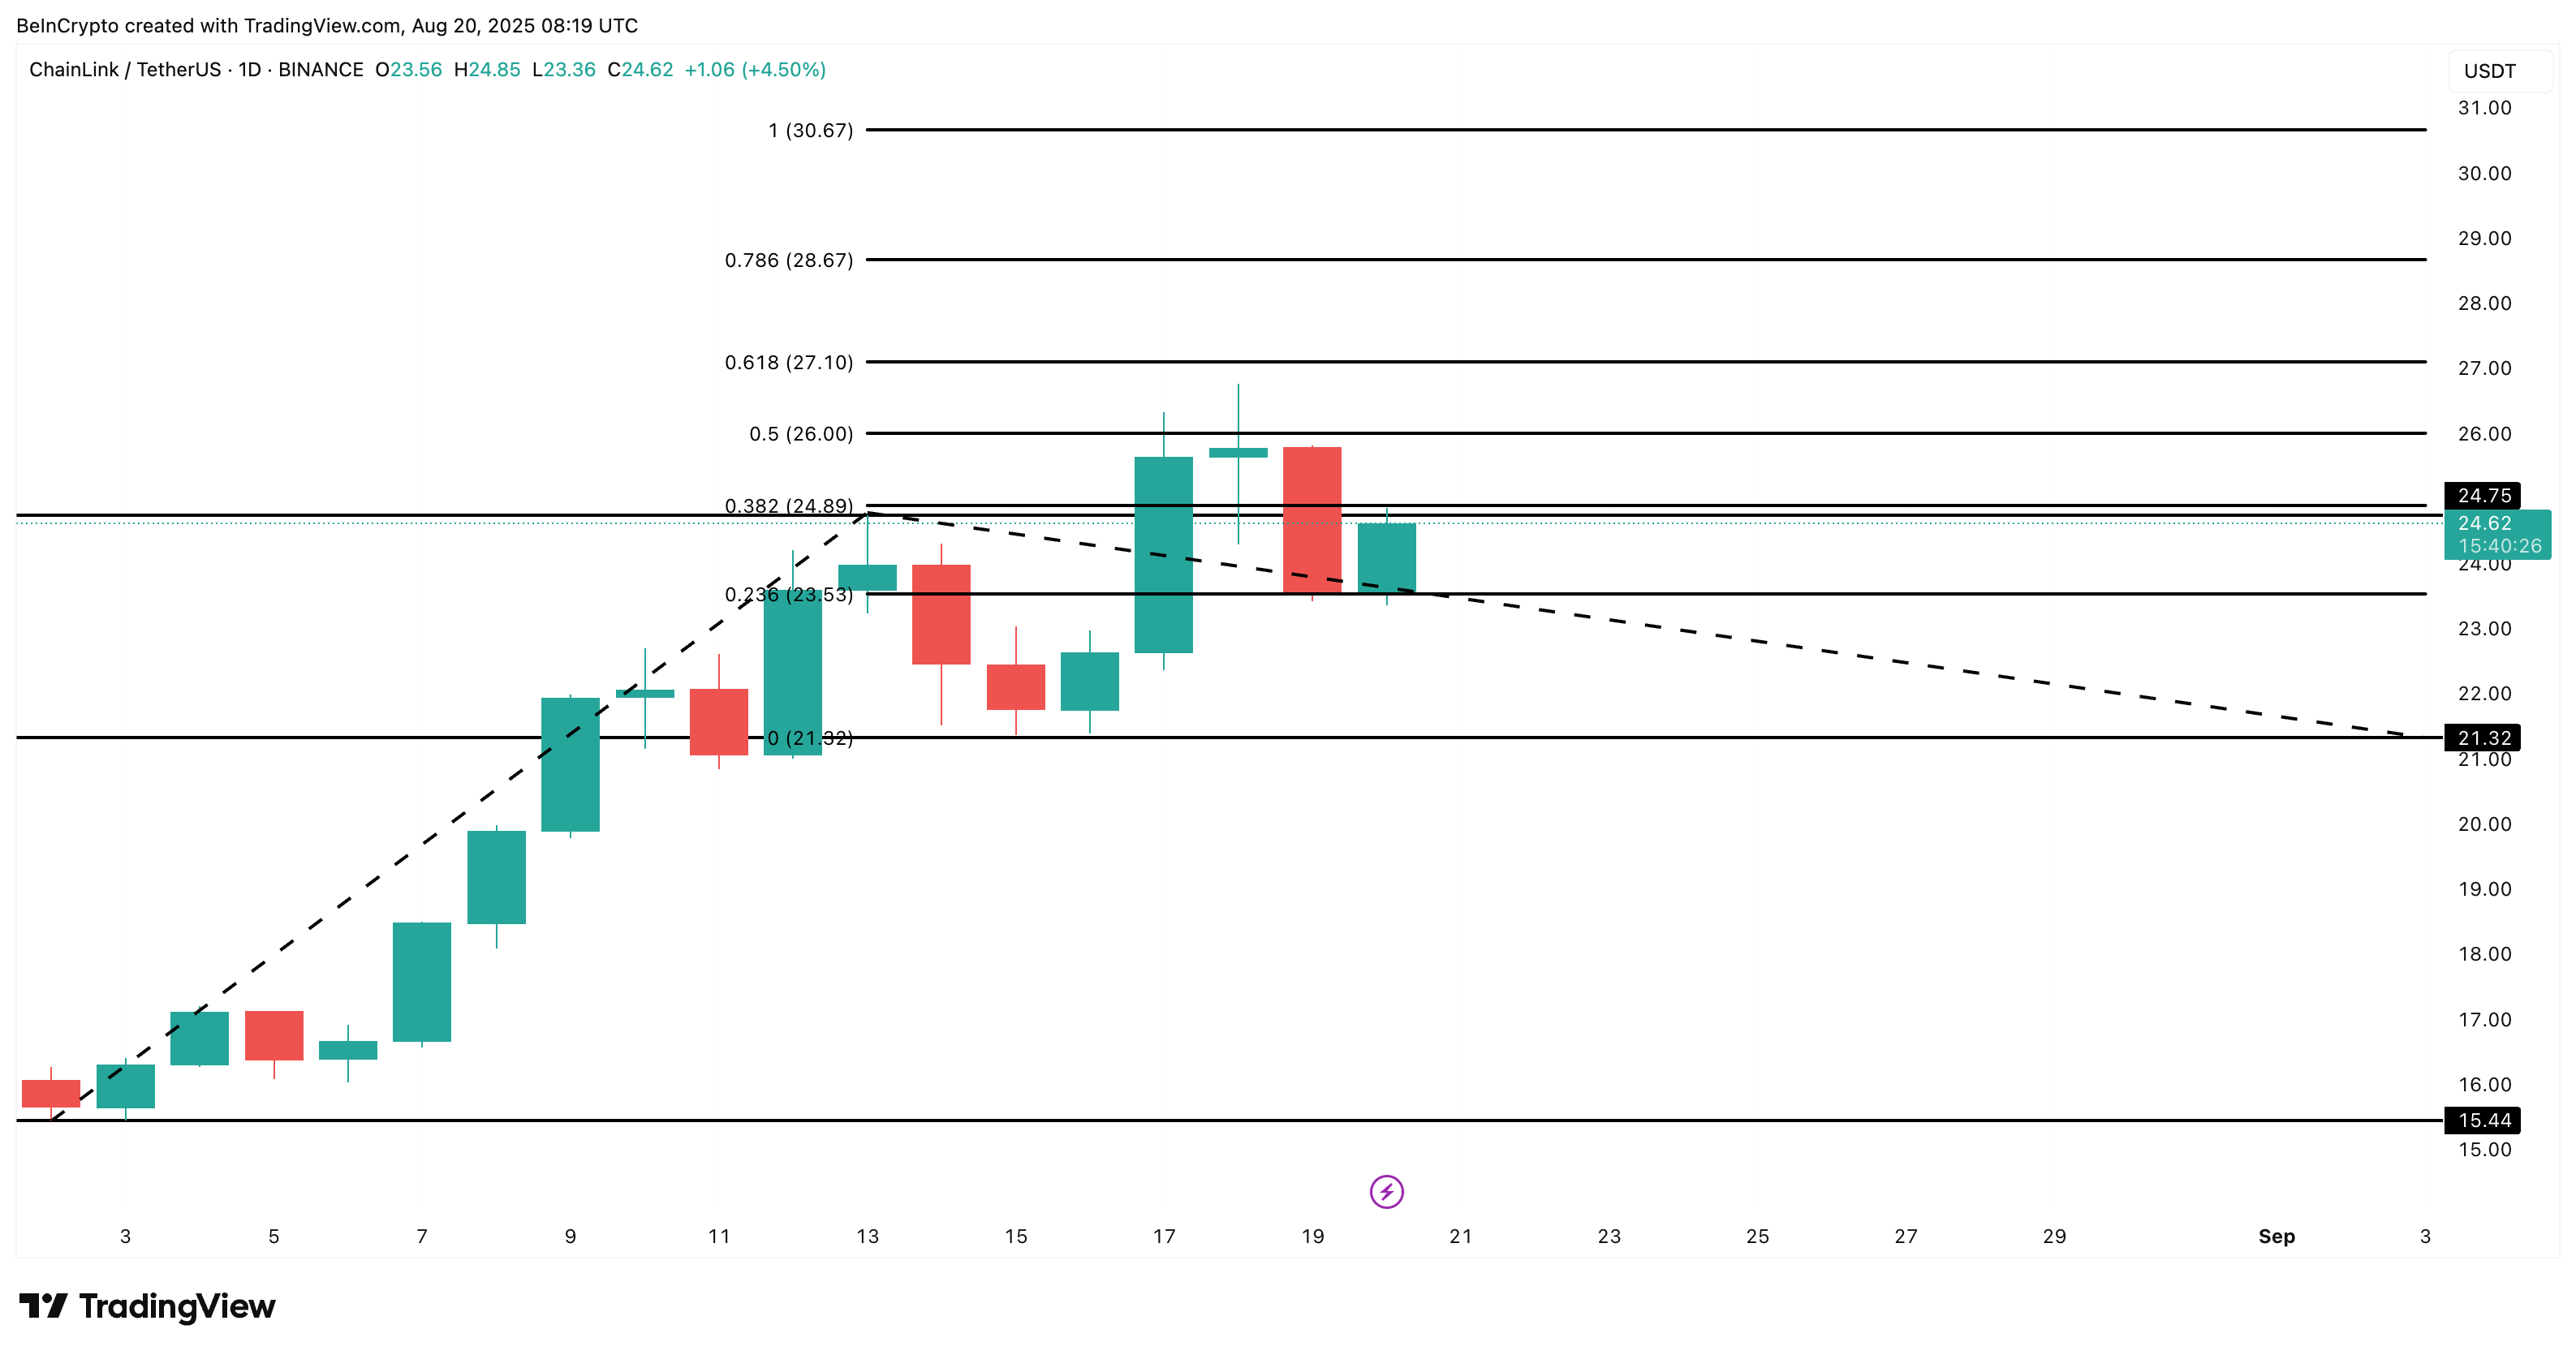
Currently, the price is testing a strong barrier between $24.89 and $26.00 (key resistance levels), which has acted as a sell wall. But that’s just a zone, and it would be better to narrow the barrier a bit more.
According to the cost-basis heatmap, $25.24 is a critical accumulation zone with 9.74 million LINK clustered. At the current price of $24.65, that wall is worth roughly $240 million.
The cost-basis heatmap shows where most traders bought their LINK — essentially highlighting price zones with a high concentration of holder entry points, which often act as resistance or support.
For the rally to continue, the LINK price must touch and close above $25.24 on the daily chart. That would confirm a breakout.
If this happens, the next targets are $28.67 and even $30.67. However, if LINK dips below $21.32, the uptrend structure breaks, and short-term weakness might follow.
