HBAR Defies ETF Buzz but Reveals Stealth Bullish Signals as Traders Scoop Up Dips
HBAR's price action is playing hard to get—ignoring the ETF hype train while quietly flashing buy signals. Smart money’s stacking the dip, but will the retail crowd catch on before the next leg up?
Beneath the surface, liquidity patterns suggest accumulation. Yet another case of 'institutional interest' moving faster than public announcements—because who needs transparency when you’ve got asymmetric info, right?
The chart’s whispering bullish divergence. Now we wait to see if the market finally starts shouting.
Whales Buy the Dip as Price Quietly Drops
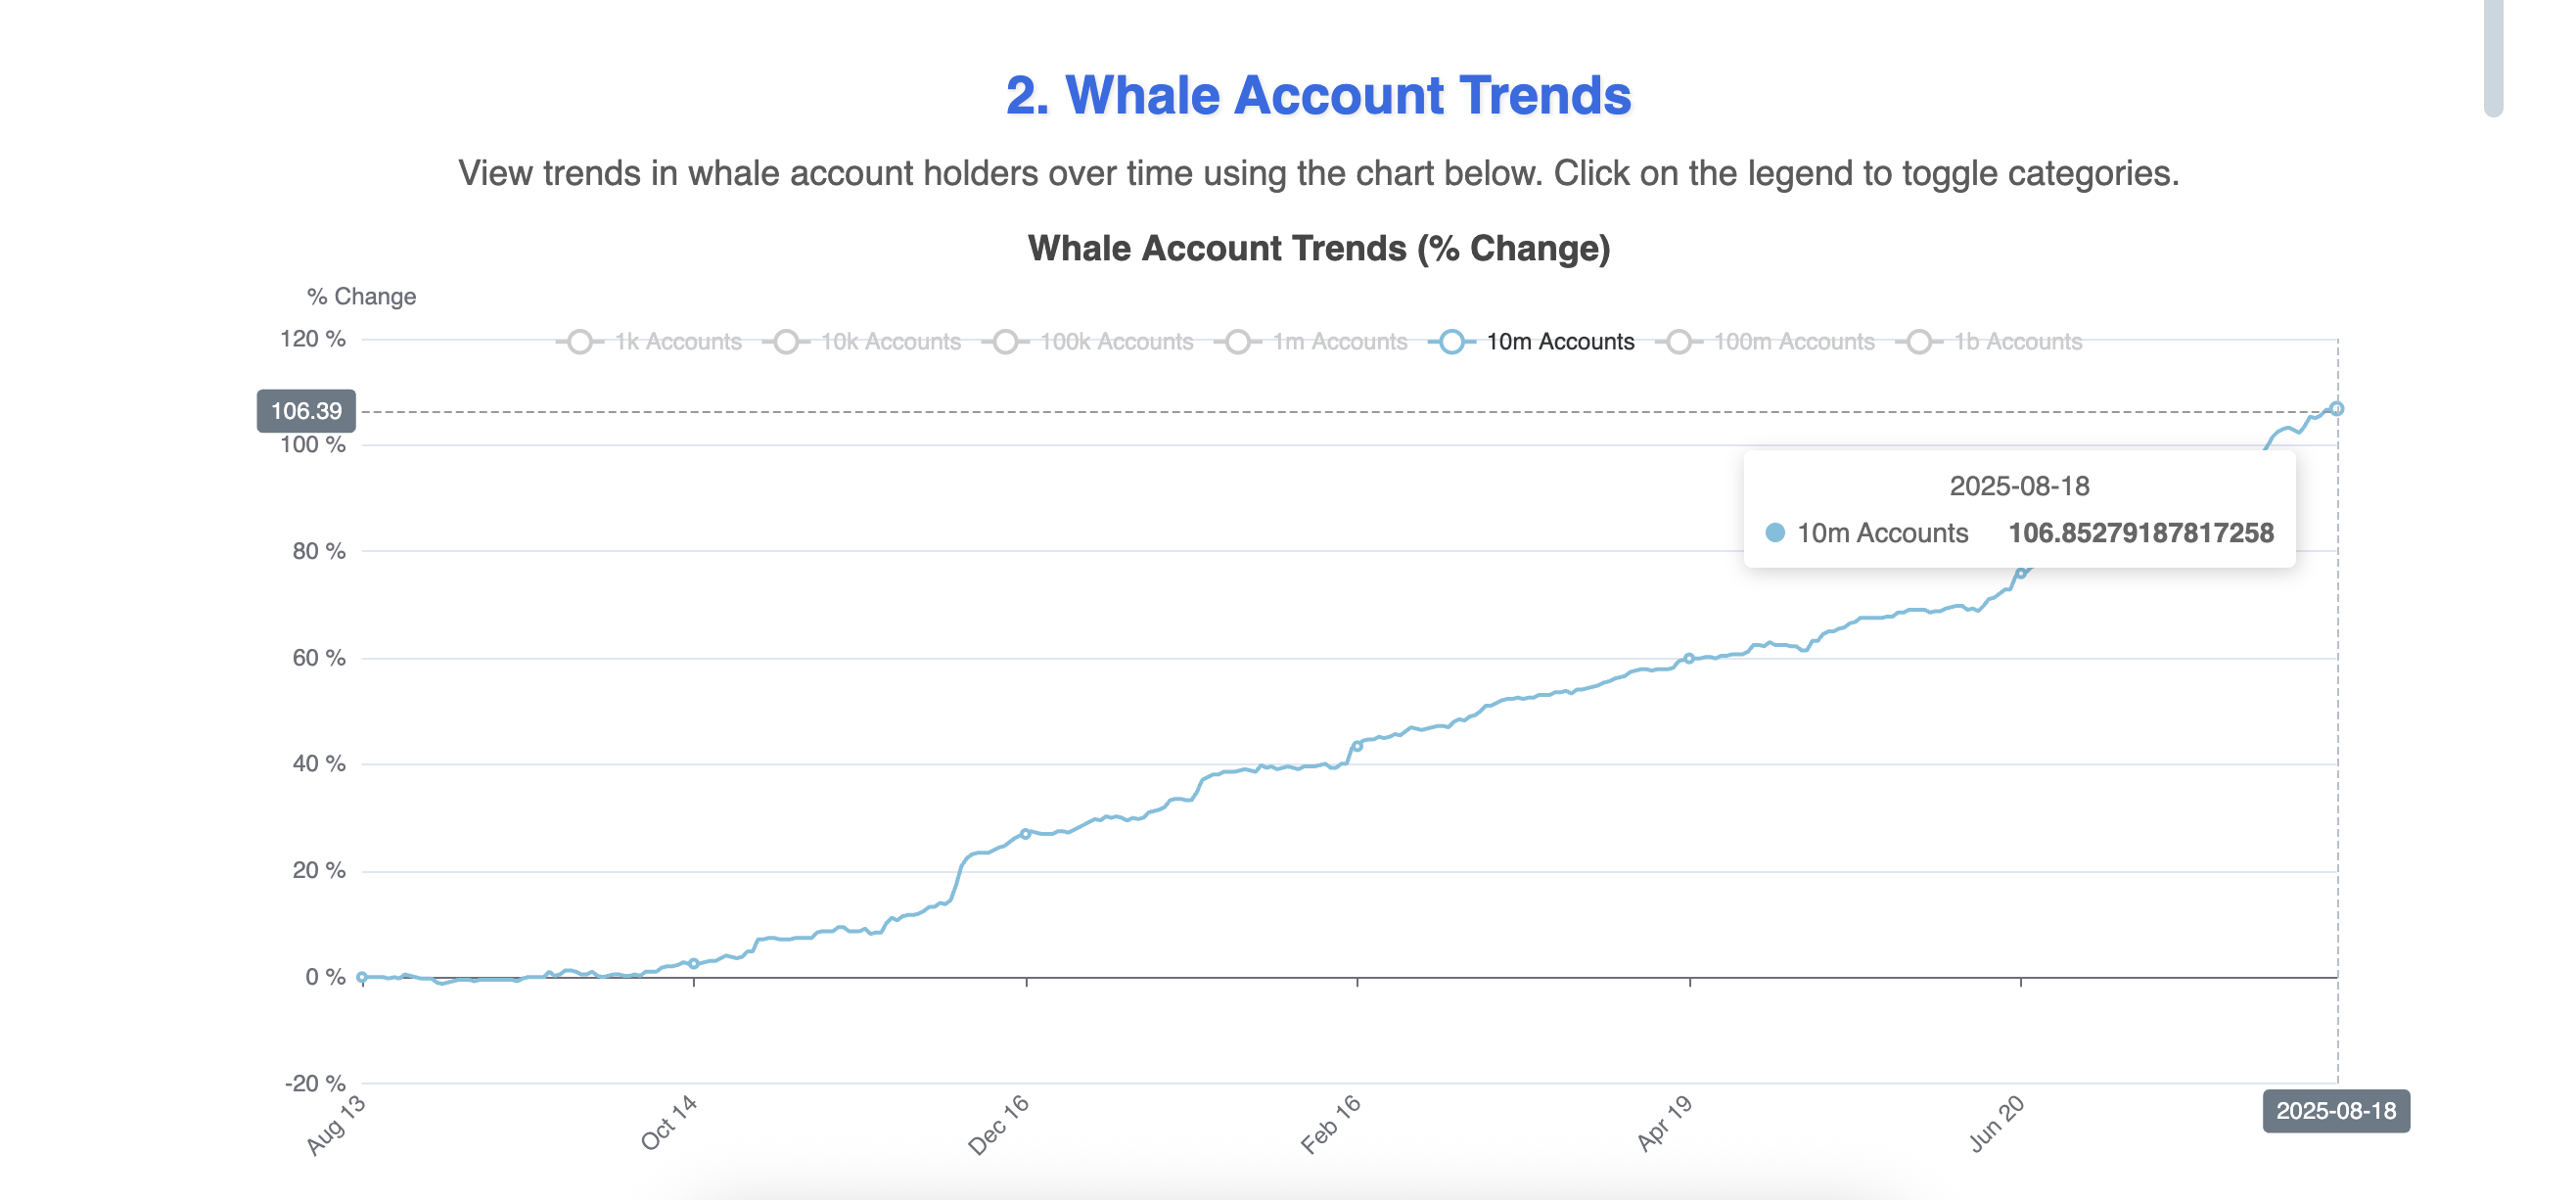
Between August 11 and August 18, wallets holding 10 million or more HBAR increased from 102.28 to 106.85; a rise of 4.57 wallets, which translates to at least 45.7 million HBAR in net accumulation.

The buying took place while the HBAR price dropped from $0.26 to $0.24, a fall of around 8%. In other words, while most of the market was panicking or staying on the sidelines, this heavyweight cohort loaded up on tokens.
The MOVE suggests high-conviction buying during weakness, possibly in anticipation of the ETF rumors materializing or a technical setup forming.
: Want more token insights like this? Sign up for Editor Harsh Notariya’s Daily crypto Newsletter here.
Two Bullish HBAR Price Patterns Are Now in Play
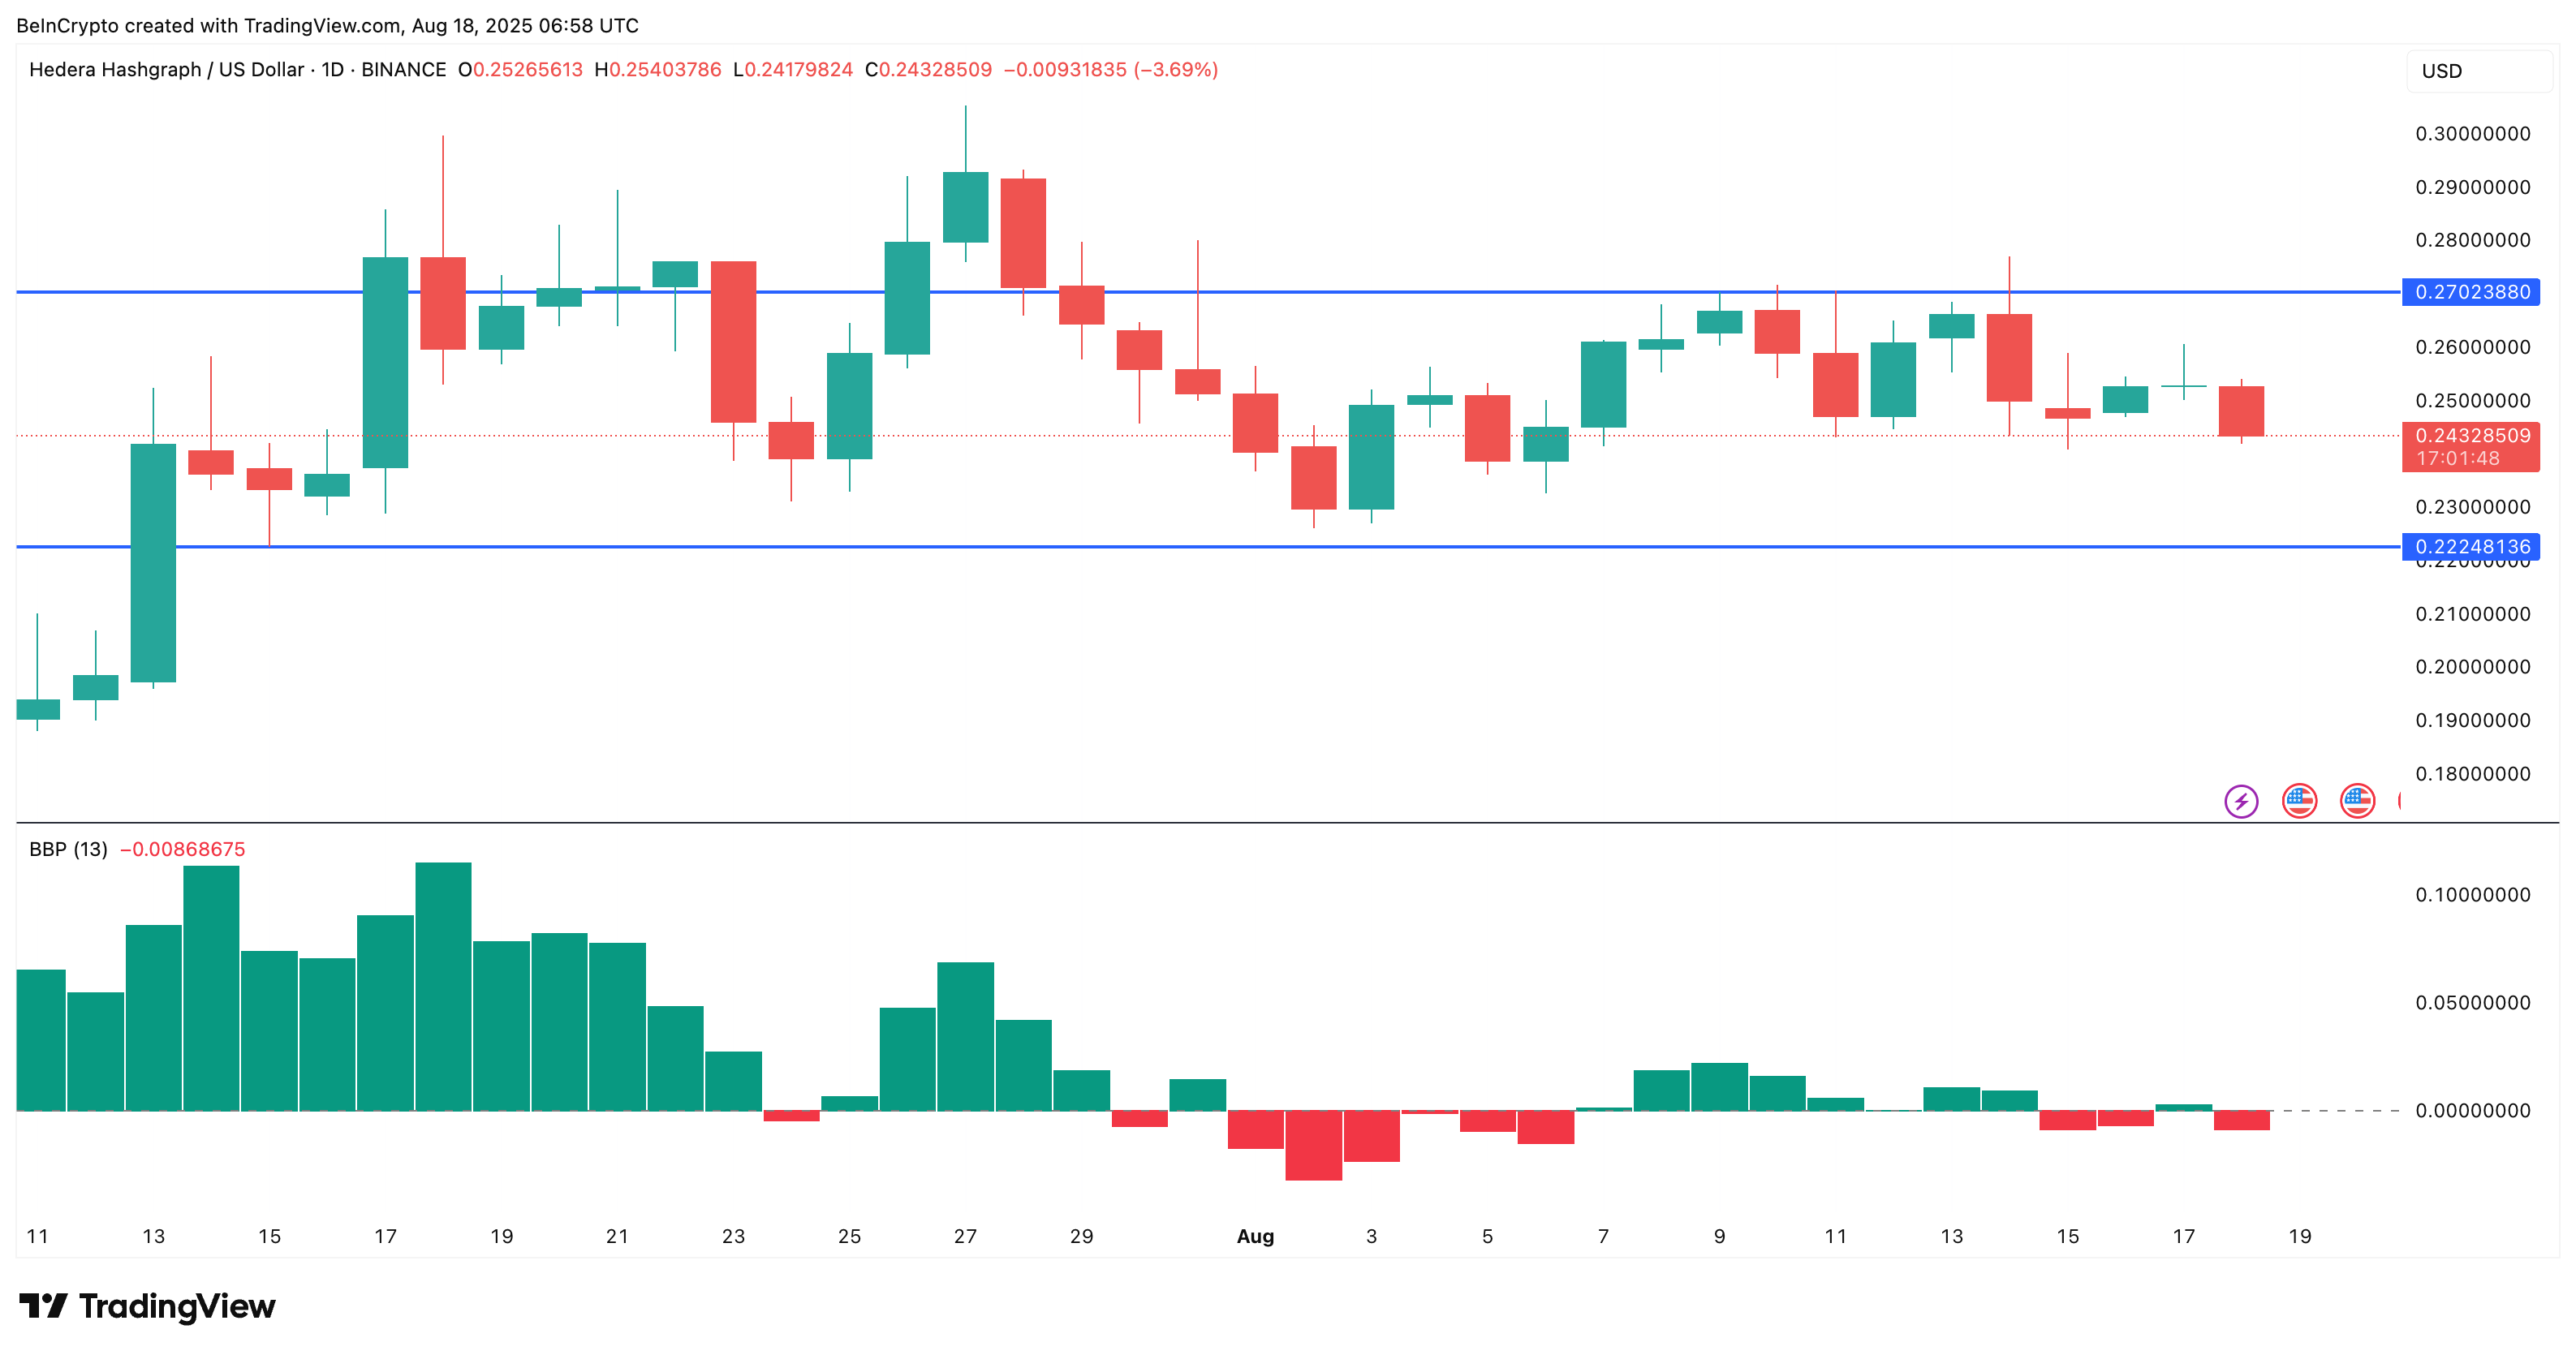
It is worth noting that the daily HBAR price chart (on a shorter time frame) shows a stalemate-like scenario between the bulls and bears, leading to the range-bound movement. The cohort that comes out on top WOULD determine the next leg of the price action.
The Bull Bear Power (BBP) indicator measures the difference between the high and low prices relative to a moving average, indicating whether bulls or bears are currently stronger. In this case, the indicator reflects a stalemate, with neither side clearly dominating.

It is this level of indecisiveness that made it necessary to move to the 3-day chart, where two clear bullish signals emerge.

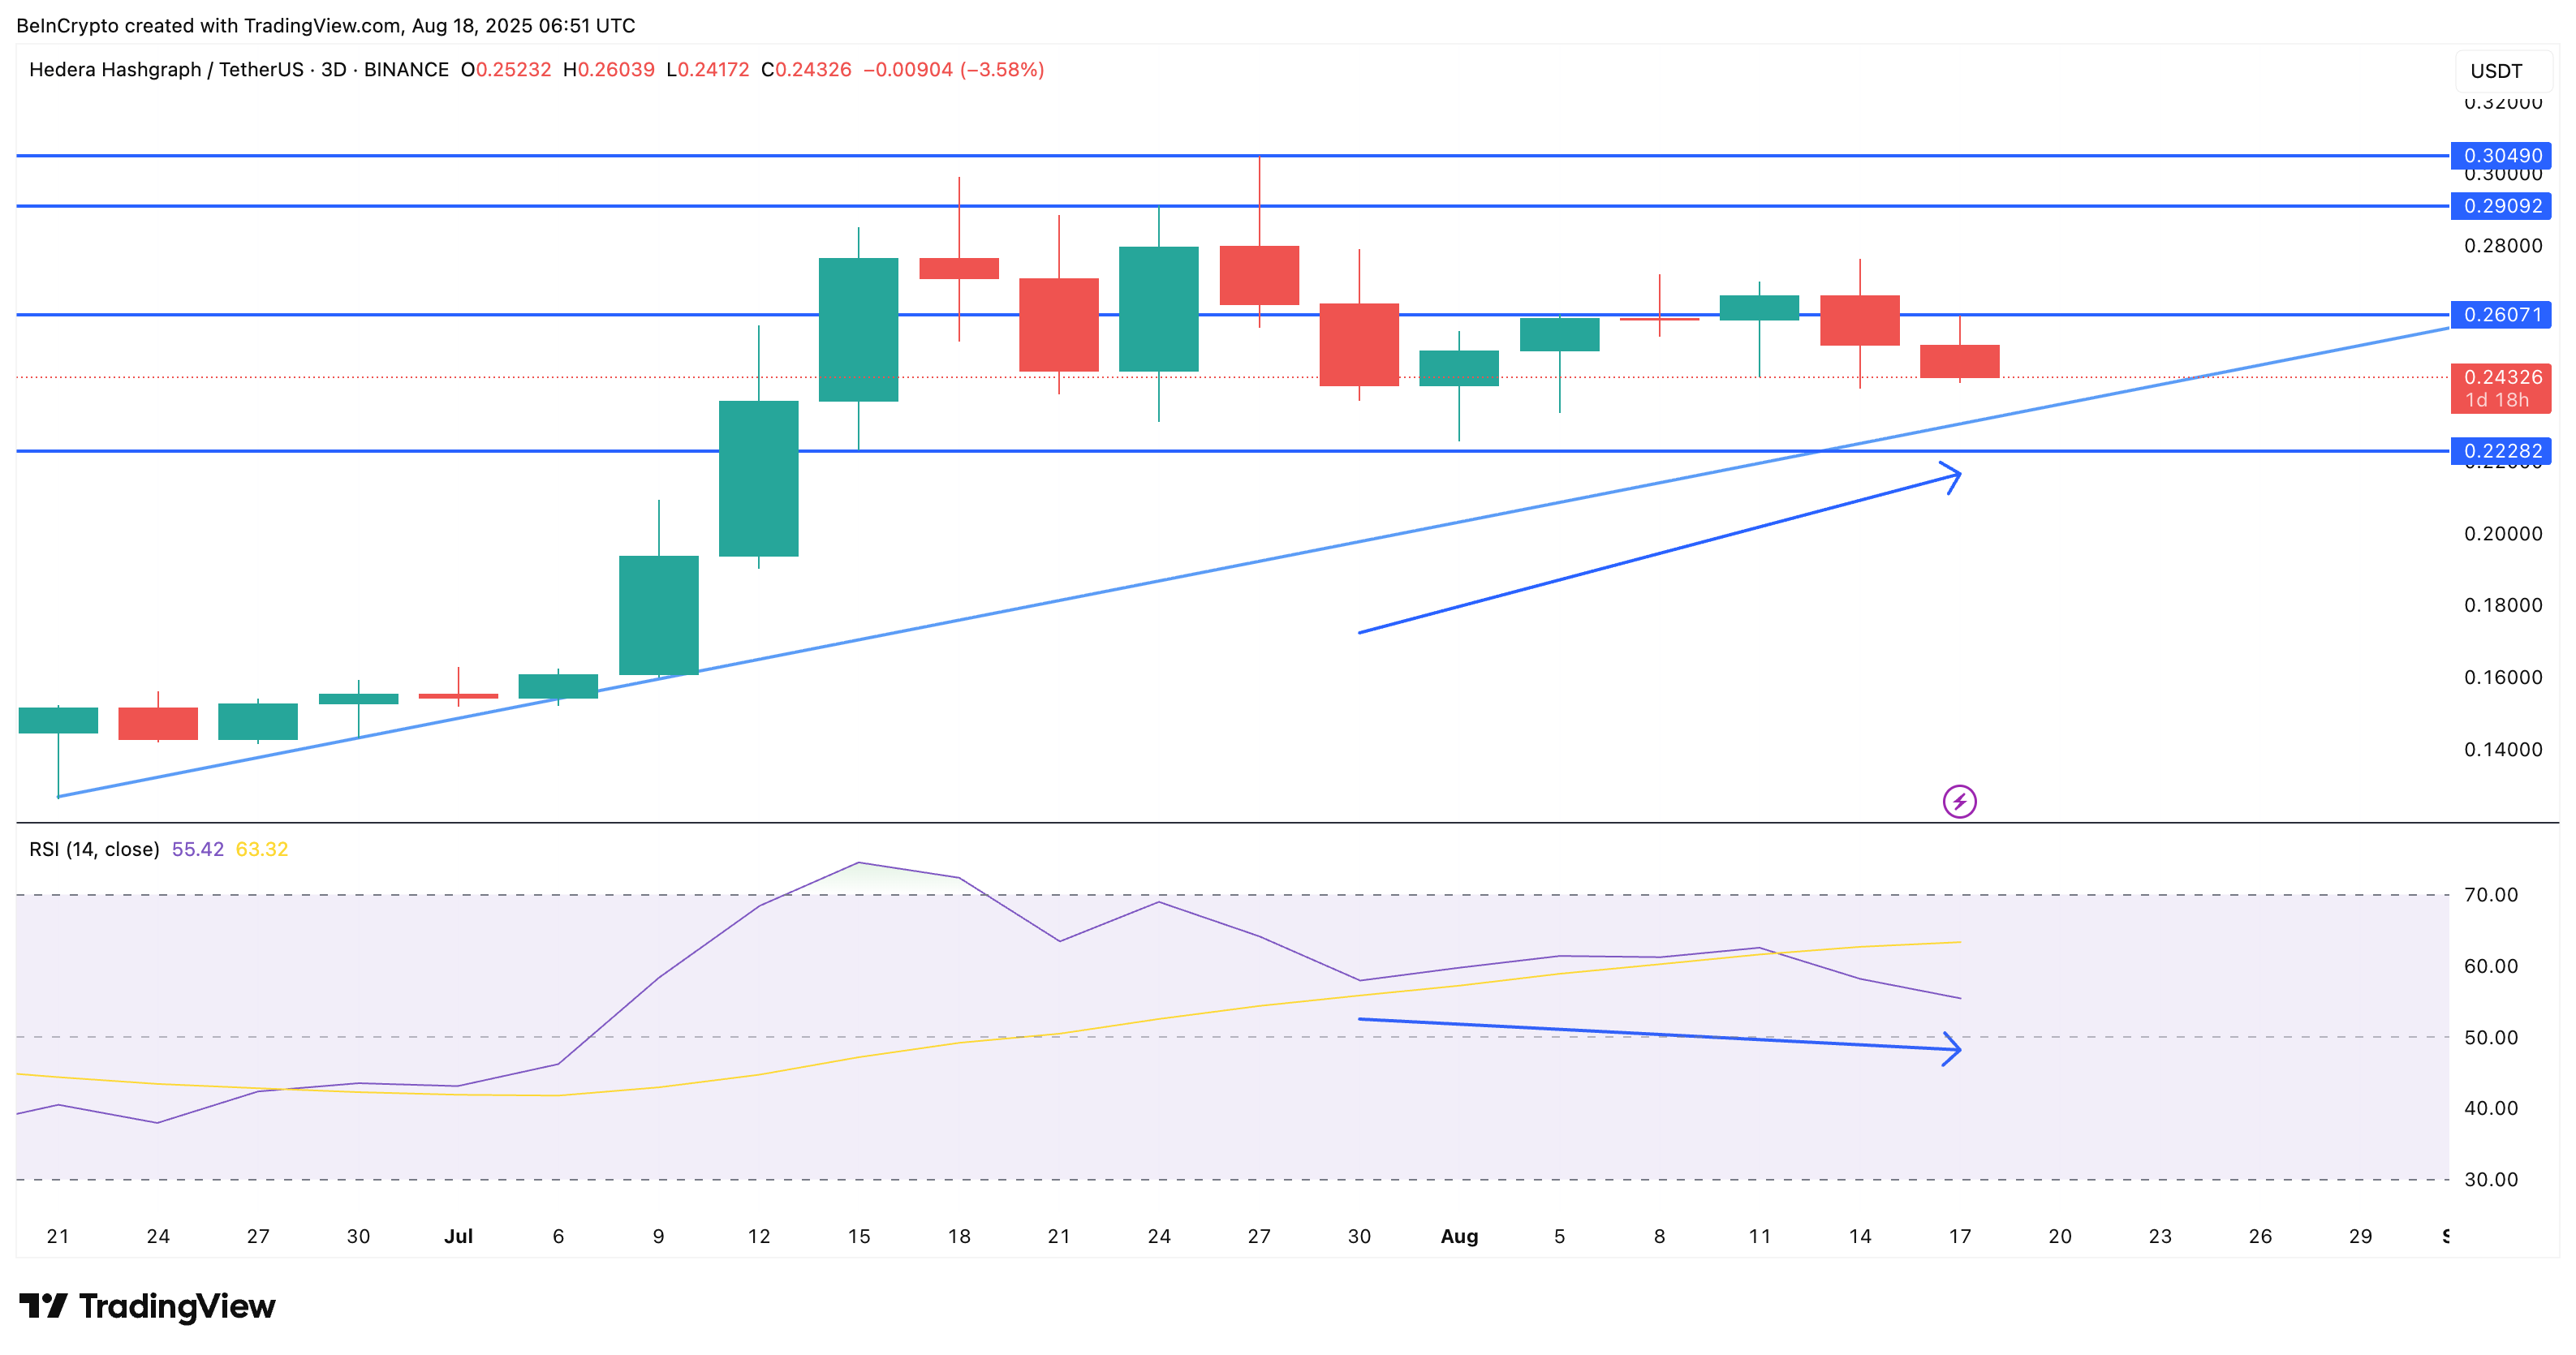
First, the ascending triangle is holding firm, with rising lows forming against a consistent resistance trendline. The key resistance levels are at $0.26 and $0.29, which FORM the upper trendlines of the triangle pattern.
Breakout confirmation would be a decisive close above $0.30, which could flip HBAR’s mid-term structure bullish.
Second, a hidden bullish RSI divergence has been forming. Between July 30 and August 17, the HBAR price has been making higher lows, while the 3-day RSI printed lower lows. This is a classic case of momentum resetting while price maintains trend structure, often signaling that sellers are losing grip.
If whale buying momentum continues and the RSI divergence plays out, it could fuel a breakout beyond the $0.30 zone. The confirmation of the BlackRock ETF rumor might add more fuel to this bullish chart pattern. Yet, a dip under $0.22 would invalidate the bullishness and might push the HBAR price towards new lows.

