Ethereum Braces for Historic Sell-Off — Can It Still Hit $5K Against the Tide?

Ethereum's facing a tsunami of sell orders—the second-biggest yearly dump in its history. Traders are sweating: Will the $5,000 dream drown in the outflow?
Market mechanics vs. maximalist hopium
The sell pressure's brutal, but ETH's defied gravity before. Network upgrades and institutional nibbles could flip the script—or this might just be another 'buy the rumor, sell the news' circus act.
Wall Street's watching (and probably shorting)
While retail panics, hedge funds are circling like sharks in chummed water. Nothing unites traditional finance and crypto quite like the smell of leverage and liquidations.
Final take: Ethereum's either priming for a heroic recovery or setting up history's most expensive bagholder seminar. Place your bets—the house always wins.
Second-Highest Yearly Exchange Inflow Signals Selling Pressure
Ethereum saw 2,594,168 ETH MOVE into exchanges on August 14, marking the second-highest single-day exchange inflow of 2025, trailing only February 3’s 3,264,688 ETH spike.
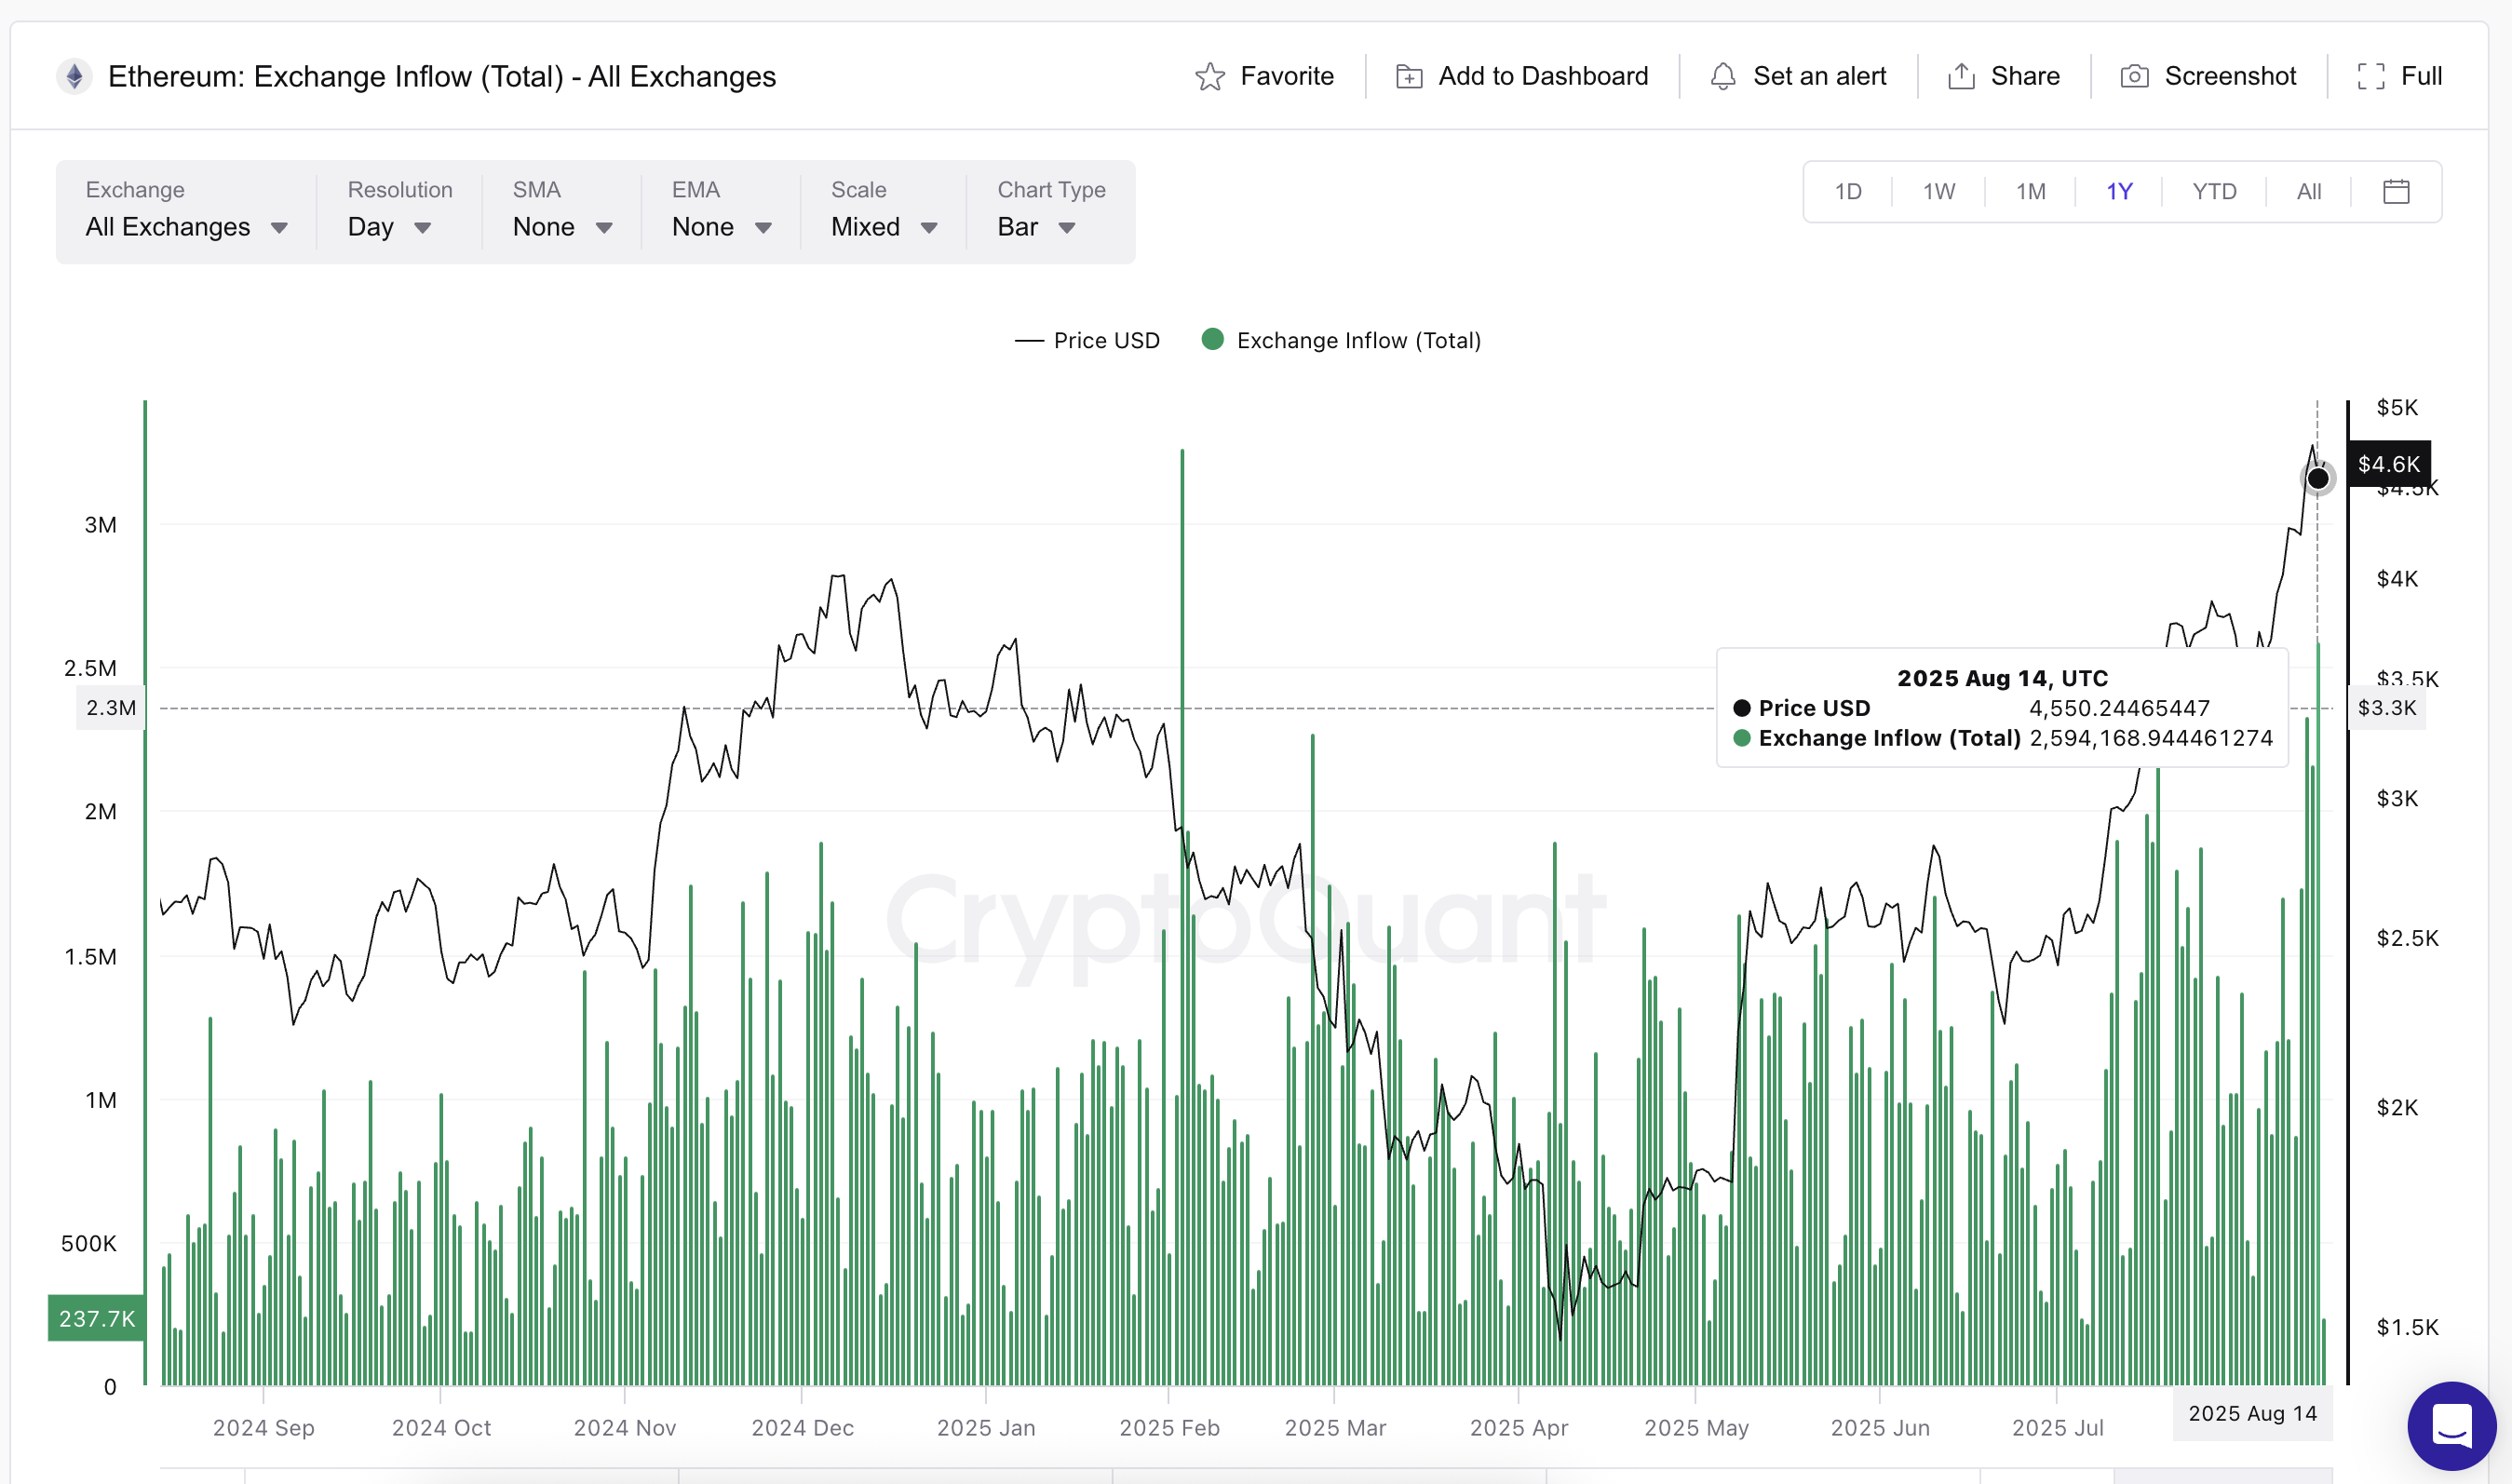
Exchange inflows typically signal potential sell pressure, and this surge was partly driven by ethereum Foundation wallets, which have been among the largest sellers recently.
The #EthereumFoundation-linked wallet(0xF39d) sold another 1,300 $ETH($5.87M) at $4,518 ~11 hours ago.
Over the past 3 days, this wallet has sold a total of 6,194 $ETH($28.36M) at an average price of $4,578.https://t.co/4hfCWymHVG pic.twitter.com/ErUyEY8SJy
Historically, high inflow local tops lead to price corrections, as seen during the first part of 2025. At that time, the ethereum price was in a downtrend, and each local top in exchange inflow led to a sharper dip.
Things were different as seen on July 18 (2,381,361 ETH) and August 12 (2,335,642 ETH), two current inflow-driven local tops. Unlike February’s downtrend-driven spikes, these recent inflows occurred in an uptrend, a context where selling pressure is being offset by a strong buying force. This buying absorption is now the critical factor keeping Ethereum’s bullish structure intact.
: Want more token insights like this? Sign up for Editor Harsh Notariya’s Daily crypto Newsletter here.
Large Holder Inflows Show Buying Power Absorbing Supply
Backing that absorption narrative, large holder inflows — addresses holding at least 0.1% of the total ETH supply- remain strong. Despite a slight dip on August 13, the seven-day change stands at +98.71%, and the 90-day change has surged +255.27%. These wallets are known to accumulate aggressively during dips.
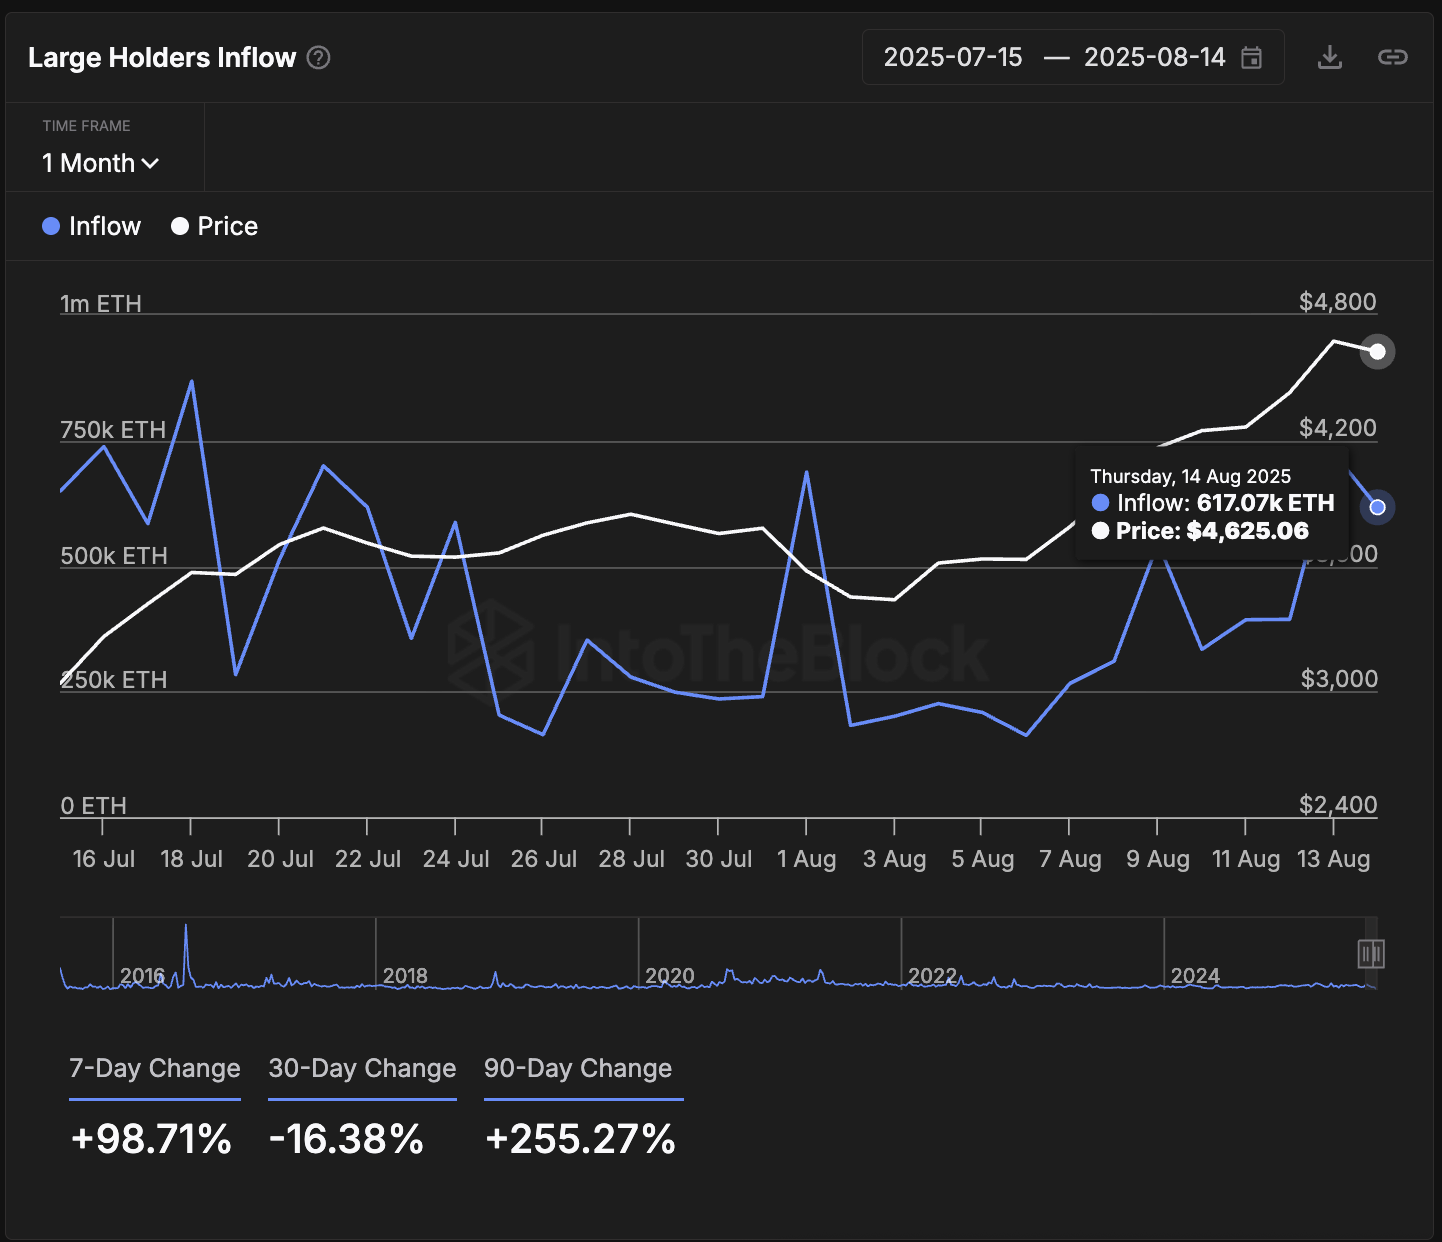
For example, between July 31 and August 1, when ETH price dropped from $3,781 to $3,577, large holder inflows jumped from 240,190 ETH to 687,290 ETH.
Even after short pullbacks, these inflows have continued to make higher highs on the monthly chart. The figure reached 725,000 ETH on August 13 before holding steady at over 617,000 ETH. This is a sign that deep-pocketed buyers are still building positions.
Exchange inflows track coins moving onto exchanges, often signaling potential selling. Large holder inflows, on the other hand, measure the amount accumulated by wallets holding at least 0.1% of the supply. It is a gauge of buying pressure from big players.
Ethereum Price Structure Holds as Bulls Keep Control
Technically, the Ethereum price remains in an uptrend, with the $4,480 zone acting as a strong support during the latest dip. Immediate resistance is at $4,785, a key Fibonacci extension level. A daily close above this could open a run toward the psychological $5,000 level, $5,175 to be exact.
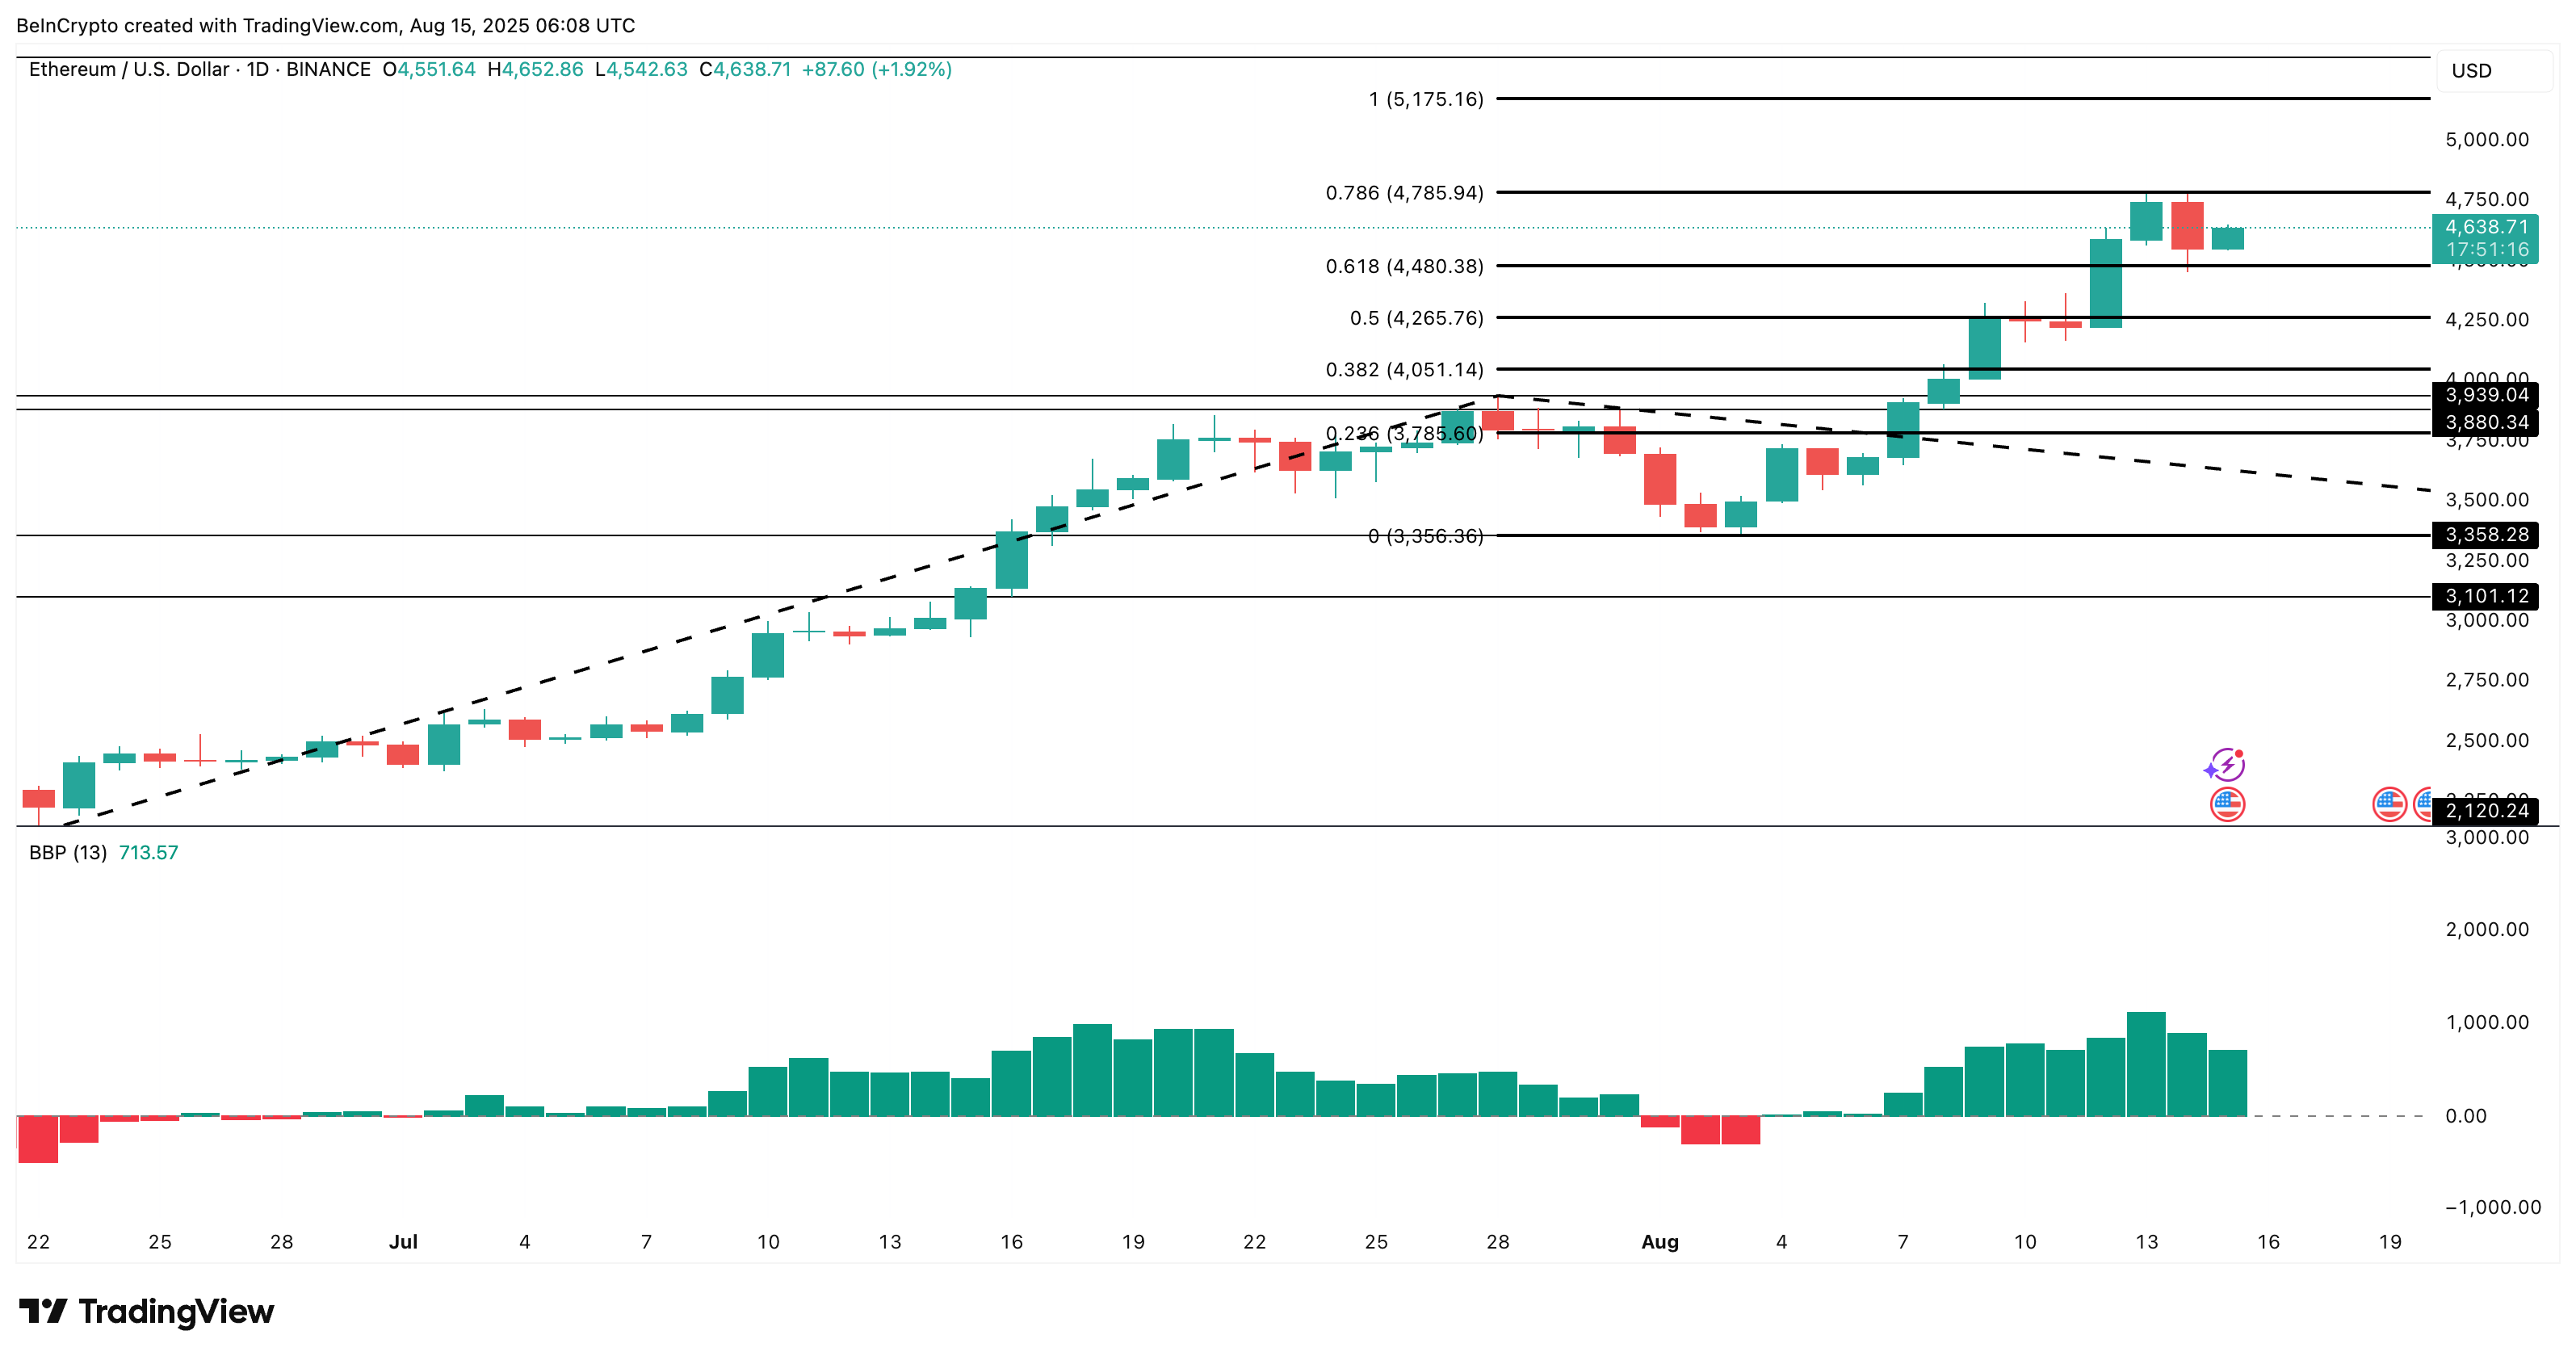
The bull-bear power indicator continues to favor buyers, showing that despite heavy exchange inflows, bears have not taken control.
Invalidation of the bullish hypothesis WOULD require a decisive (complete candle) break below $4,480. That should be paired with a sustained rise in ETH exchange inflows and a dip in 30-day large holder inflow; conditions not yet met.
