BCH Defies Market Downturn — Is Bitcoin Cash Gearing Up for a Breakout?

While the crypto market bleeds red, Bitcoin Cash (BCH) stands firm—defying gravity as rivals tumble. What’s fueling this resilience, and can it last?
The Unshaken Outlier
BCH’s price stability amid chaos sparks whispers of accumulation. No flashy pumps, no panic dumps—just stubborn consolidation while Bitcoin and Ethereum cough up gains. Traders are left wondering: Is this the calm before a storm?
Network Activity Tells the Story
Behind the scenes, BCH’s utility as a payments rail keeps humming. Merchant adoption ticks up, transaction volumes hold steady—real-world use that doesn’t care about Elon’s latest tweet or Fed rate drama.
The Elephant in the Room
Let’s be real: BCH still lives in Bitcoin’s shadow. But when the ‘digital gold’ narrative stumbles, could the ‘digital cash’ thesis finally get its day? (Spoiler: Wall Street will still call it a ‘ghost chain’ until they finish accumulating.)
One thing’s clear—in a market where most projects are glorified Excel sheets with tokens, BCH keeps quietly proving its worth. Whether that translates to price action? That’s the billion-satoshi question.
BCH Defies Bears; Key Liquidity Zone Could Unlock Fresh Upside
An assessment of BCH’s liquidation heatmap has revealed a concentration of liquidity at the $603 price zone.
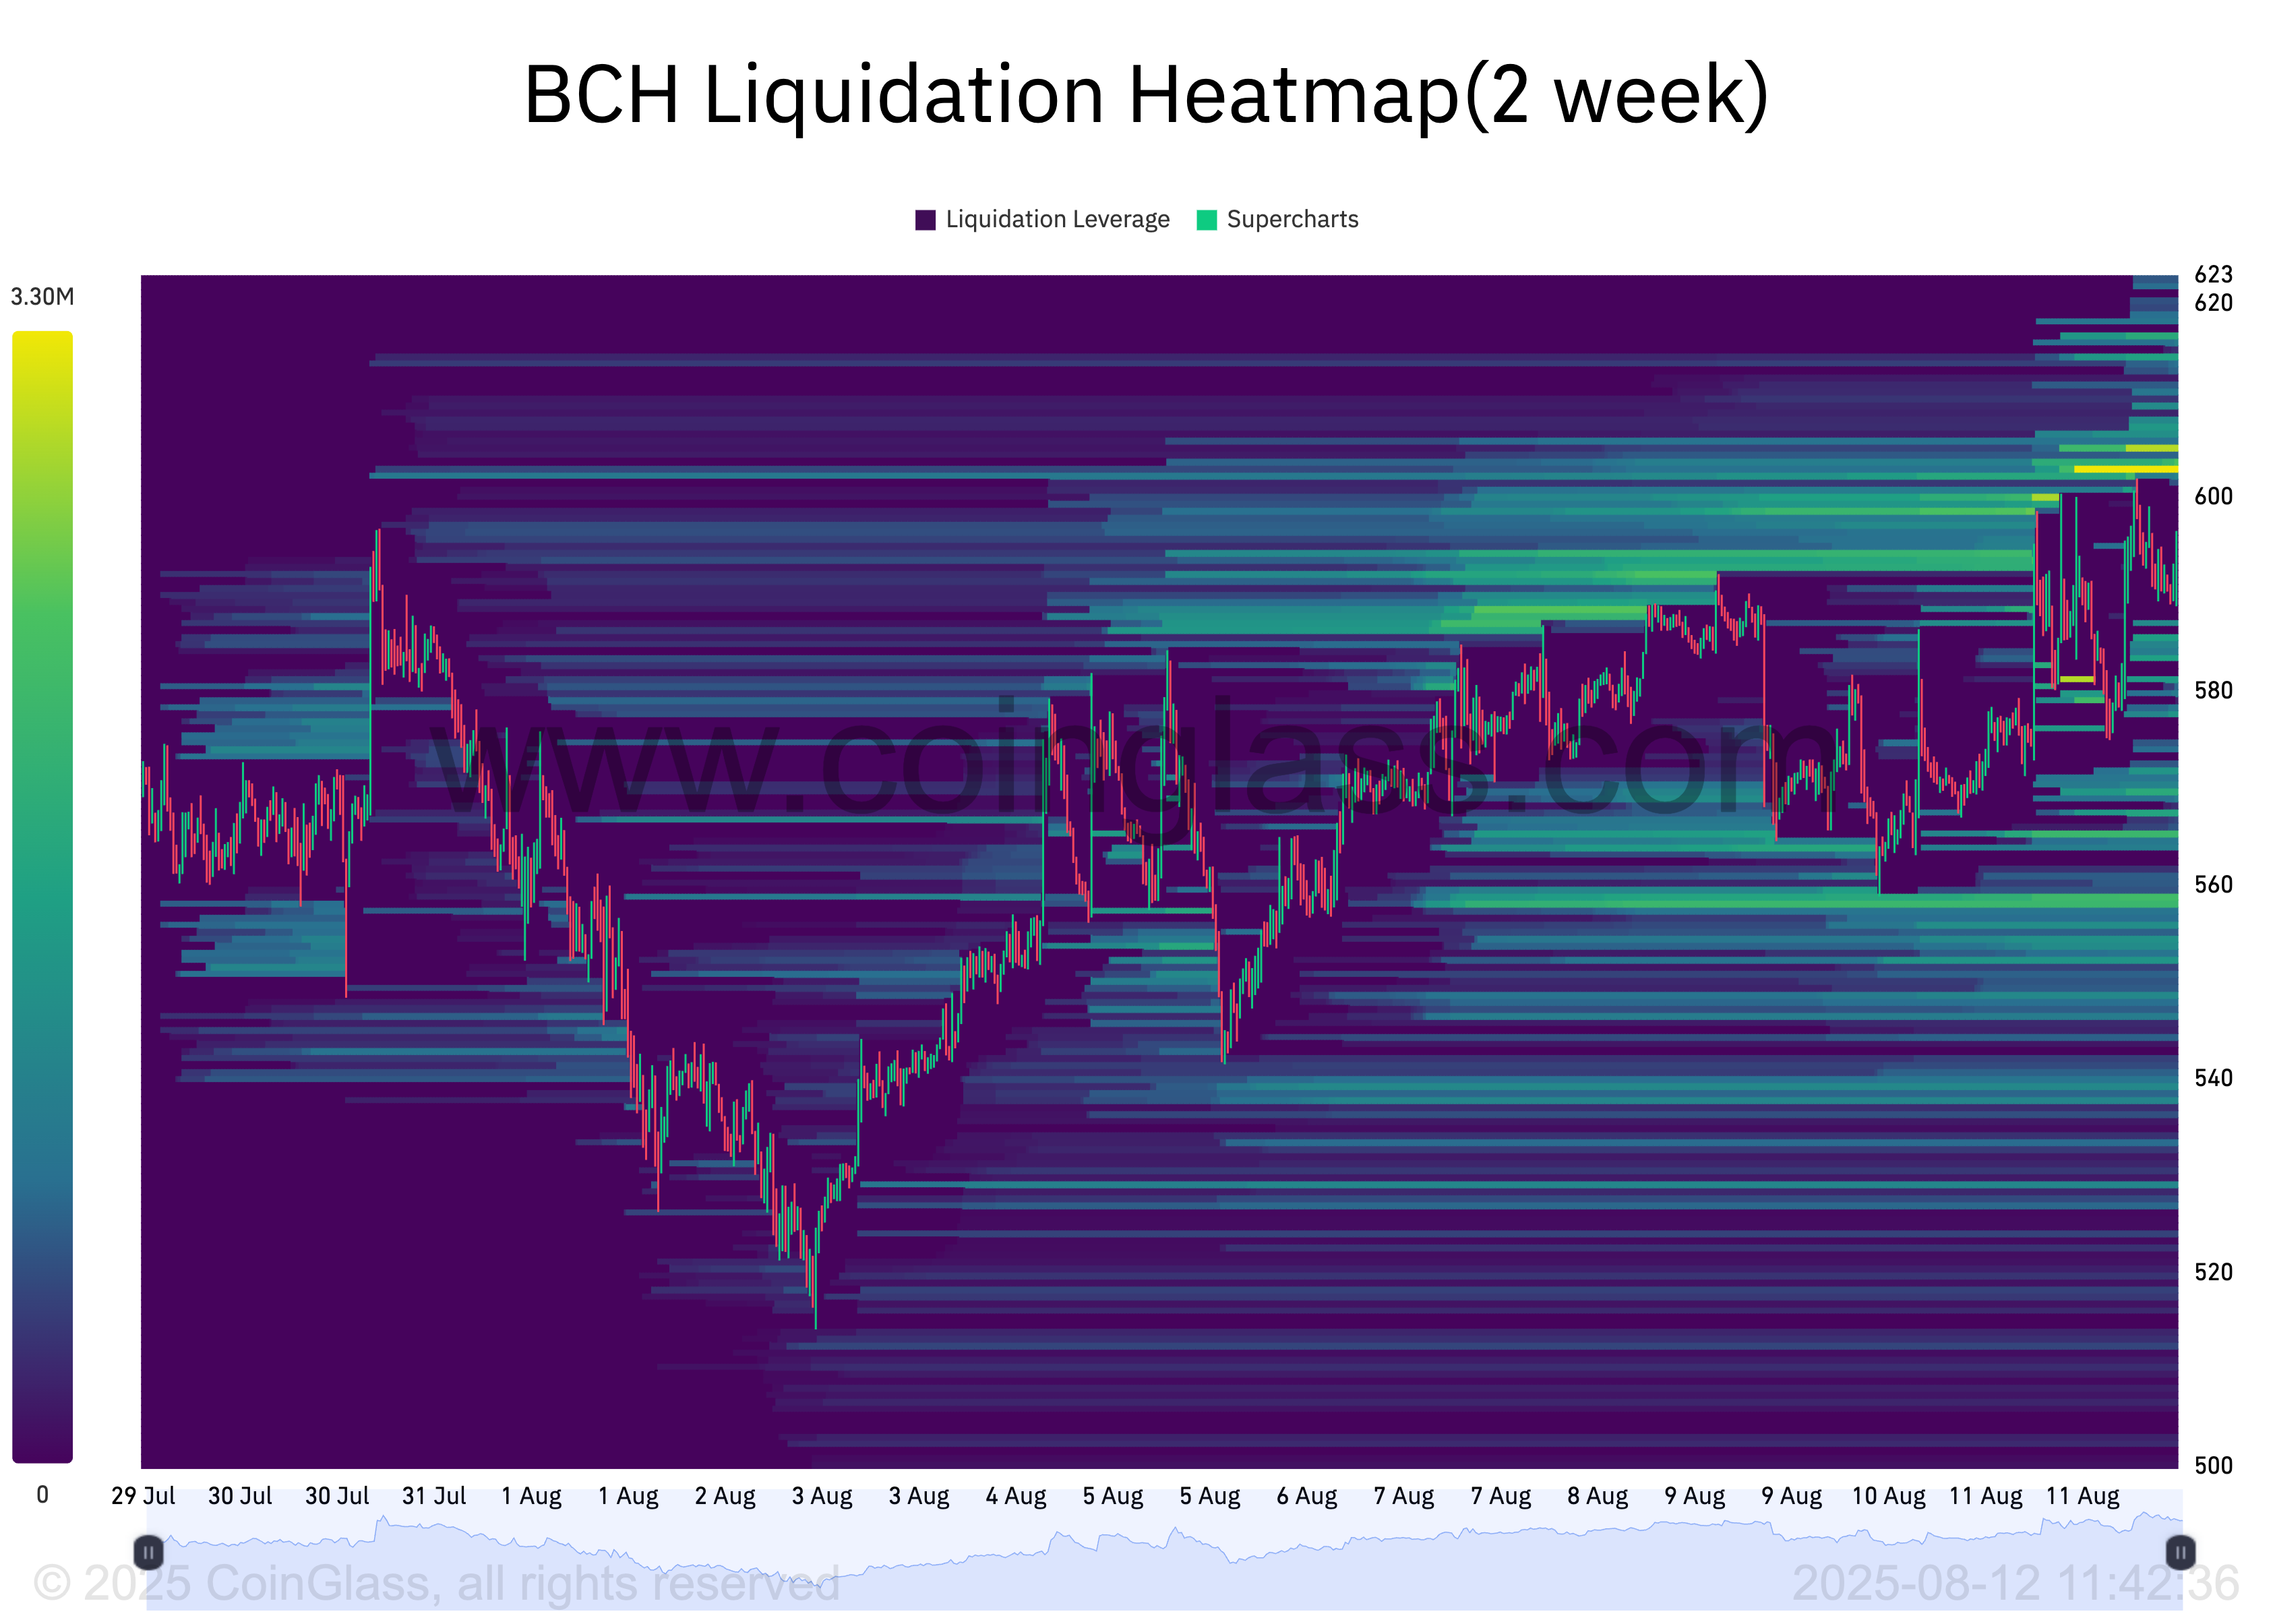
A liquidation heatmap tracks clusters of Leveraged positions in the market and highlights where large amounts of open interest could be triggered into buying or selling if the price reaches those levels. These areas of high liquidity are often color-coded to show intensity, with brighter zones representing larger liquidation potential.
When liquidity is concentrated above an asset’s current price, it indicates a potential “magnet” effect, where traders push the price upward to trigger liquidations and unlock that liquidity.
For BCH, the $603 zone could act as such a target, fueling further upside if bullish momentum persists.
Further, BCH’s climbing Relative Strength Index (RSI), which stands at 59.54 at press time, confirms this bullish outlook.
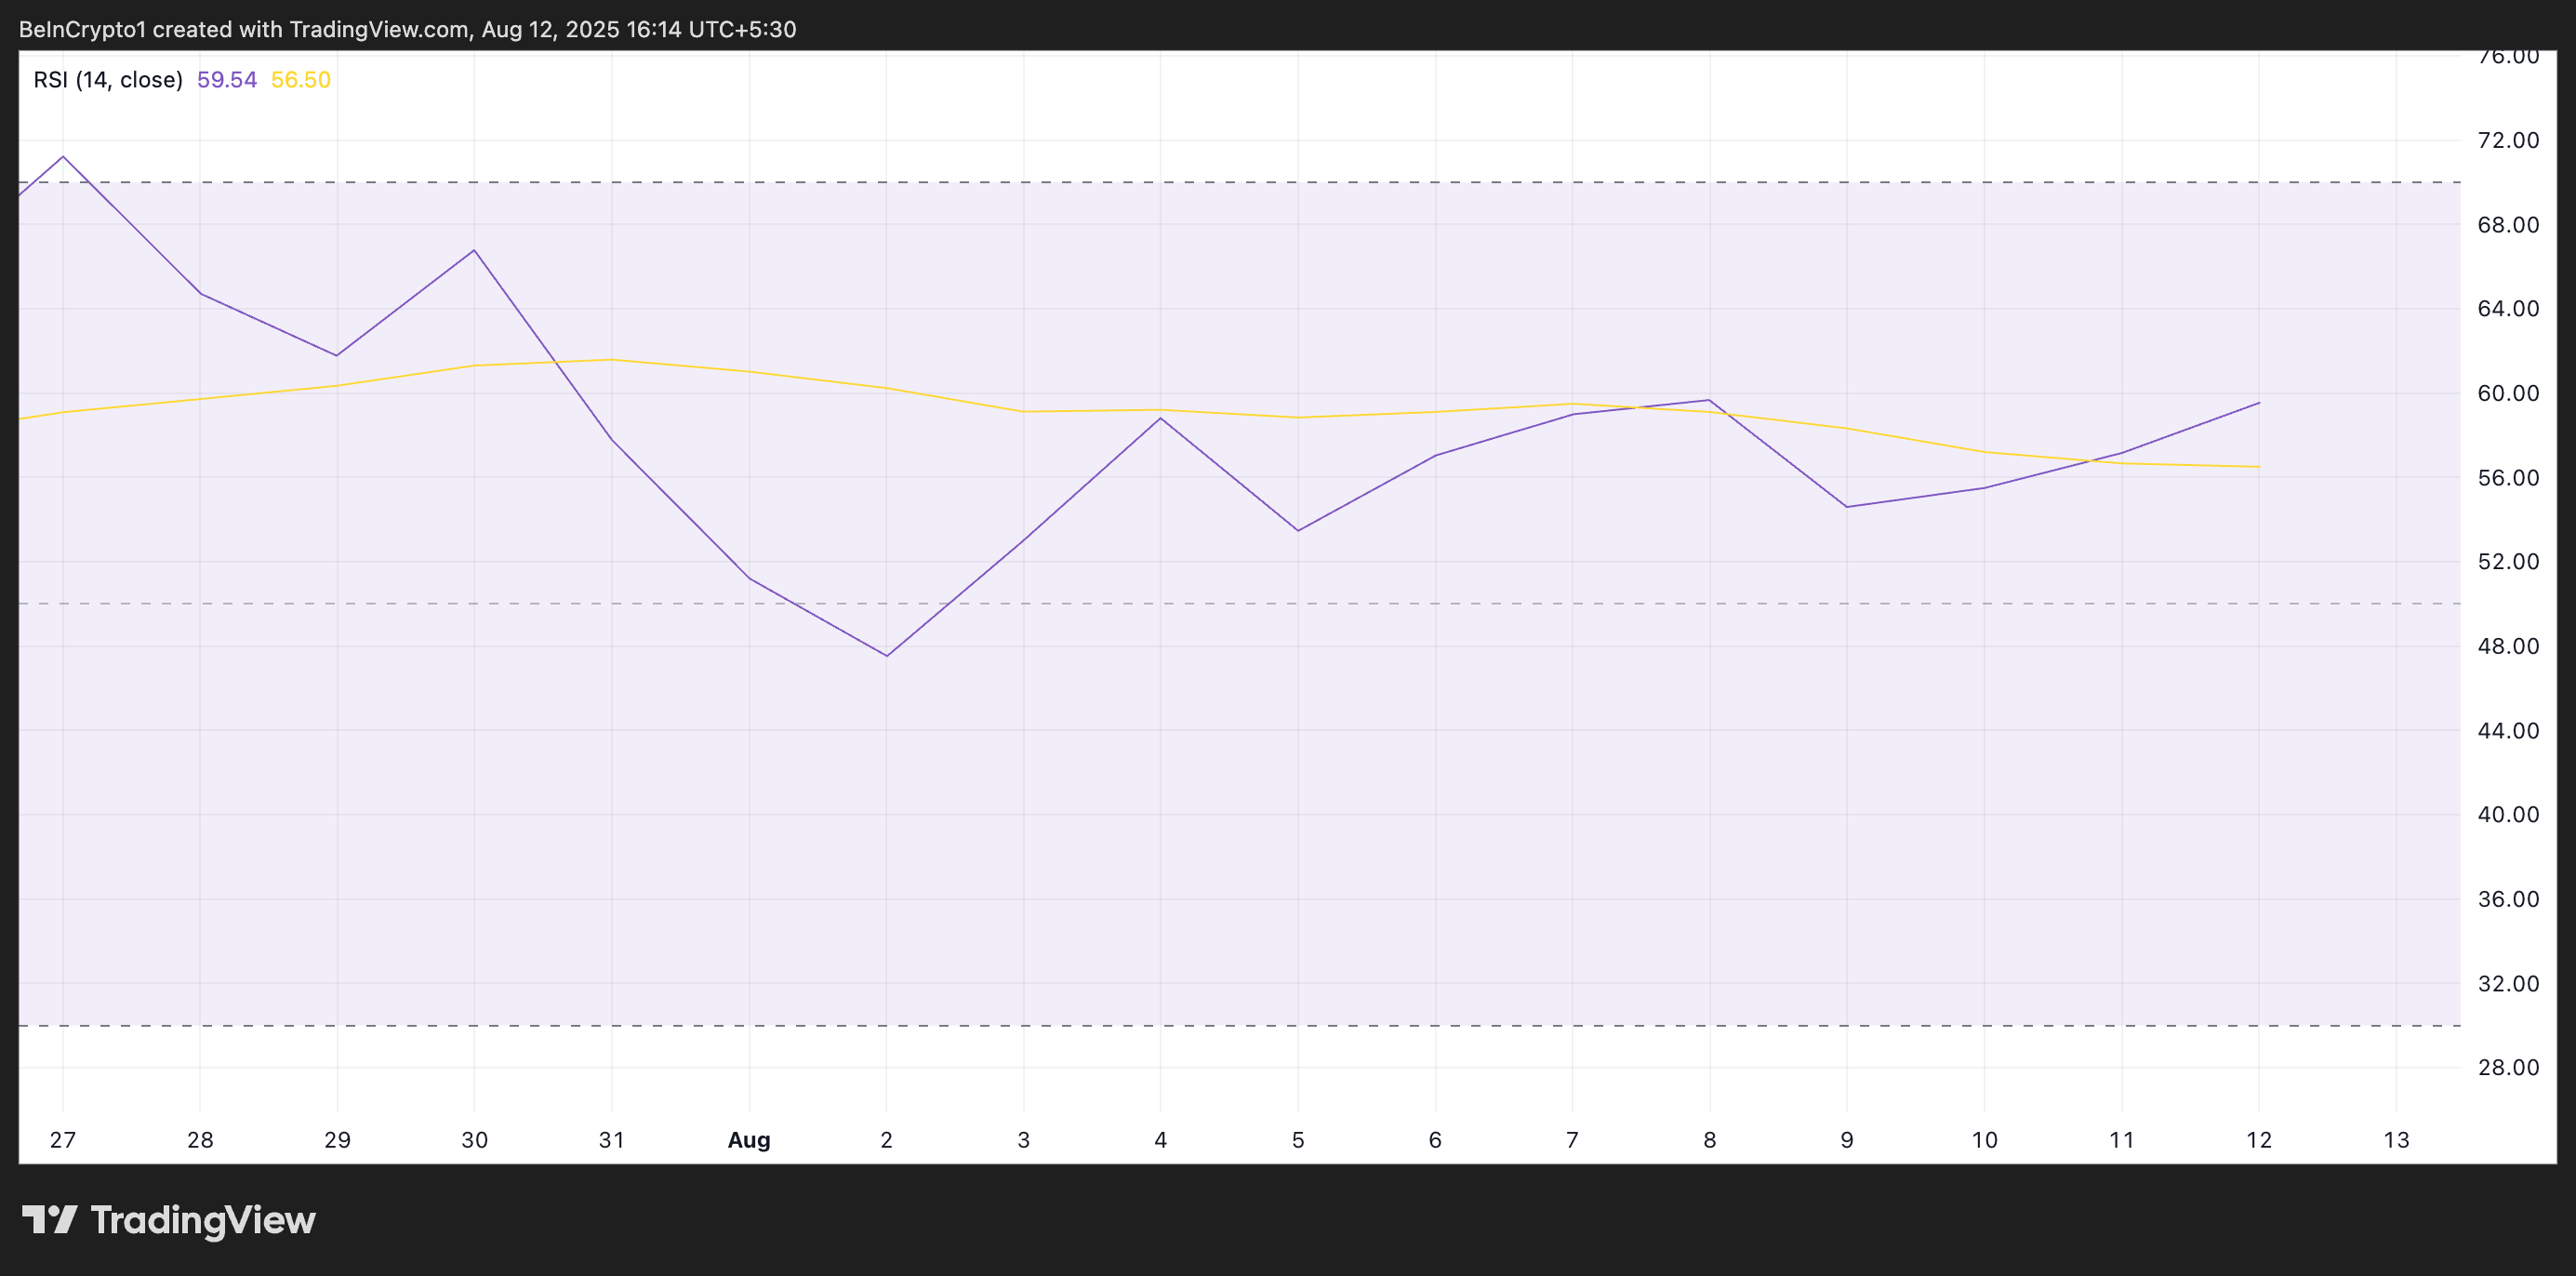
The RSI measures an asset’s overbought and oversold market conditions. It ranges between 0 and 100. Values above 70 suggest that the asset is overbought and could be due for a price correction, while values under 30 indicate that the asset is oversold and may be primed for a rebound.
At 59.54 and rising, BCH’s RSI reflects strengthening bullish momentum. If it remains below the overbought threshold of 70, a sustained RSI uptrend with improving market sentiment WOULD allow BCH’s price to see further upside.
Bitcoin Cash Poised for Breakout
Sustained buy-side pressure could push BCH’s price above the psychological $600 mark. If the altcoin establishes strong support NEAR this price level, it could extend its rally toward $602.20.
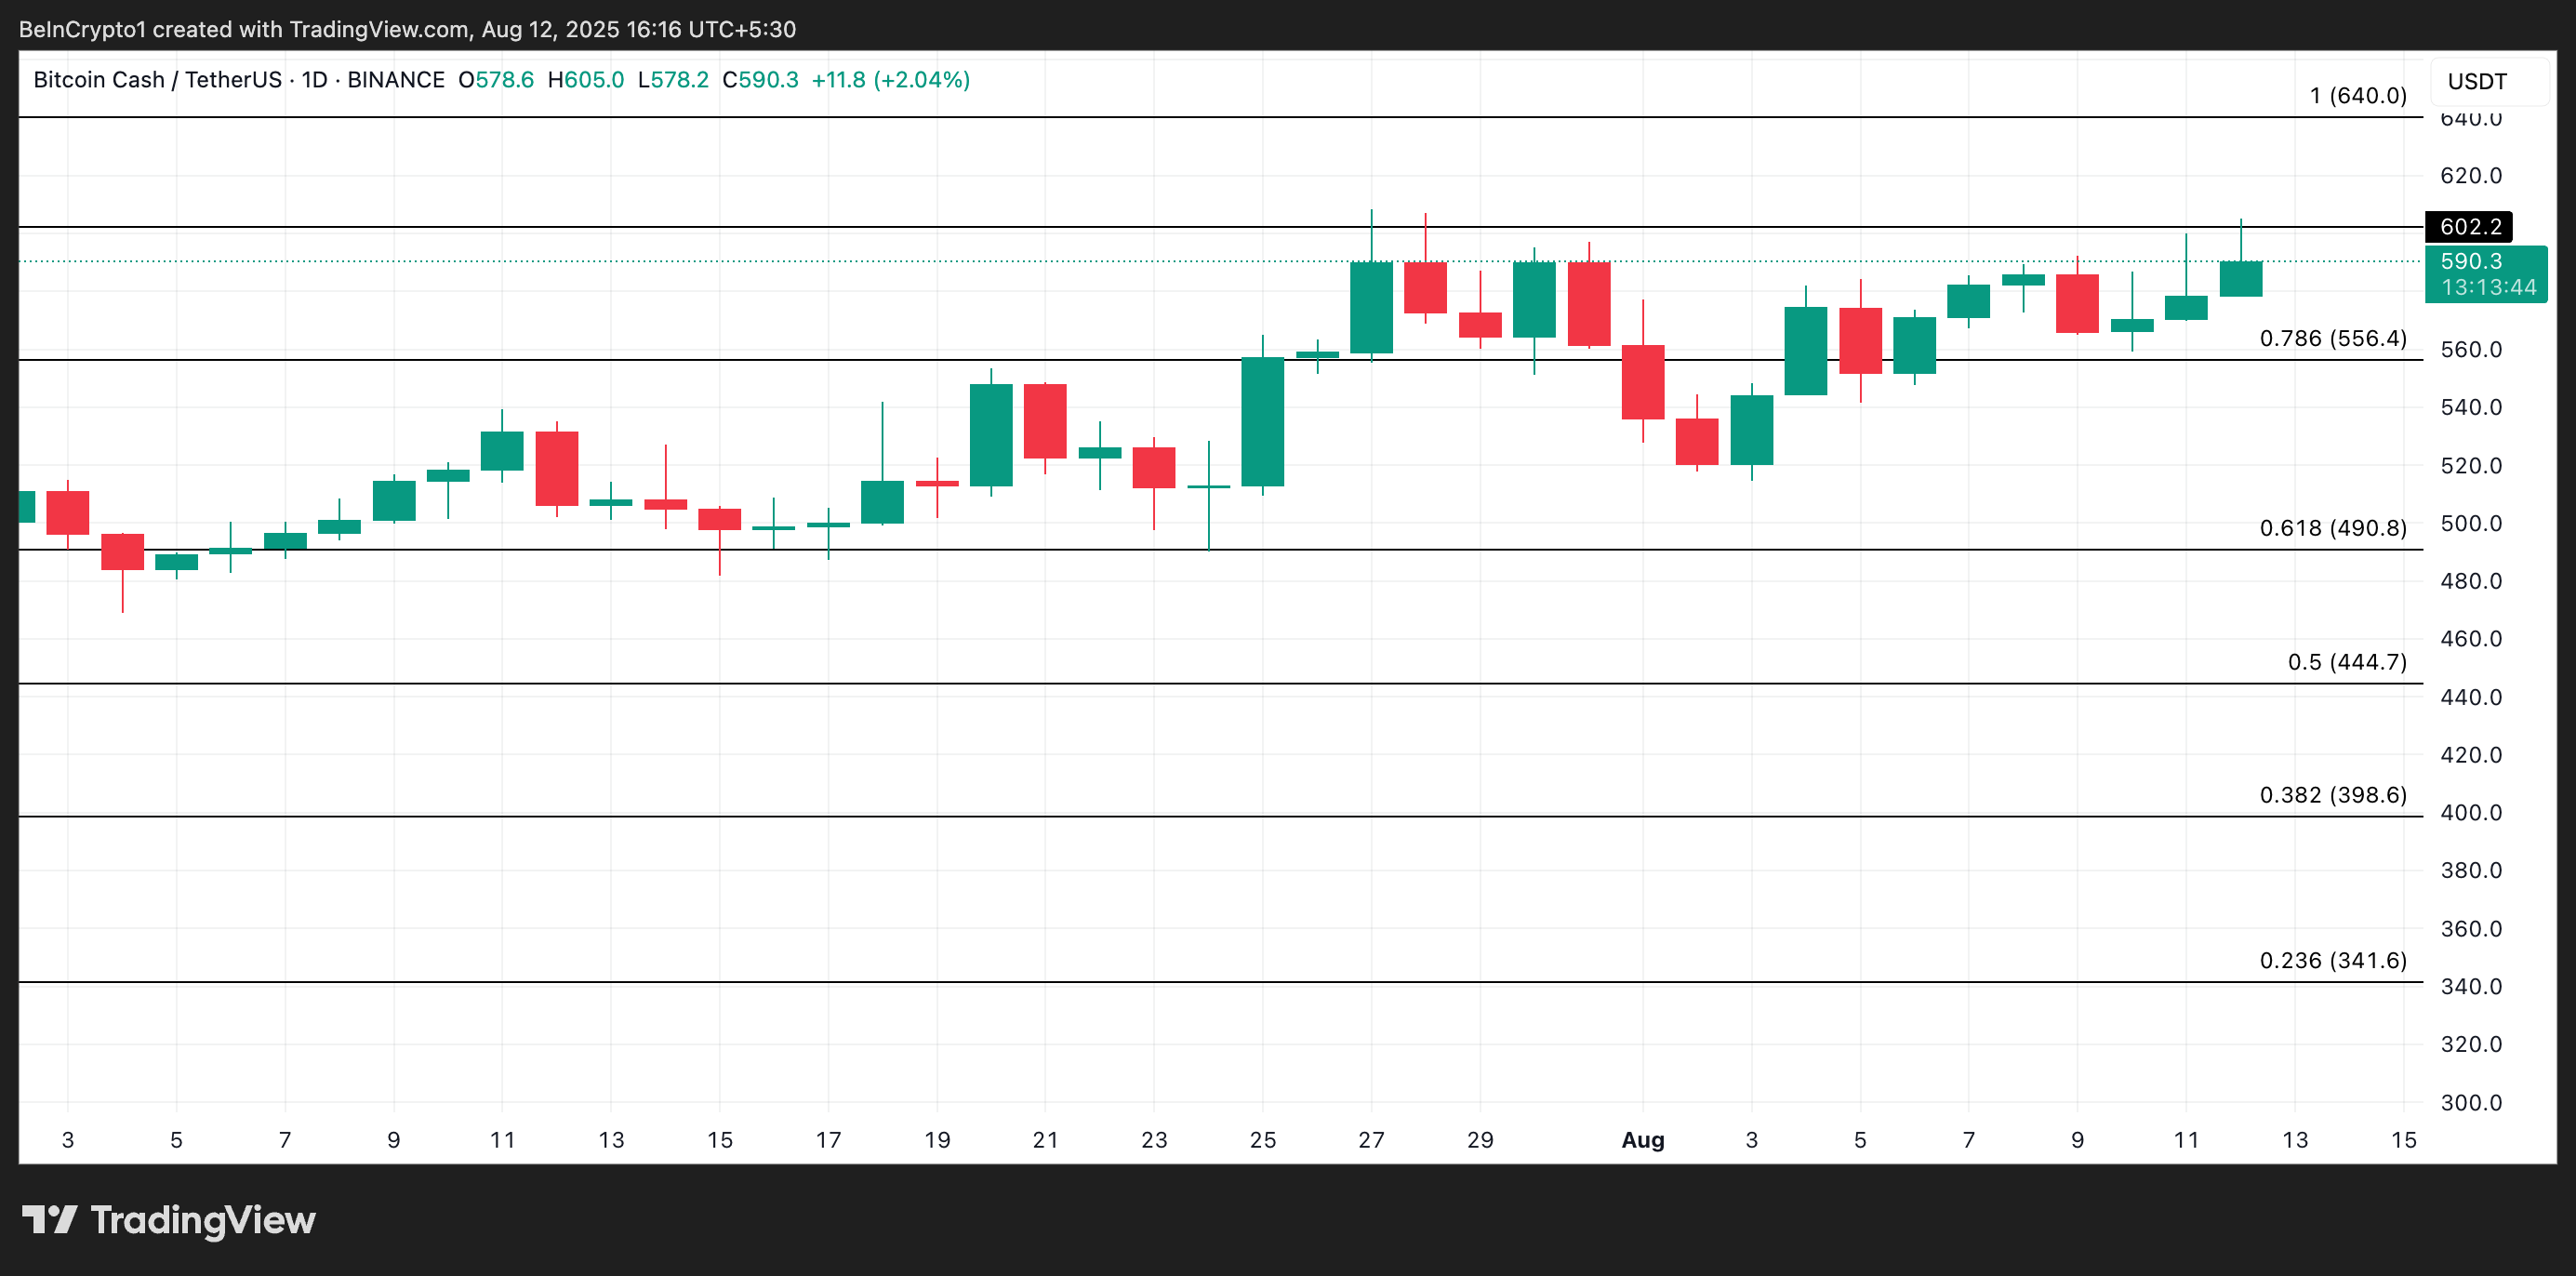
However, if profit-taking resumes, BCH eyes a decline to $556.40.
