Aptos (APT) Braces for Turbulence: $51 Million Unlock Threatens Further Downturn

Aptos holders, buckle up—the floodgates are opening.
The Layer 1 blockchain faces a critical stress test as $51 million worth of APT tokens hit the market. With unlocks historically acting as sell-pressure triggers, traders are eyeing exits.
### The Liquidity Tsunami
Token unlocks are crypto's version of 'be careful what you wish for'—projects beg for liquidity until they drown in it. Aptos now joins the club, with early investors and team members finally able to cash out their paper gains.
### Market Mechanics Don't Lie
More supply + stagnant demand = classic bearish equation. The unlock coincides with Aptos trading 60% below its all-time high—a perfect storm for continuation plays.
### The Silver Lining Playbook
Volatility creates opportunity. If APT weathers the sell-off without collapsing, it could signal strong accumulation—just in time for the next hype cycle. After all, what's crypto without a little schadenfreude?
Aptos Price Weakens Amid Rising Selling Activity
APT currently trades at $4.58, noting a 2% decline over the past 24 hours. During this same period, its trading volume has increased by 10%, indicating a rise in the number of coins changing hands.
: Want more token insights like this? Sign up for Editor Harsh Notariya’s Daily crypto Newsletter here.
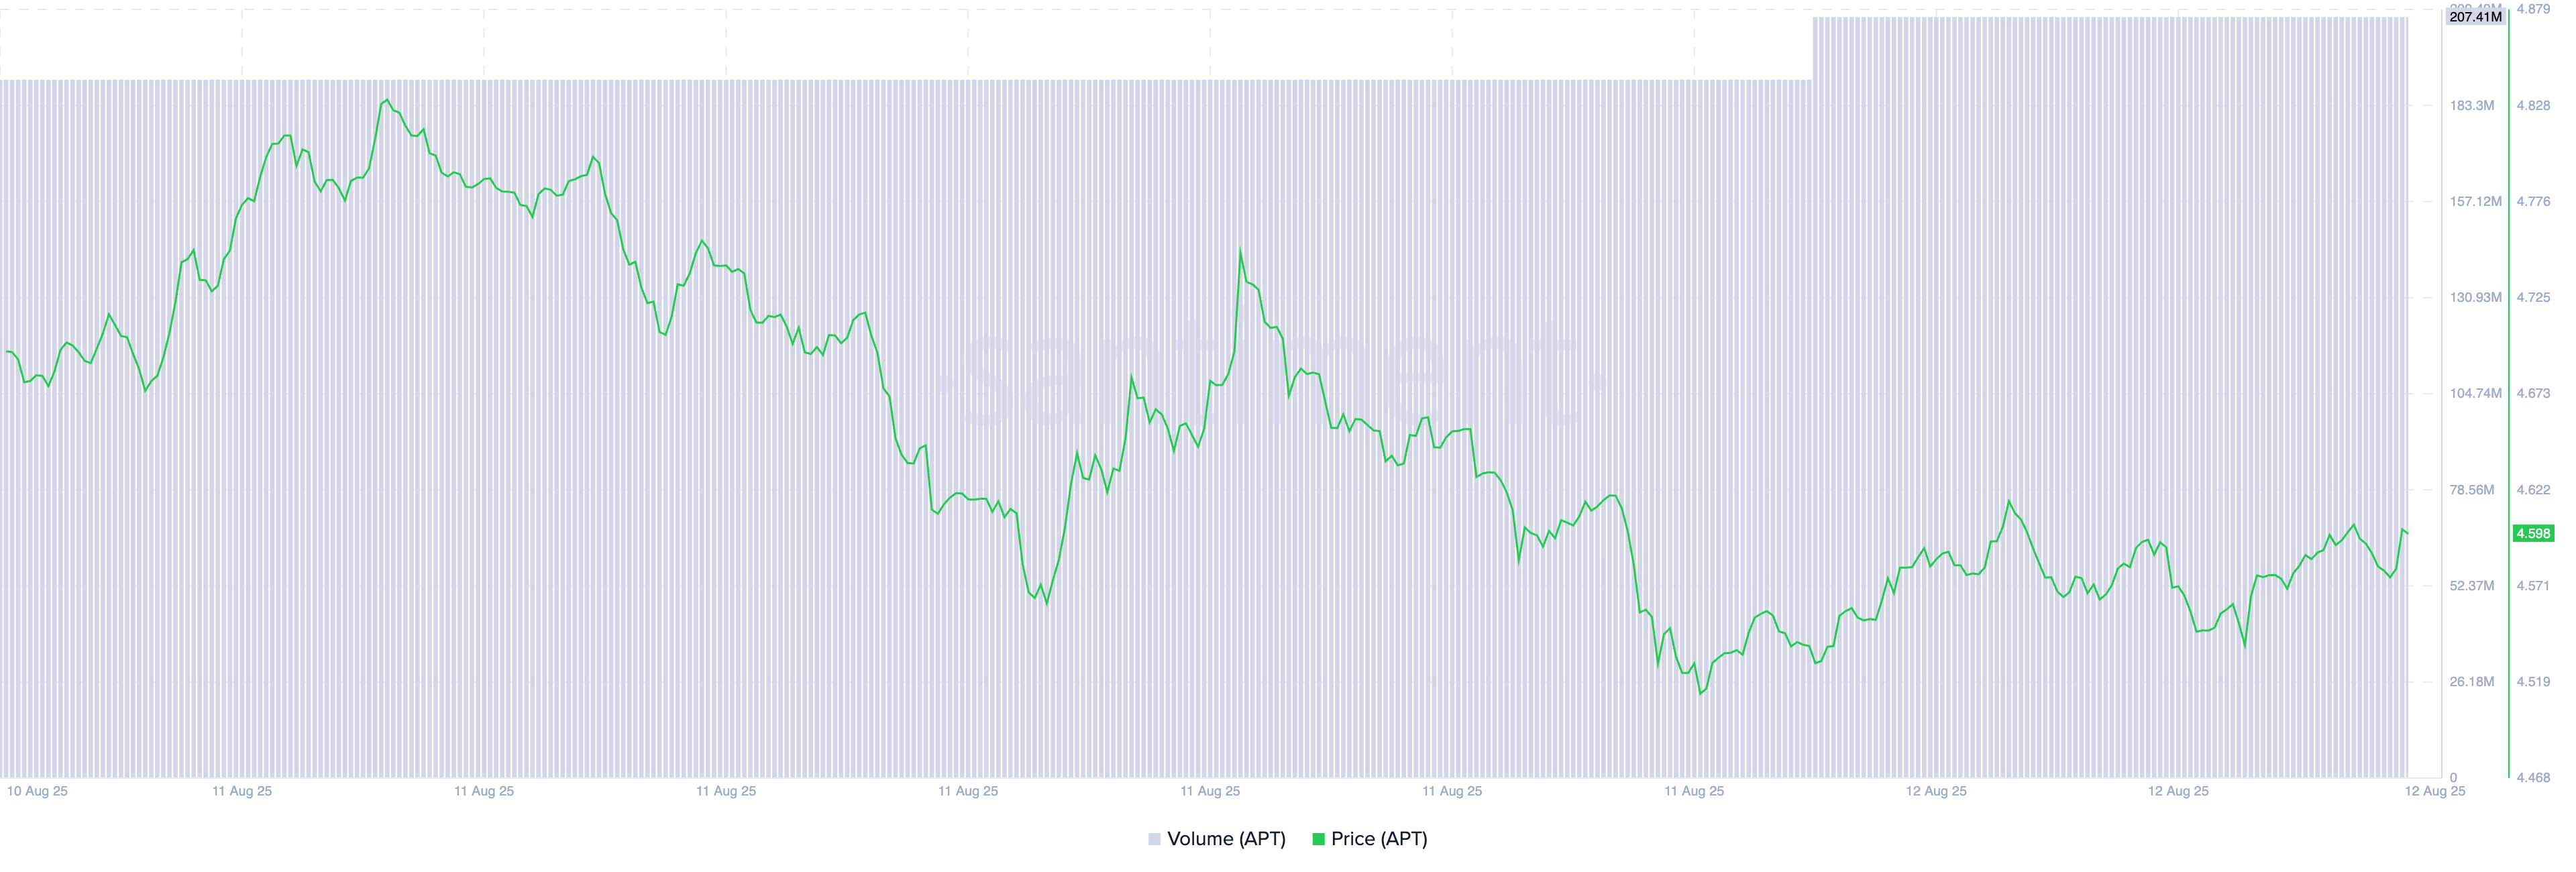
When an asset’s price falls while trading volume climbs, it signals heightened selling pressure. This pattern suggests that more investors are offloading their positions rather than buying. Hence, the trend signals that the APT market is experiencing stronger downward momentum with rising seller dominance.
In addition, the coin’s falling long/short ratio supports this bearish outlook. Observed on an hourly chart, this sits at 0.69 at press time.
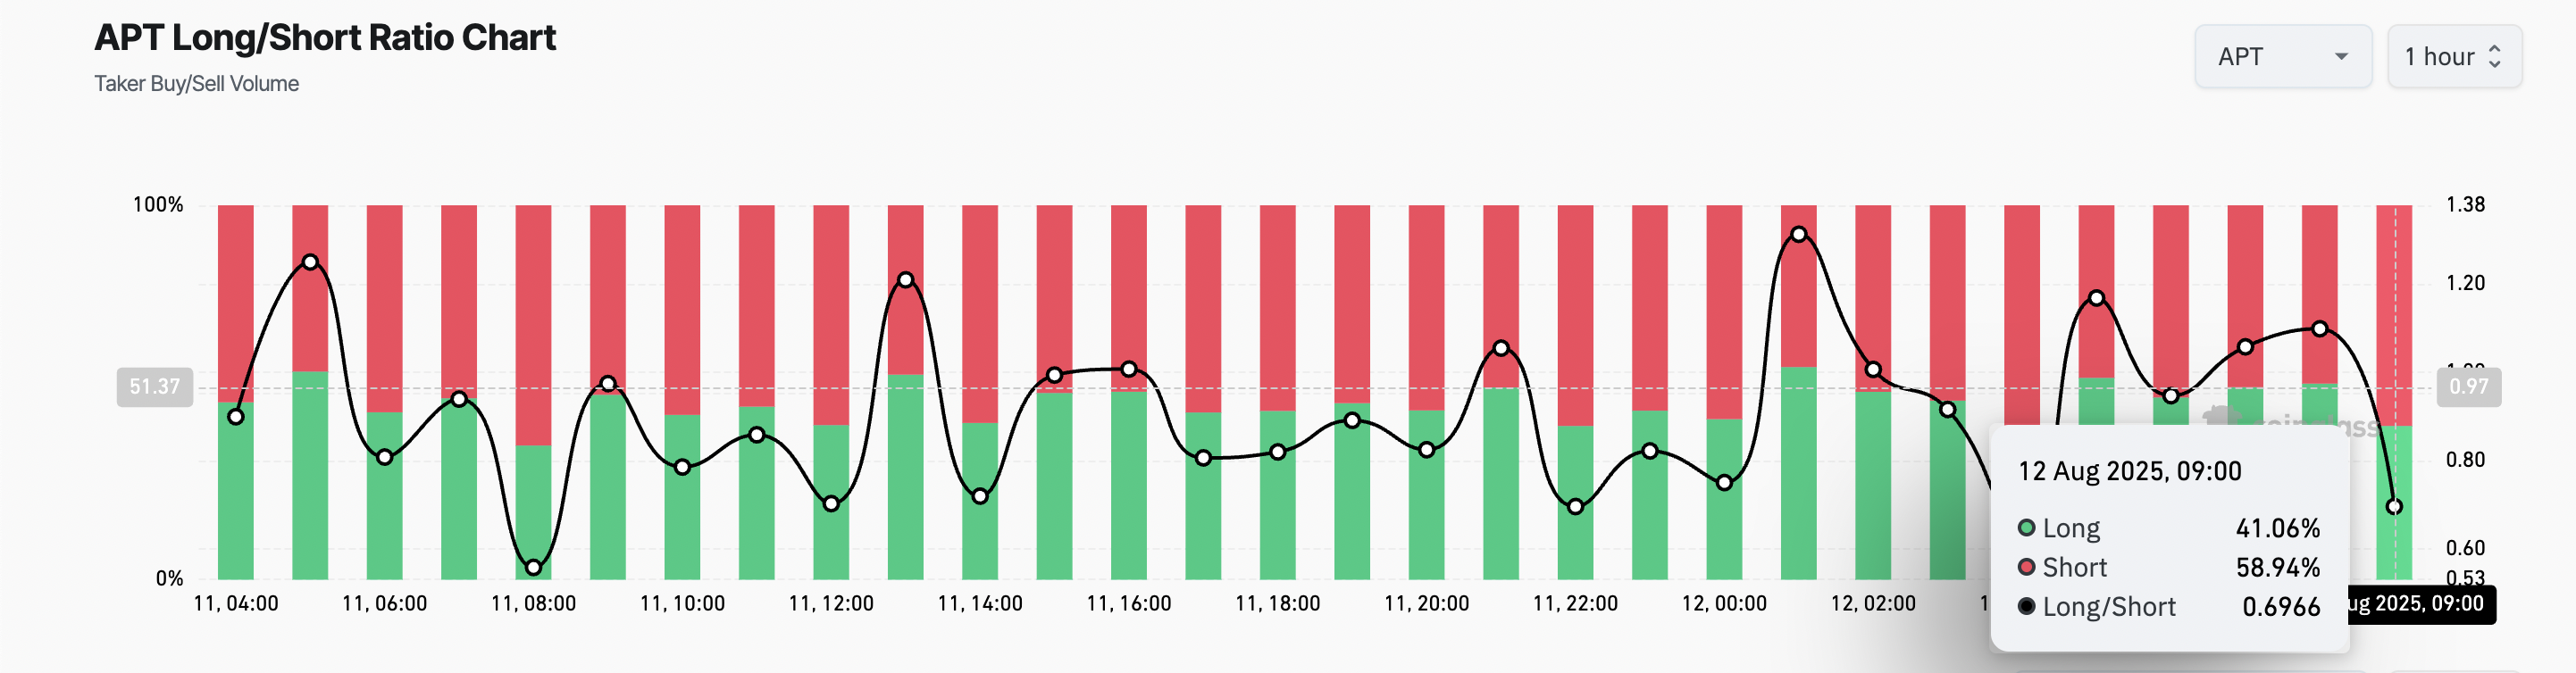
The long/short metric measures the proportion of long bets to short ones in an asset’s futures market. A ratio above one signals more long positions than short ones. This indicates a bullish sentiment, as most traders expect the asset’s value to rise.
On the other hand, a long/short ratio below 1 means that more traders are betting on the asset’s price to decline than those expecting it to rise.
APT’s long/short ratio indicates increasing demand for short positions, as traders position themselves to capitalize on the growing downward pressure.
Can Aptos Hold the Line?
On the daily chart, APT currently trades at its 20-day Exponential Moving Average (EMA). This puts the altcoin at significant risk, where the direction it takes next could set the tone for its near-term price action.
The 20-day EMA measures an asset’s average price over the past 20 trading days, giving weight to recent prices. When an asset climbs above it, it signals strengthening momentum and a potential uptrend, indicating that buyers are gaining control.
Conversely, falling below this level suggests weakening momentum and a possible shift toward bearish sentiment, with sellers taking the lead.
If APT’s price breaks decisively below the 20-day EMA, it WOULD confirm that the bears have regained full market control. Such a move could trigger further selling pressure, pushing APT’s price down under $4.52.
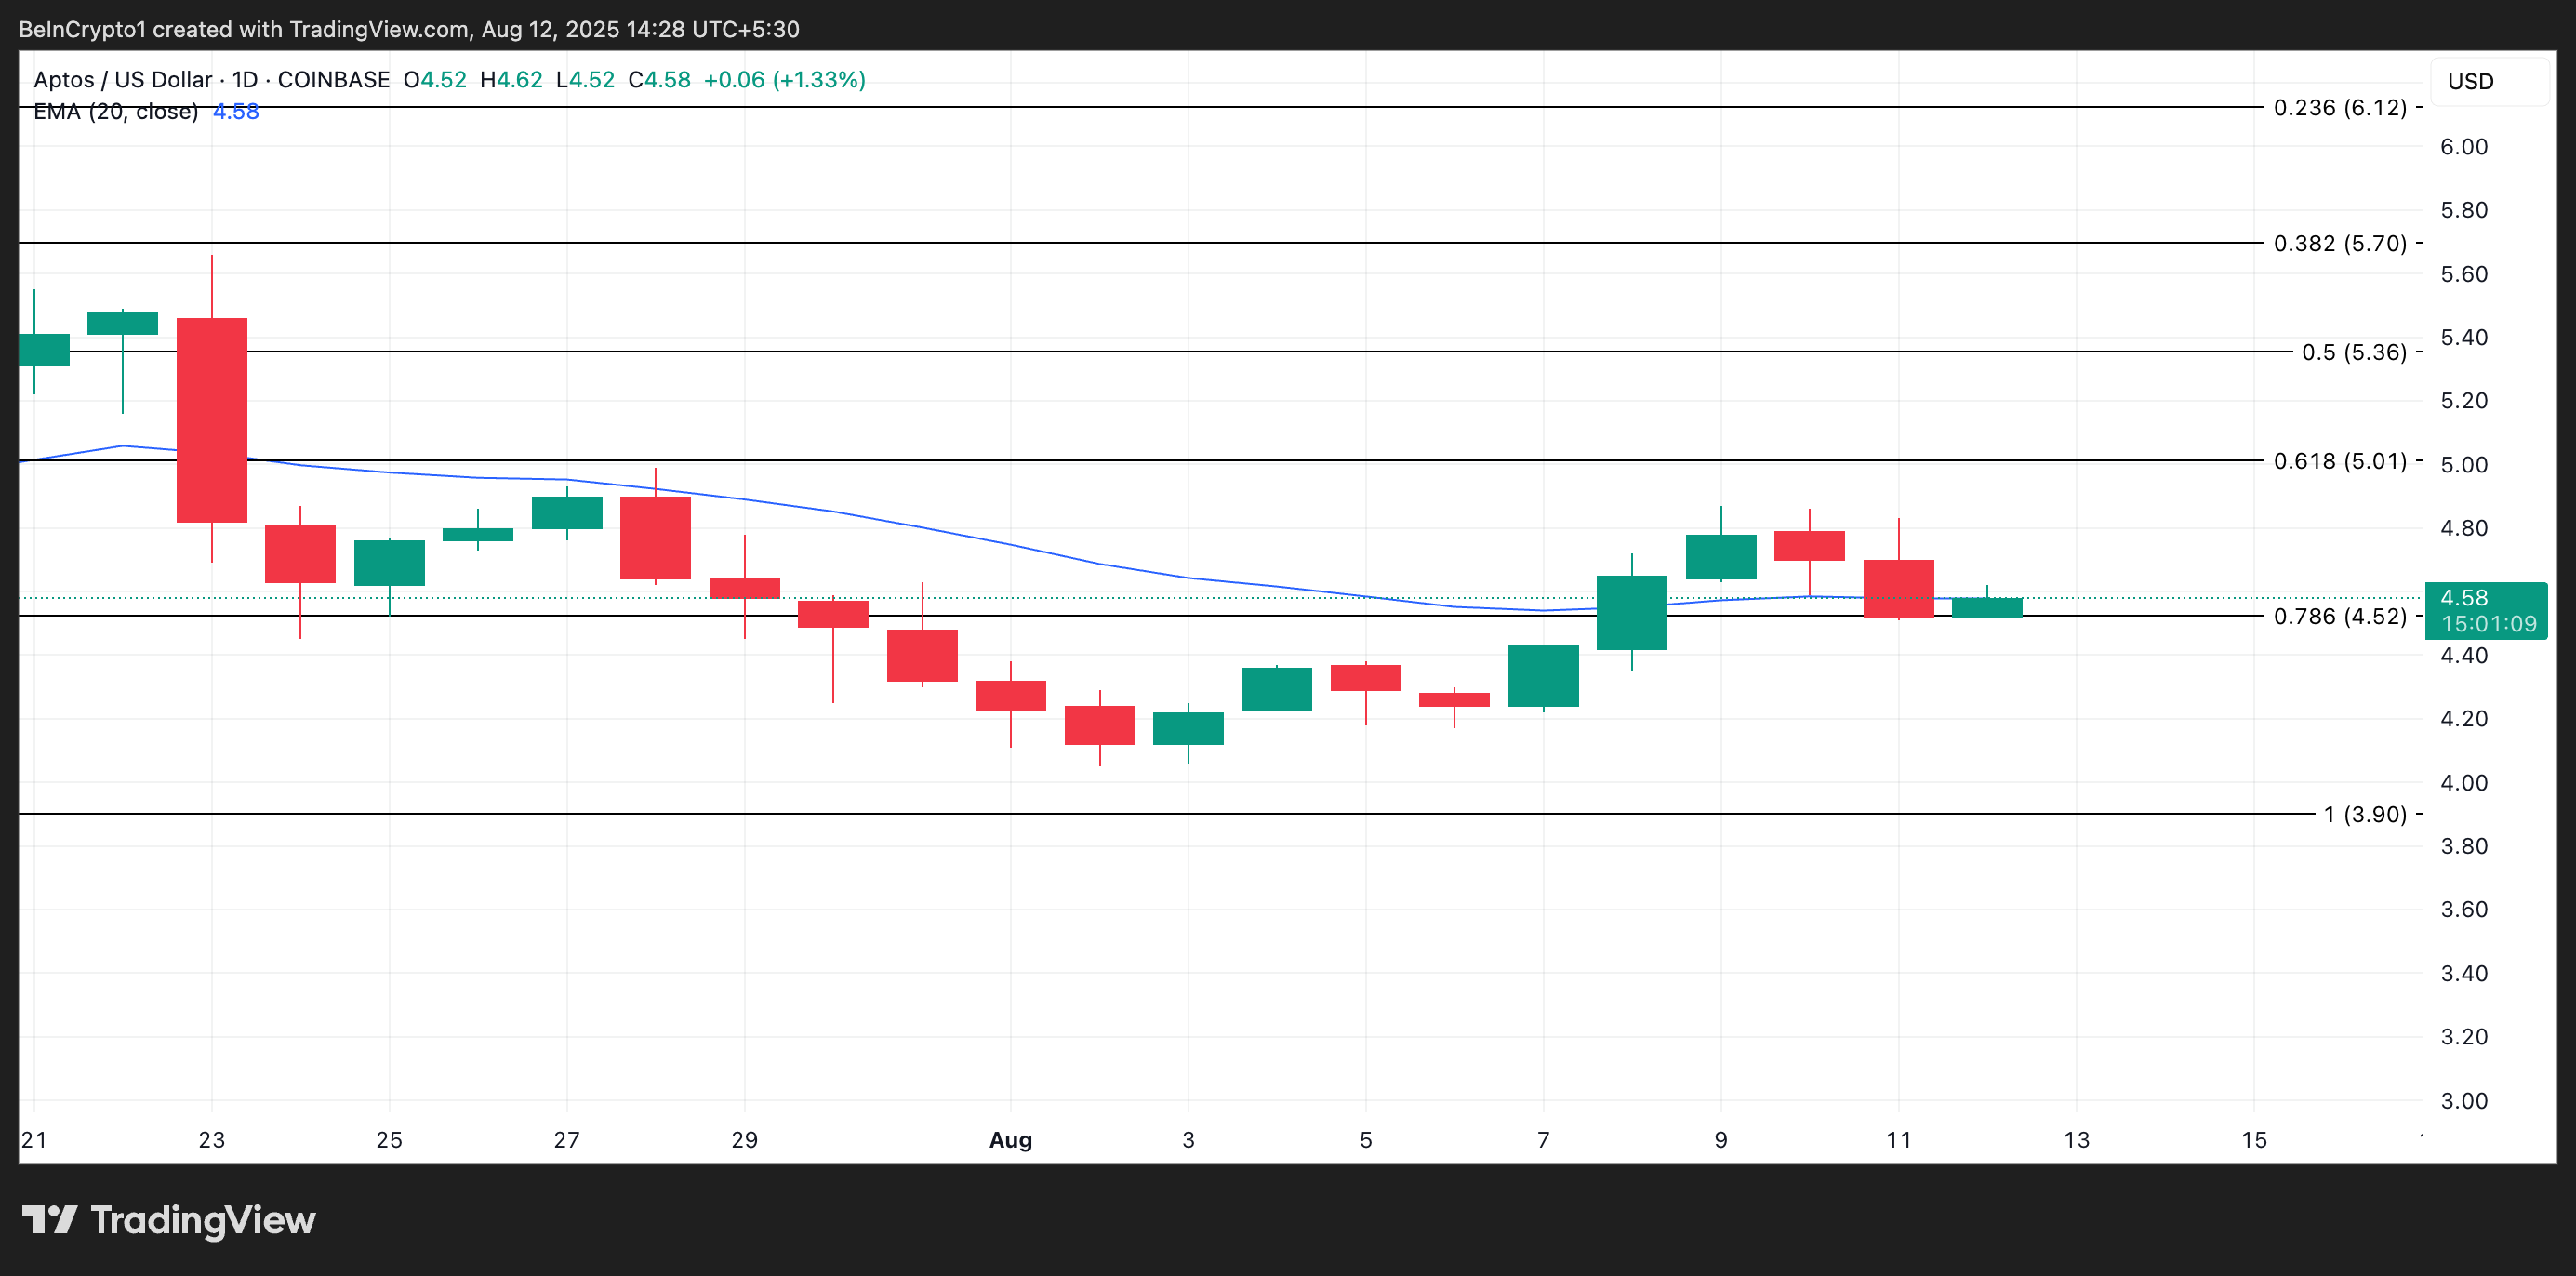
Conversely, if the 20-day EMA holds firm as a support floor, it could provide the foundation for a price rebound. Buyers stepping in at this level may drive APT’s price above $5.01.
