🚀 ENA Price Poised for Explosive Rally as Breakout Looms—Bullish Signal Flips Green

ENA's chart is printing a textbook breakout pattern—and one key indicator just flashed its first buy signal in weeks. Traders are stacking longs before the next leg up.
### The Technical Setup: Why This Rally Has Room to Run
Ascending triangle? Check. Bullish divergence on the RSI? Double-check. ENA’s price action mirrors its march to previous all-time highs, but with one difference: spot volumes are 30% higher this time. Meme coin vibes without the meme coin risk? Traders’ll take it.
### The Cynic’s Corner: ‘Number Go Up’ Meets Real Utility
Let’s be real—half the degens chasing this pump couldn’t explain ENA’s tokenomics if their leverage depended on it (and hey, maybe it does). But when a project’s got actual revenue-sharing and institutional backers? Even the suits might FOMO.
Bottom line: This isn’t some dog-themed casino play. ENA’s liquidity pools and governance perks give it staying power—assuming crypto winter doesn’t suddenly arrive in August. Watch that breakout level like a hawk.
Net Flows Flip Bullish as Selling Pressure Eases
After a 30% rally over the past week, ENA saw a brief phase of retail profit-taking. Exchange net flows turned positive for three sessions during the rally as traders sent coins to exchanges to sell, coinciding with a move from $0.63 to $0.85. It is worth mentioning that the ENA price did manage to touch $0.85 briefly, breaking past a key resistance.
However, it was the selling pressure that pushed the prices down.
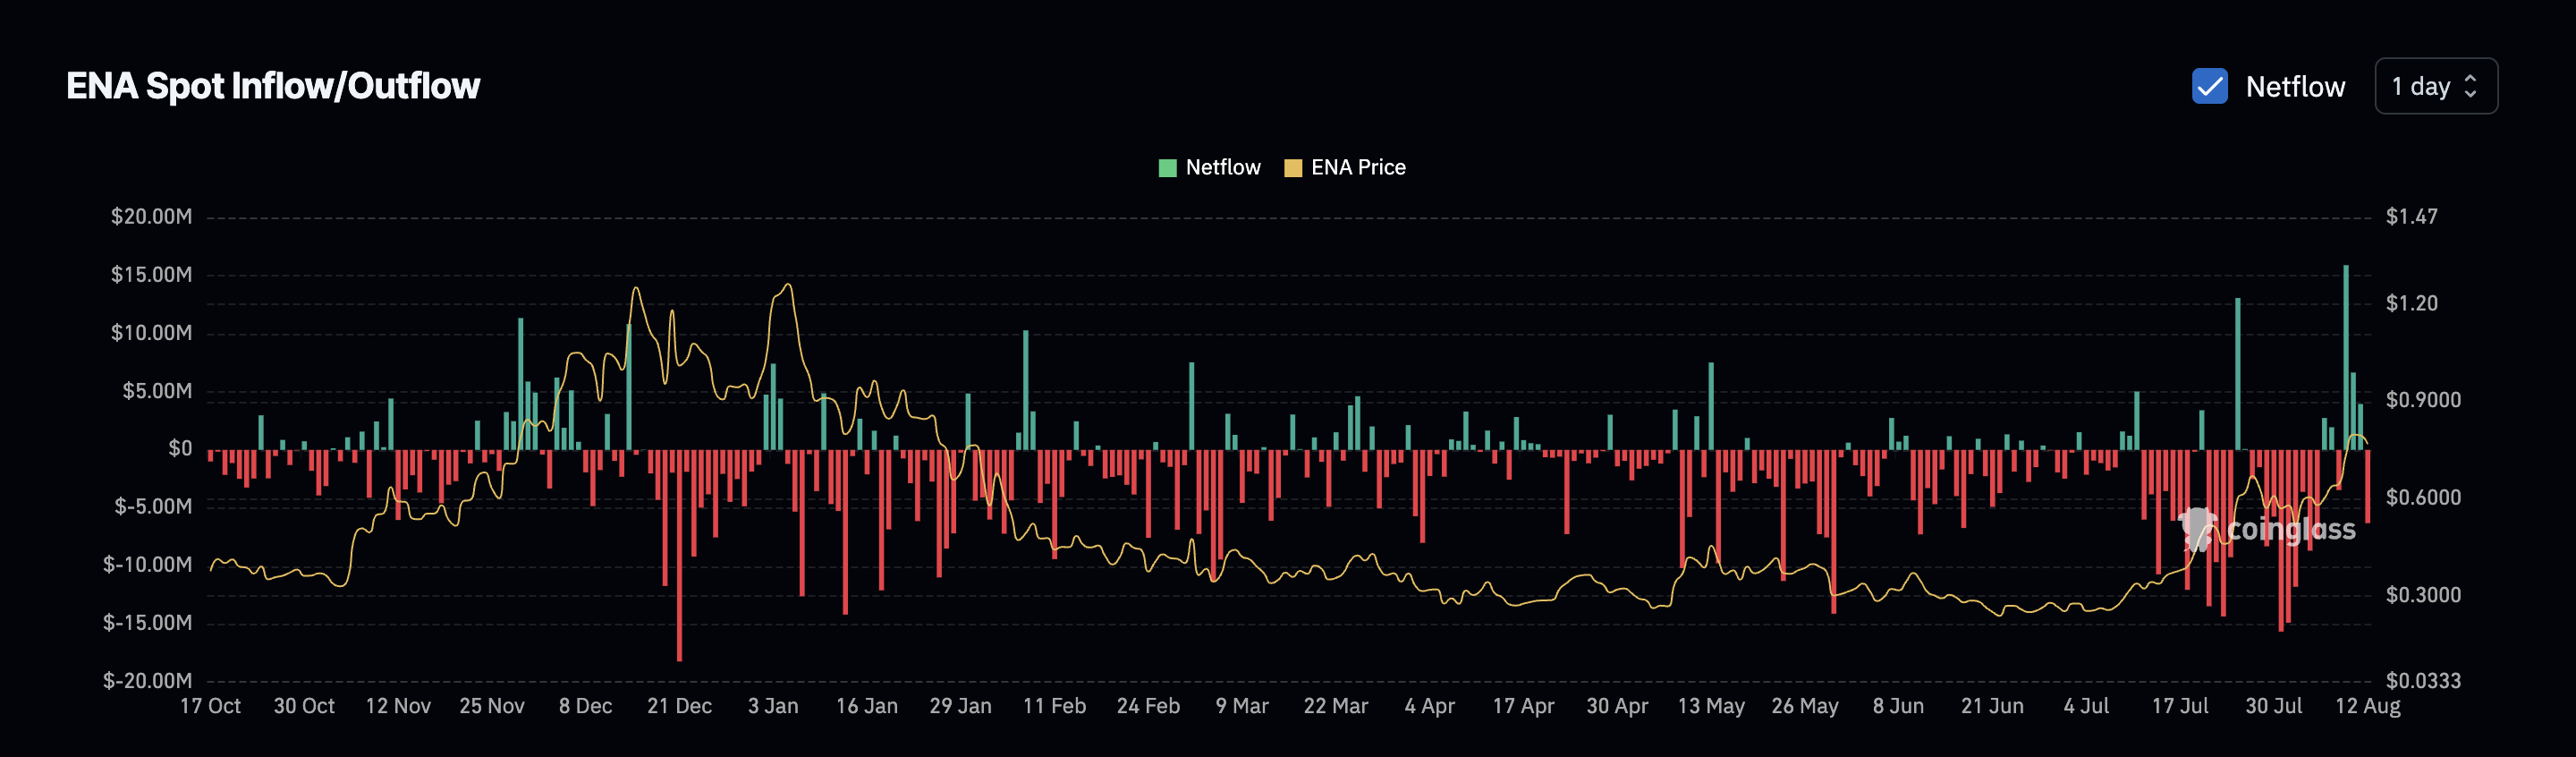
The selling pressure has since eased. Net flows have now flipped negative again at the time of writing, a sign that more ENA is leaving exchanges than entering, suggesting a shift back toward accumulation.
This flip to bullish flows comes right as the ENA price hovers at a critical resistance level, hinting that buying pressure could align with another breakout attempt.
Exchange Net Flows measure the difference between coins entering and leaving exchanges. Persistent negative flows typically indicate accumulation, while sustained positives can point to distribution.
Bulls Hold 30-Day Control; A Rare Sight
Perhaps the most telling metric is the Bull Bear Power indicator, which has shown uninterrupted bullish control for over 30 consecutive days. Even during minor dips, like the current 6% pullback, bears have failed to gain the upper hand.
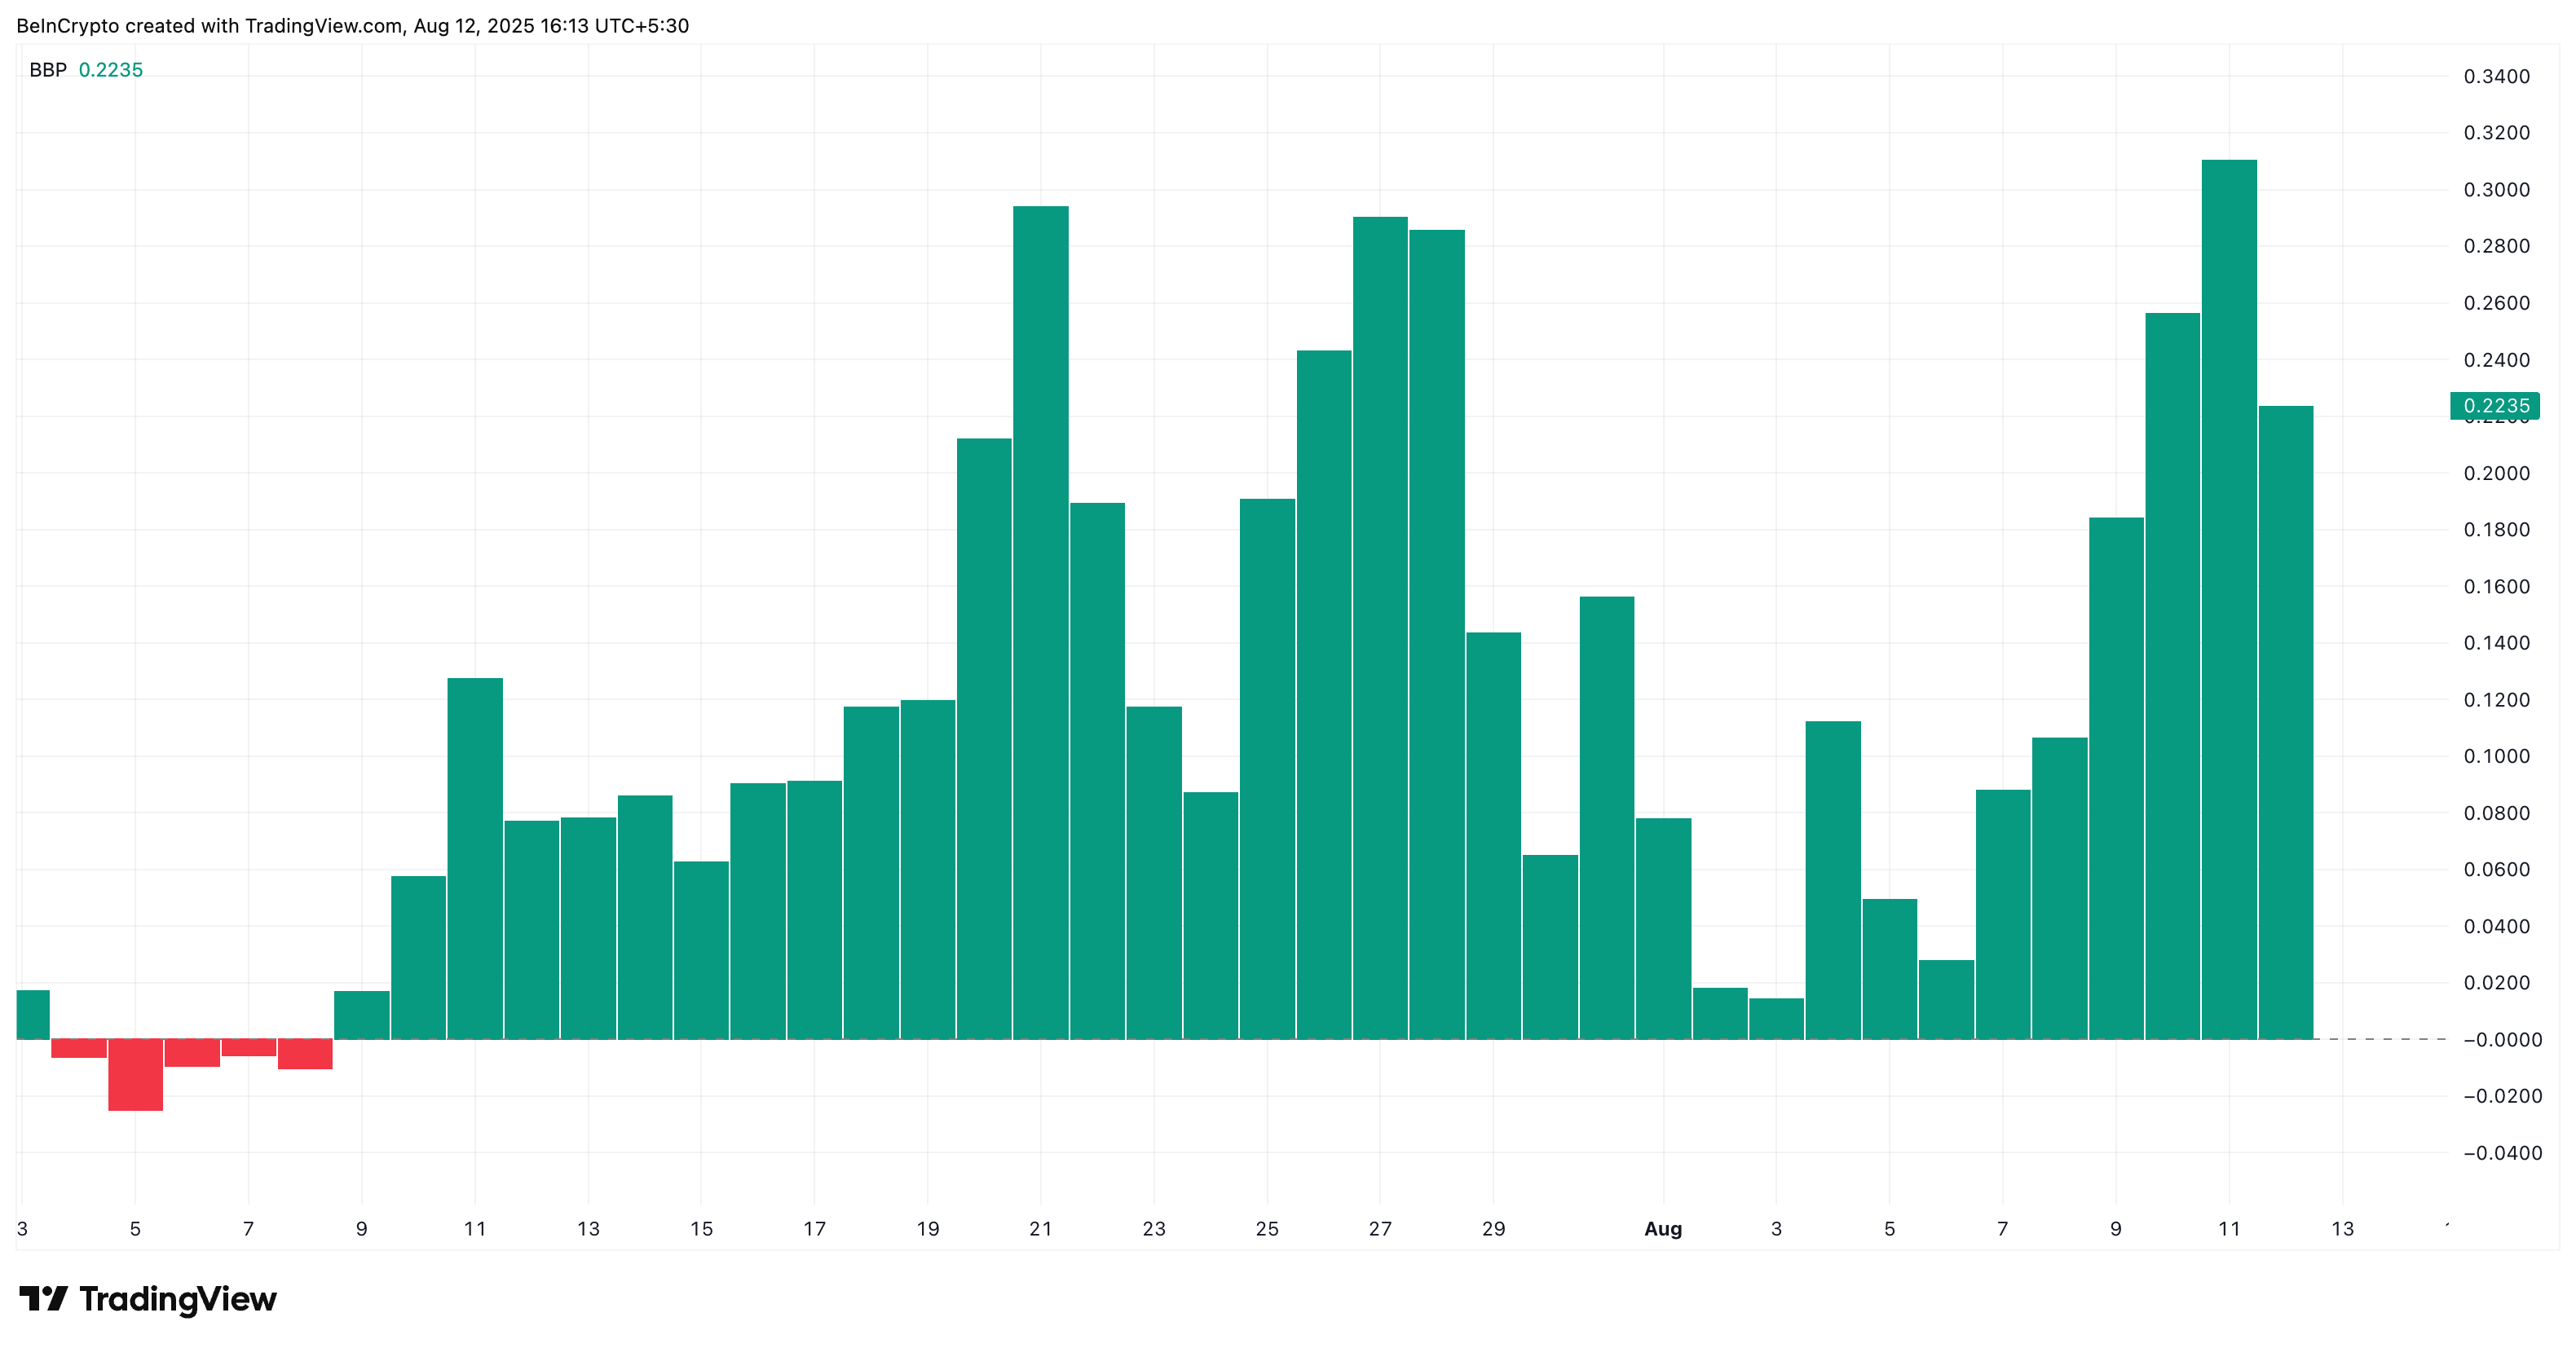
This kind of sustained bull dominance is rare, especially after such a strong rally, and suggests that the underlying bid remains strong. The combination of bulls staying in control while net flows turn negative builds a compelling case that ENA’s recent drop is more consolidation than reversal.
The Bull Bear Power indicator measures the balance of buying and selling pressure. Positive values show buyers dominating; negative values indicate sellers in control.
: Want more token insights like this? Sign up for Editor Harsh Notariya’s Daily crypto Newsletter here.
Ascending Triangle Eyes ENA Price Breakout Above $0.79
On the price chart, ENA has been consolidating in an ascending triangle, a bullish continuation pattern, with the upper boundary anchored around $0.79. The base of this triangle aligns closely with trend-based Fibonacci extension levels, which have acted as resistance levels in previous breakouts.
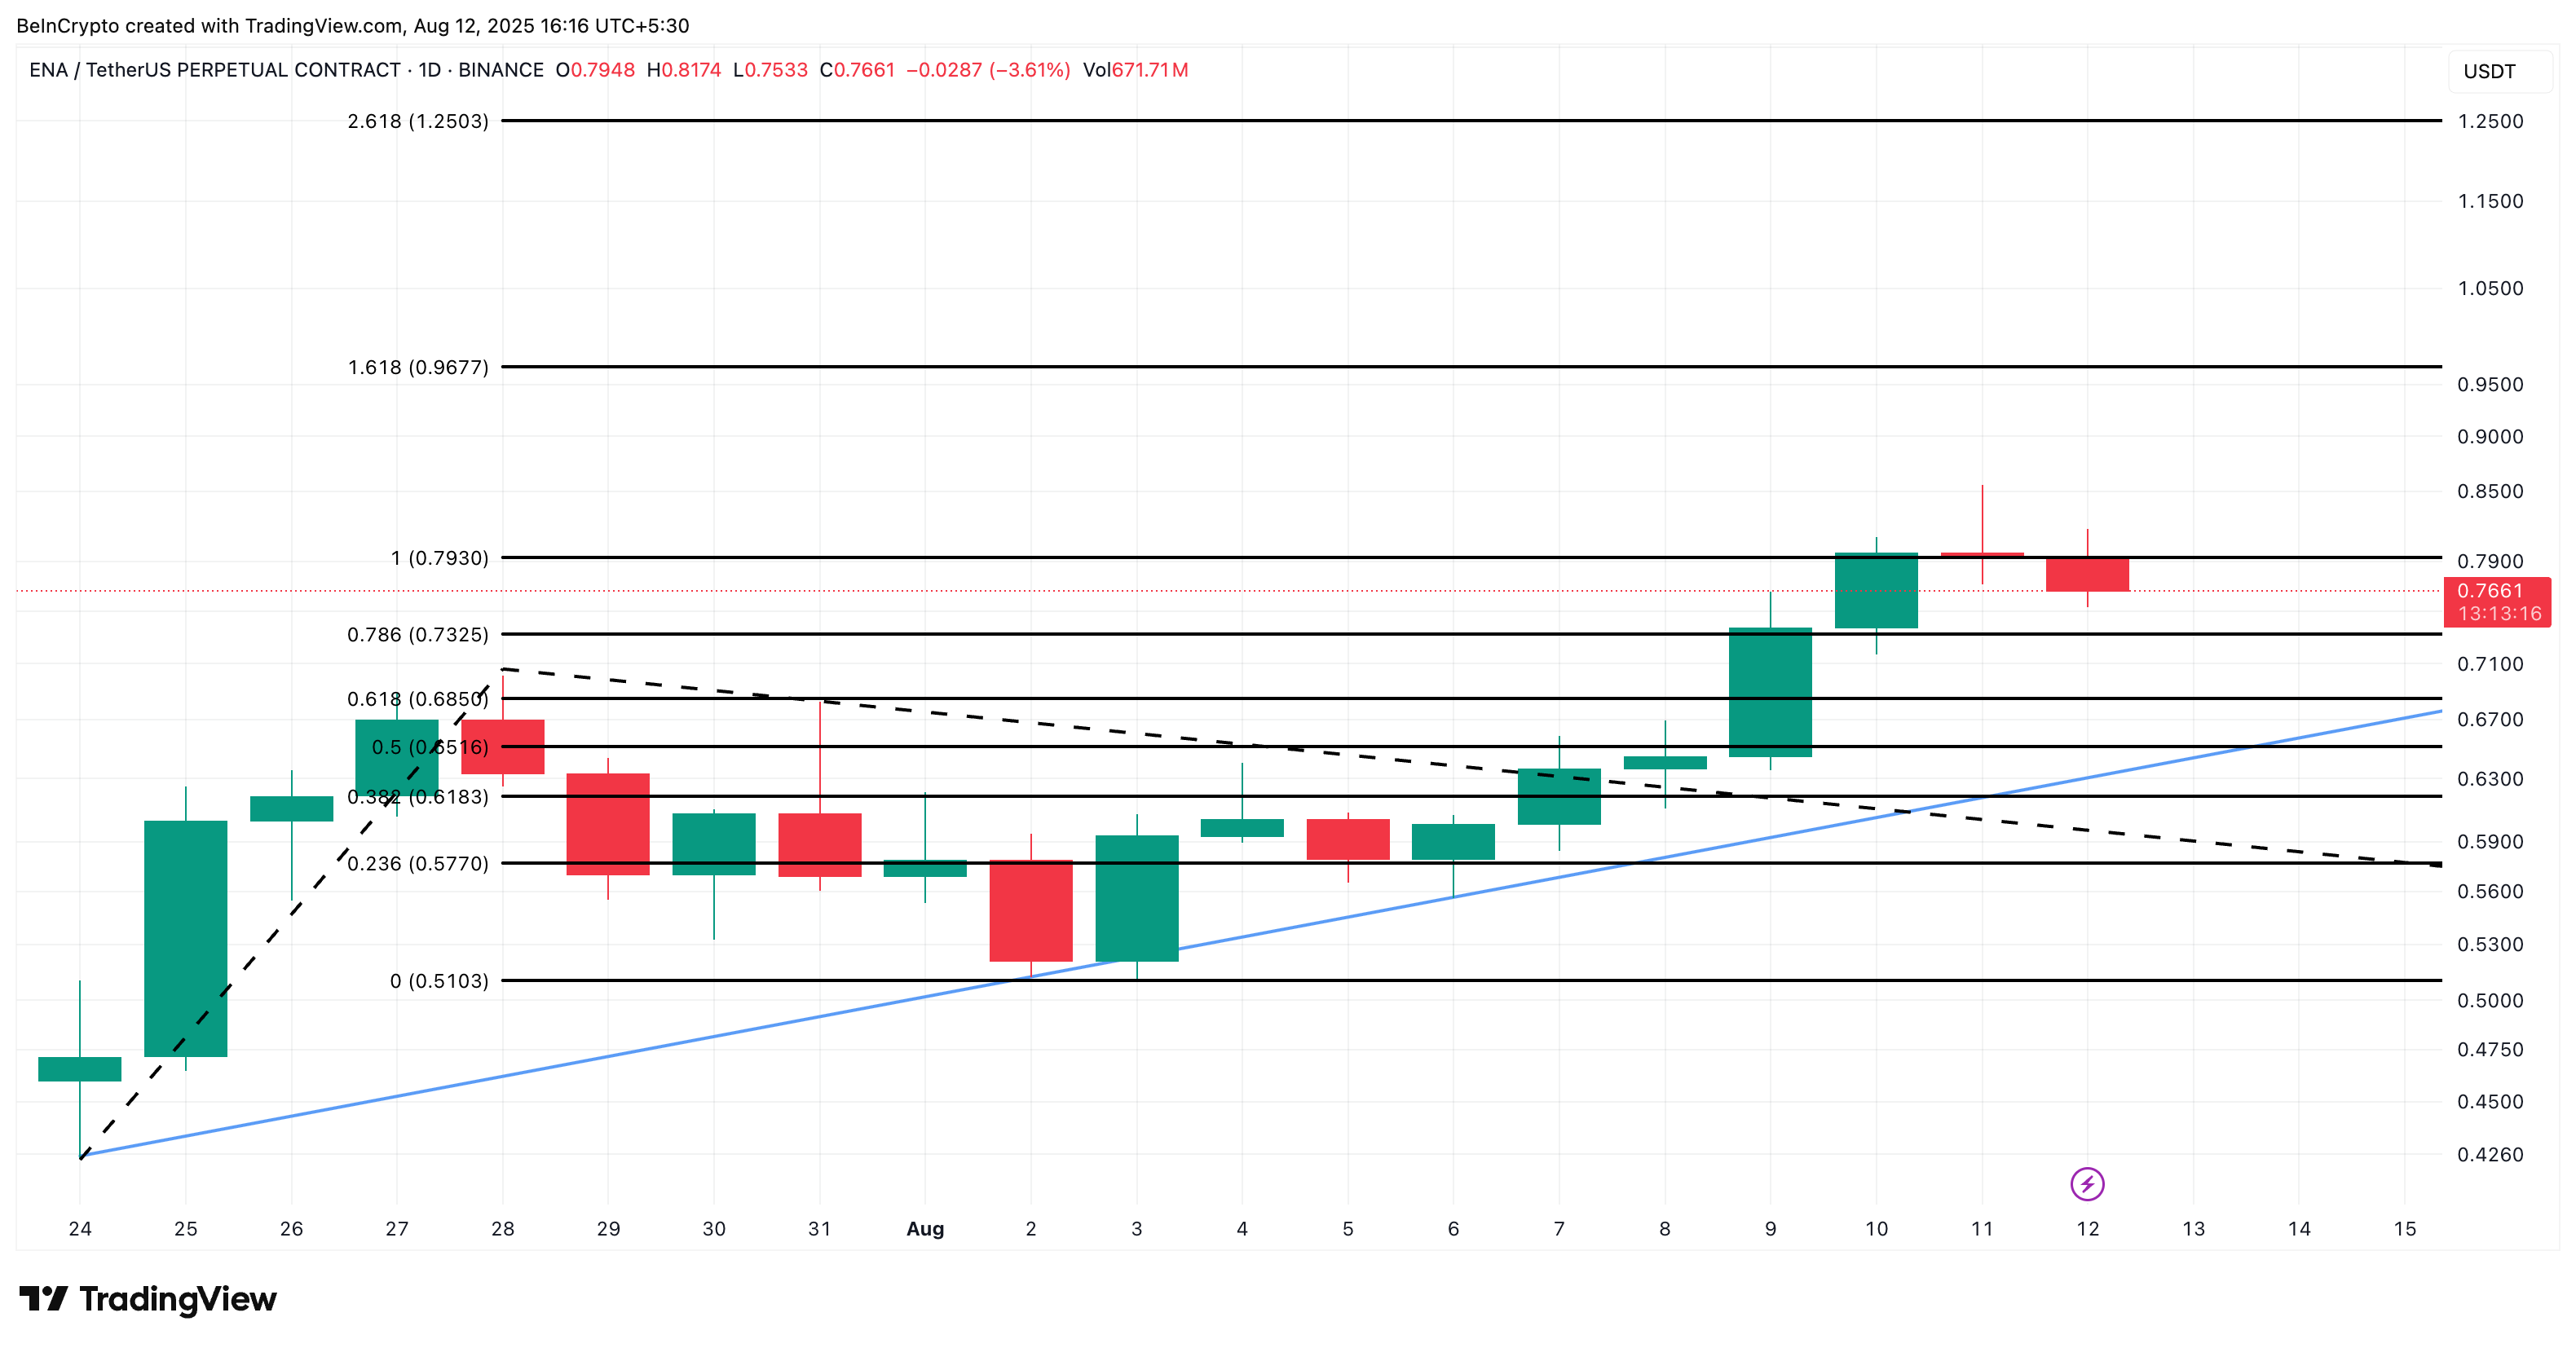
ENA has already respected and broken above multiple Fibonacci targets in this uptrend, but $0.79 has been a sticking point, rejecting the price in the last three sessions. If bulls can clear this, the next Fibonacci extensions point toward $0.96 and $1.25 as upside targets.
With bulls firmly in control and net flows now supporting accumulation, the breakout could be a matter of time.
An ascending triangle forms when rising lows push the price toward a flat resistance. A breakout above that resistance typically signals continuation in the prior trend.
The bullish setup WOULD weaken if the ENA price breaks below $0.73 and closes under this level, particularly if net flows flip back to positive territory and bull-bear power turns negative. That would suggest buyers are stepping aside and distribution is taking over.
