Solana’s $190 Breakout: 2 Catalysts Fueling the Next Leg Up

Solana's price action is flashing bullish signals—here's what could propel it past $190.
1. Institutional Demand Heats Up
Whale wallets are accumulating SOL at levels not seen since the 2021 bull run. On-chain data shows a 37% spike in large transactions (>$1M) this month alone.
2. Network Activity Defies Market Slump
Daily active addresses remain above 1.2M despite recent market turbulence—proving real usage isn't just speculators playing hot potato with NFTs.
The smart money's betting this isn't another dead cat bounce. Though if history repeats, Wall Street will probably 'discover' Solana just in time to sell the top.
Solana Traders Place Big Bets on Upward Momentum
Firstly, on-chain data shows a notable drop in SOL’s Liveliness in the past 14 days. This metric, which tracks the movement of previously dormant tokens, dropped to 0.764 yesterday, indicating a dip in SOL sell-offs among its long-term holders.
: Want more token insights like this? Sign up for Editor Harsh Notariya’s Daily Crypto Newsletter here.
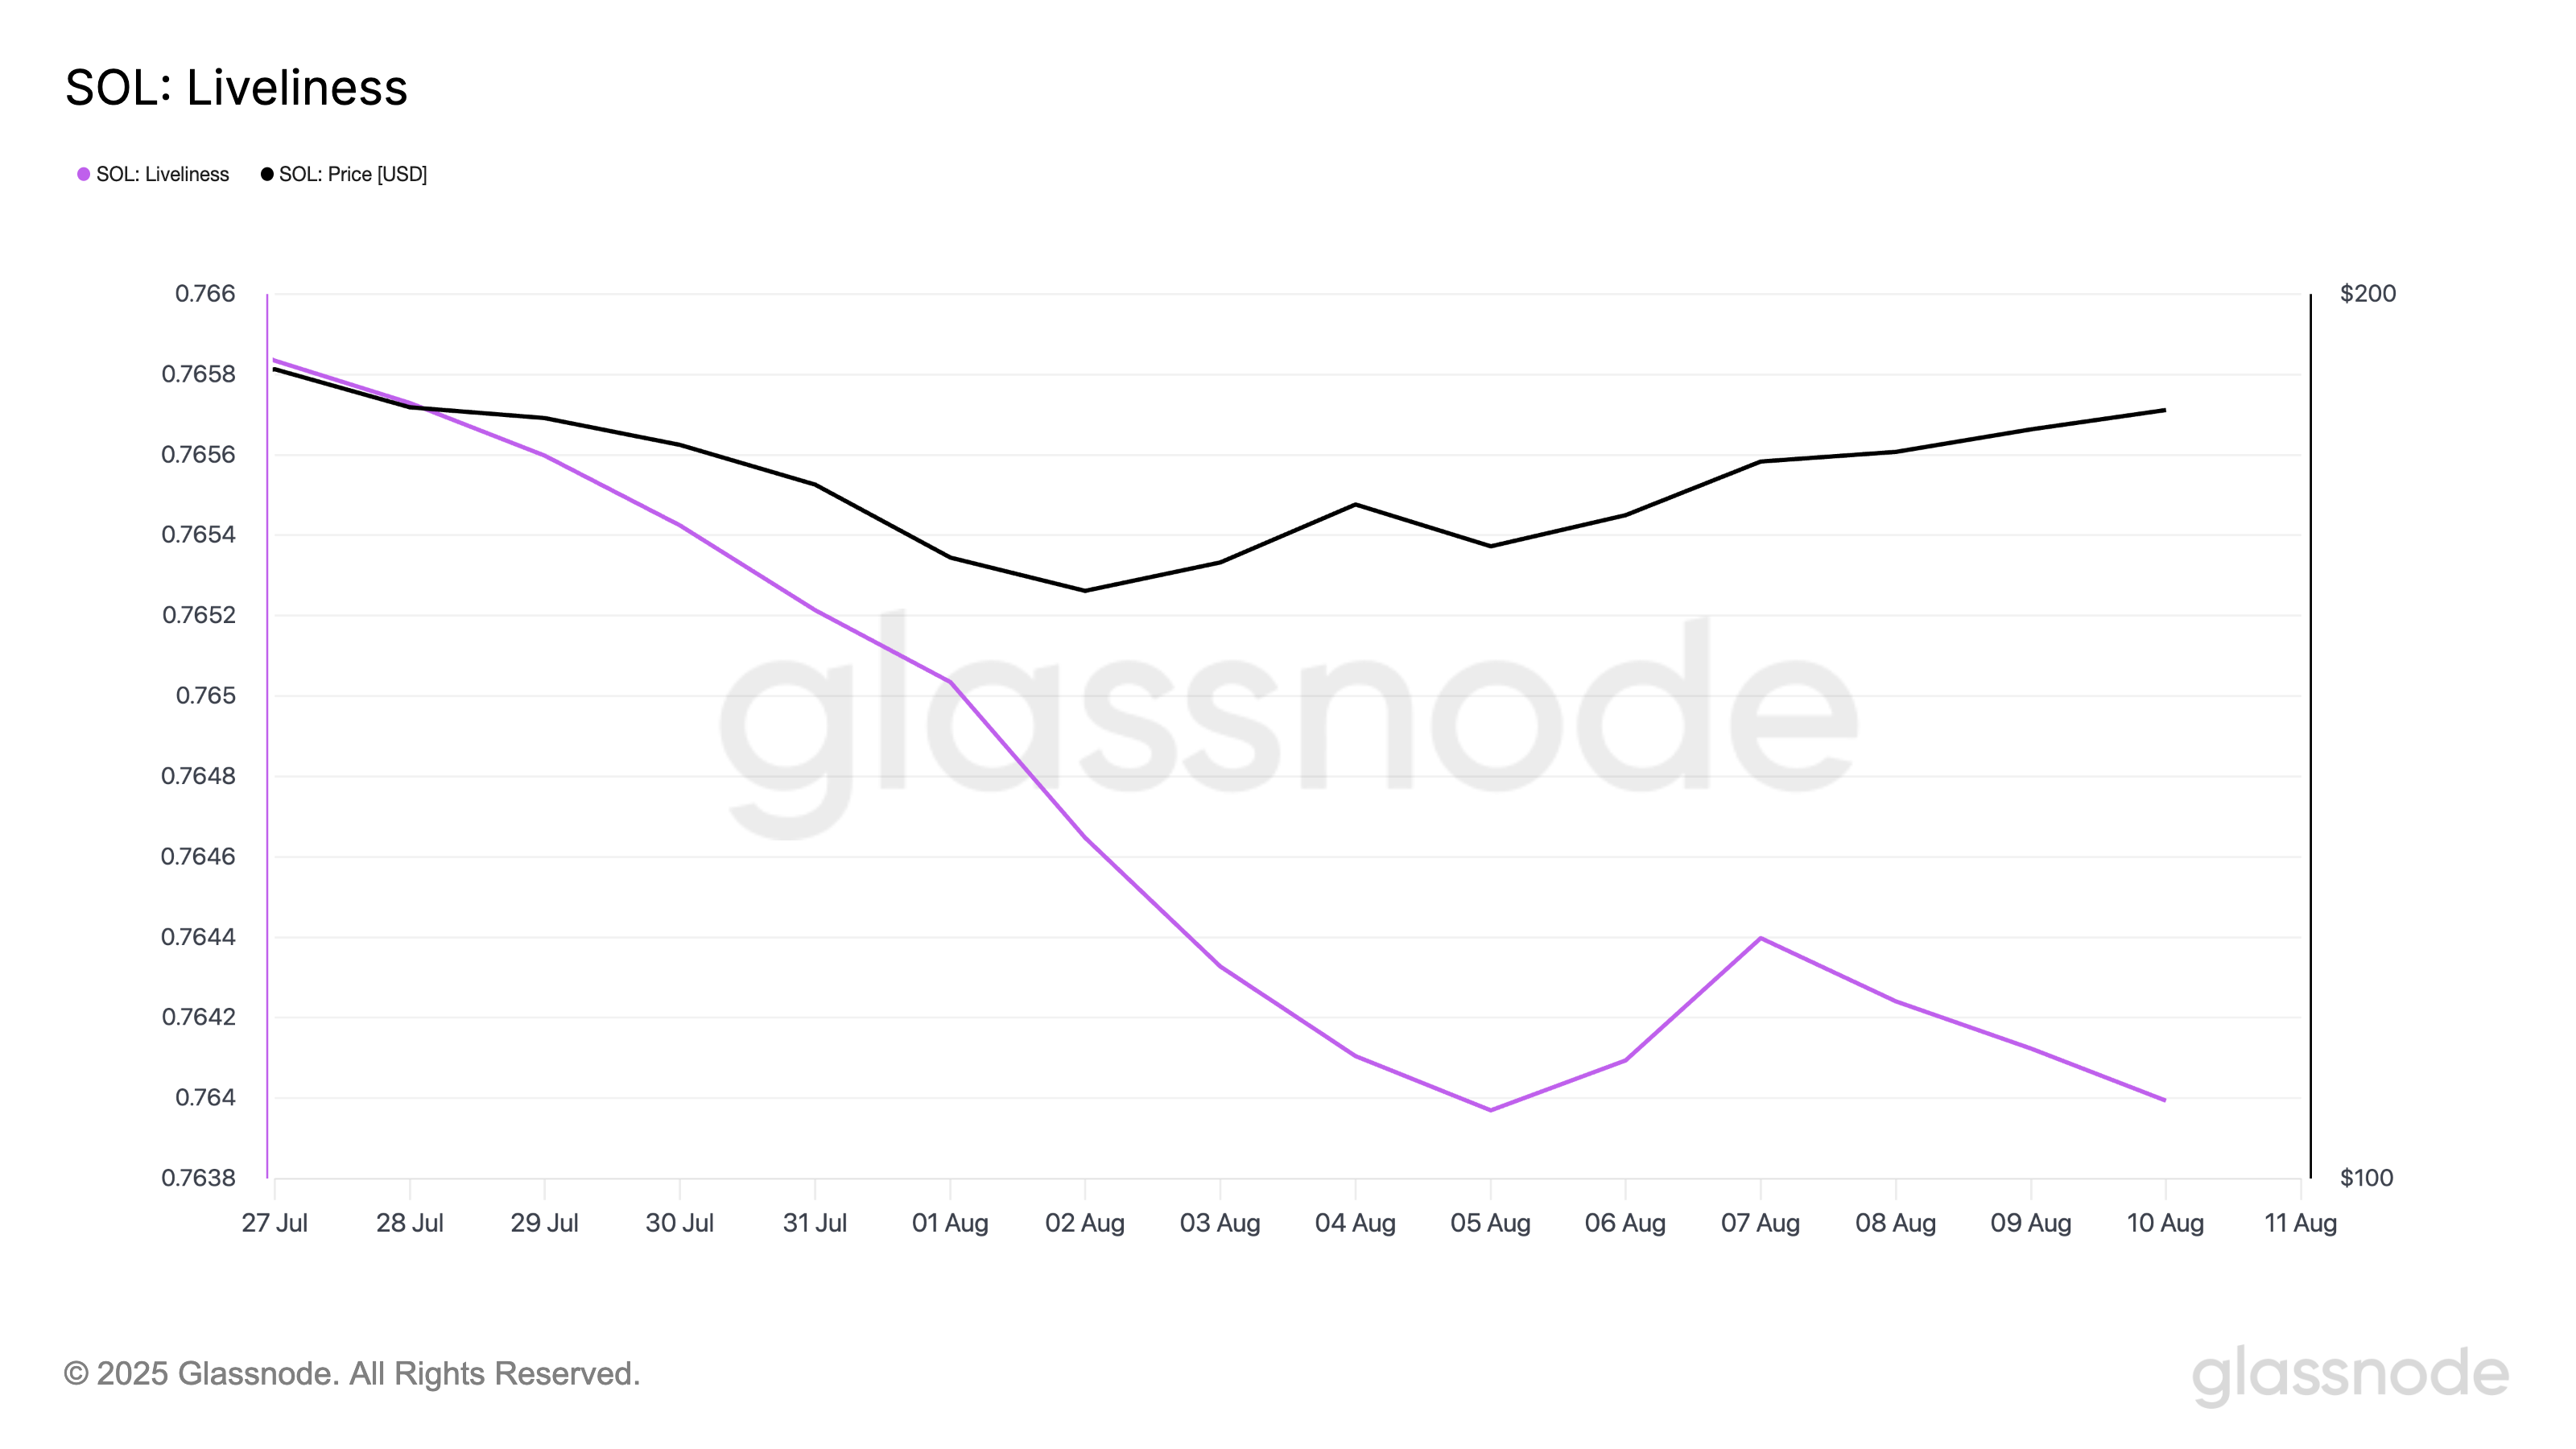
Liveliness measures the movement of long-held tokens by calculating the ratio of coin days destroyed to the total coin days accumulated. When it climbs, it suggests that more dormant tokens are being moved or sold, signaling profit-taking by long-term holders.
Converesly, when Liveliness declines, long-term holders hold a large portion of inactive coins, reflecting increased accumulation and confidence in the asset’s future.
This trend depicts strong conviction among SOL’s key holders. If it continues, it could set the stage for an extended bullish run as broader market sentiment continues to improve.
Furthermore, buy-side pressure is significant on the SOL derivatives market, as reflected by the coin’s current long/short ratio of 1.01.
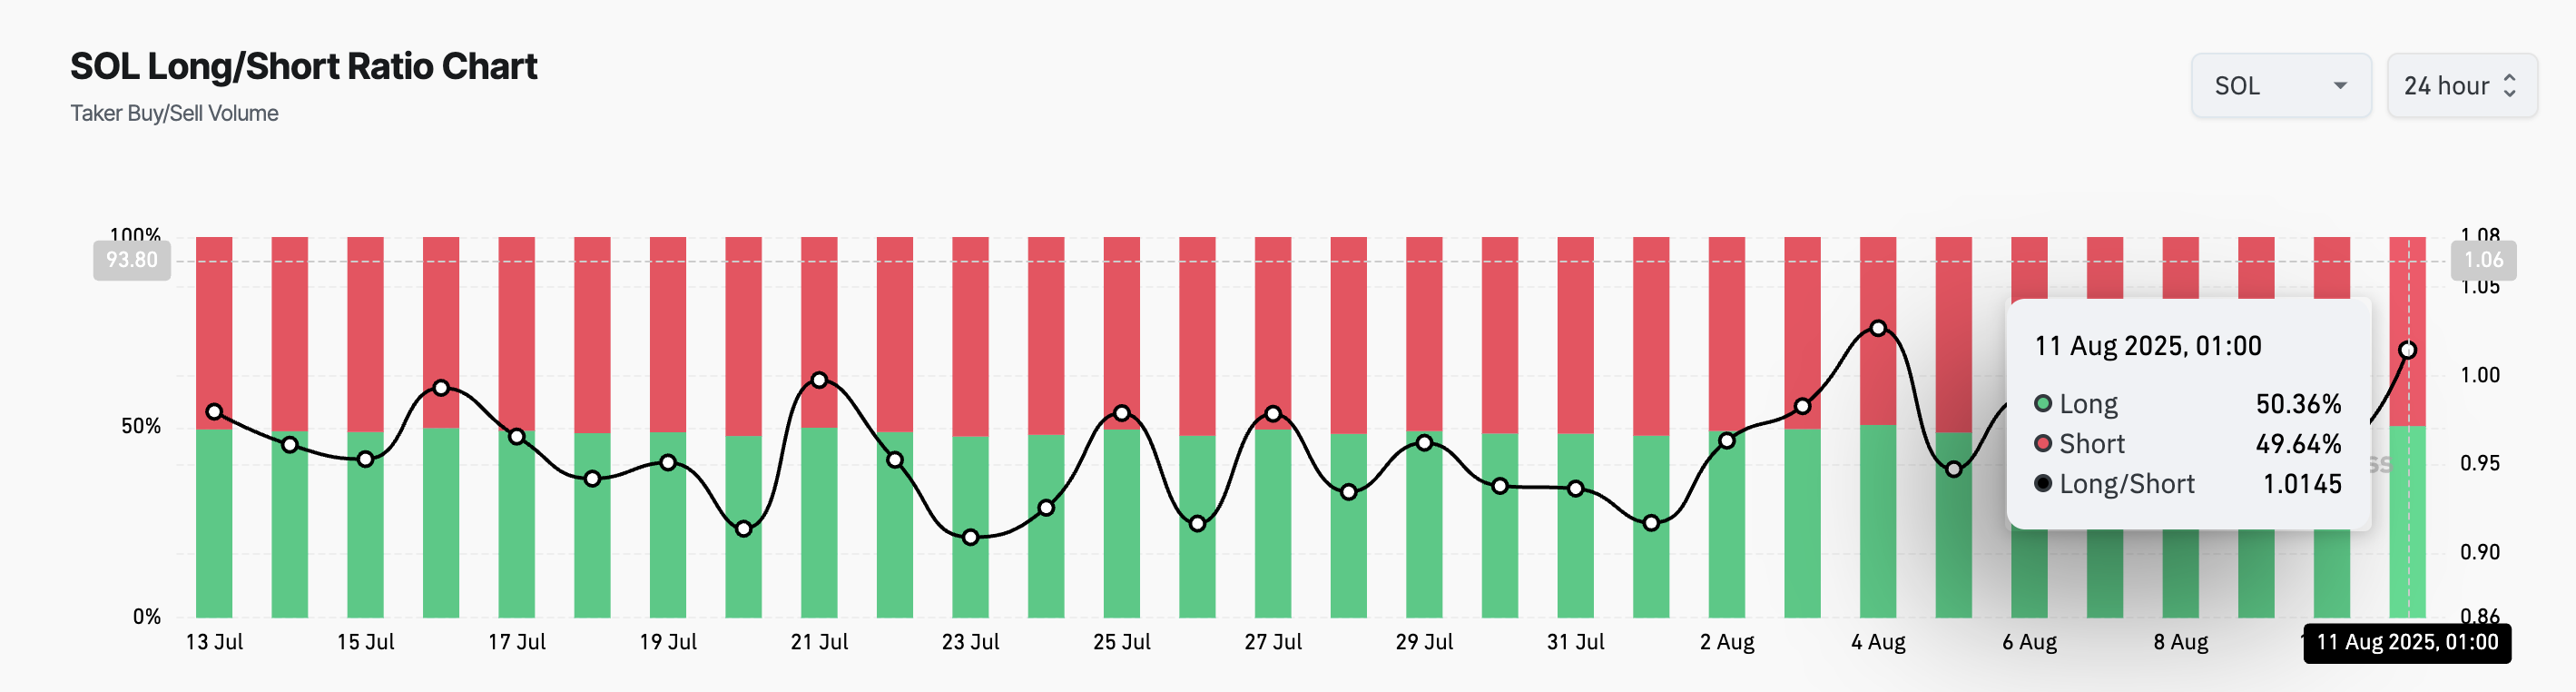
The long/short metric measures the proportion of long bets to short ones in an asset’s futures market. A ratio above one signals more long positions than short ones. This indicates a bullish sentiment, as most traders expect the asset’s value to rise.
On the other hand, a long/short ratio below 1 means that more traders are betting on the asset’s price to decline than those expecting it to rise.
SOL’s long/short ratio reflects rising demand for long positions. Its traders continue to position themselves to benefit from the continued upward movement, which could strengthen the coin.
SOL Nears Critical $190 Level, But Profit-Taking Risks Loom
On the daily chart, SOL trades above an ascending trend line, a trend that emerges when an asset’s price is generally increasing over time, with buyers being more dominant than sellers.
If this continues, SOL could decisively break above the $190 mark and rally toward $195.55, a high it last reached on July 28.
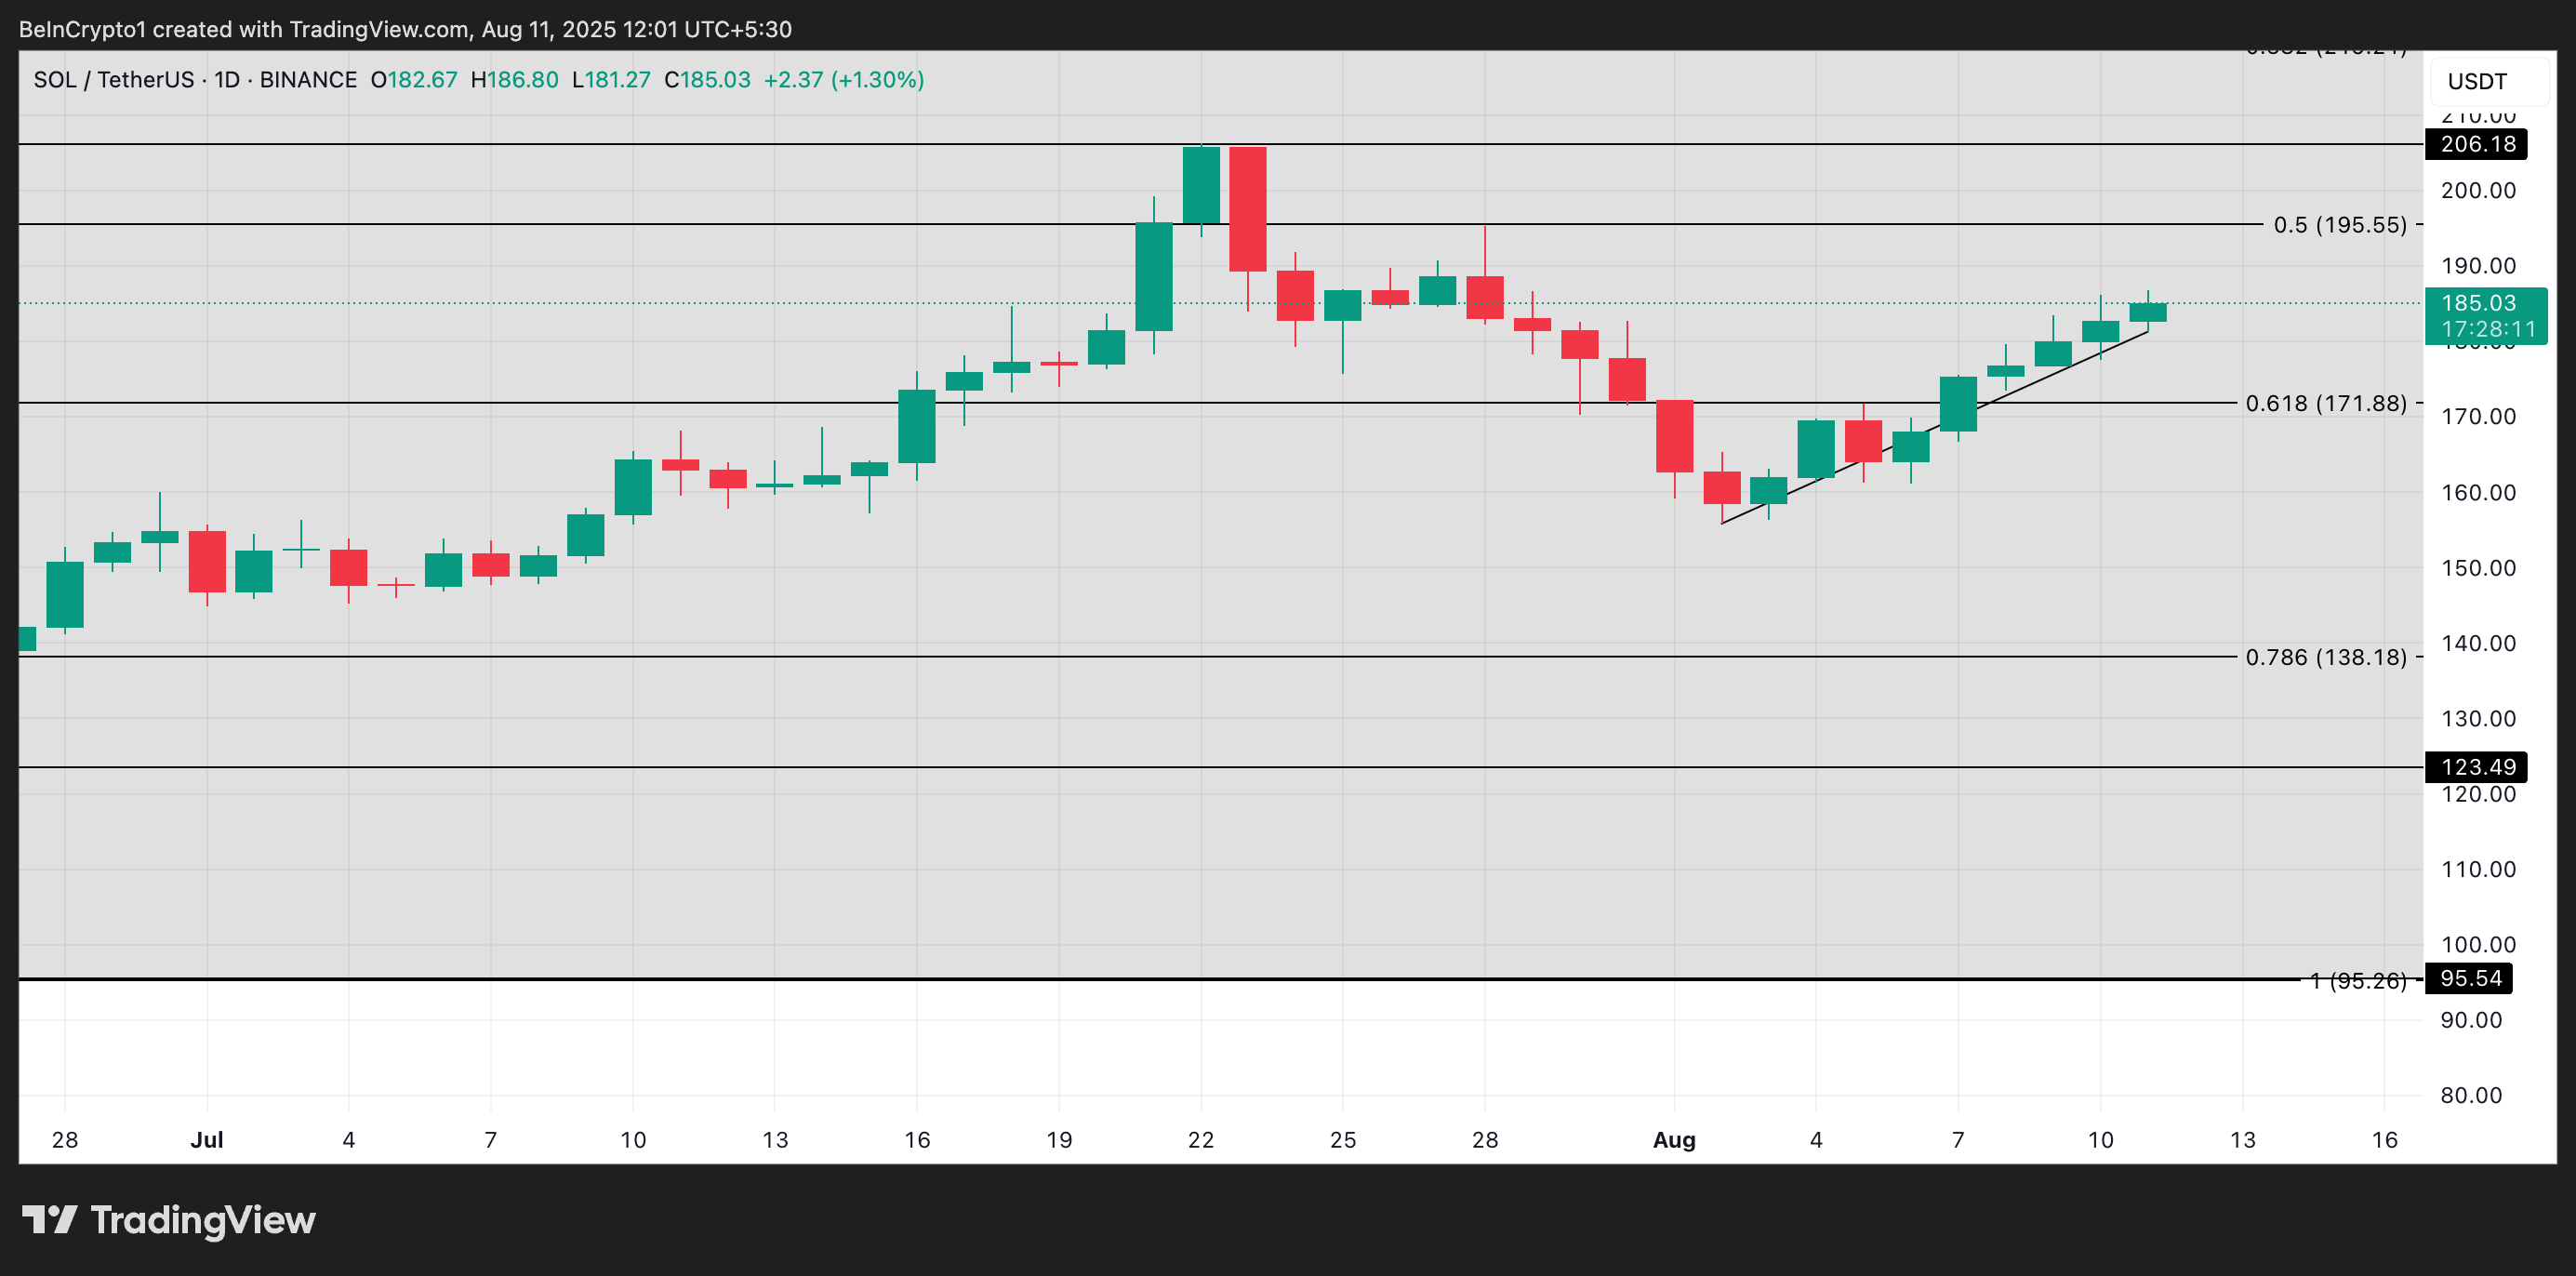
However, a resurgence in profit-taking activity could invalidate this bullish outlook. If sellers return to the market, they could drive SOL’s price under the ascending trend line and toward $171.88.
