XRP at a Crossroads: Will Vanishing Volatility Spark a Crash or a Surge?

XRP's price swings are flatlining—and traders are bracing for a breakout.
After months of wild fluctuations, the Ripple-linked token has slipped into eerie calm. The Bollinger Bands are tighter than a banker's grip on bonus season. But this consolidation won't last forever.
Technical Tug-of-War
The 50-day and 200-day MAs are coiled like springs. Meanwhile, the RSI hovers at 55—neutral territory that could tip either way. Market depth shows thin order books on both sides, meaning any decisive move could accelerate fast.
Regulatory Ghosts Linger
Though Ripple's legal battles with the SEC have faded from headlines, their shadow still looms. Institutional money remains skittish—no surprise when Gary Gensler might wake up and decide to sue the sunrise.
Breakout or Breakdown?
Watch the $0.52 support like a hawk. If that goes, panic selling could drag XRP to December 2023 lows. But flip $0.62 resistance into support? That's your signal for a potential 30% climb toward the next liquidity zone.
Either way—when volatility finally snaps back, it'll move faster than a hedge fund closing a retail-favorite trading loophole.
XRP Trading Flatlines, But Sellers Could Soon Take Control
Readings from the XRP/USD one-chart show that the altcoin has trended within a narrow range over the past three trading sessions. Since Friday, XRP has faced resistance at $3.30 and found support at $3.22.
This follows a four-day rally between August 3 and 7, during which the token surged by 20%. The current sideways trend indicates reduced market volatility, reflecting a relative balance between buying and selling pressure.
In such phases, the market is often in a “wait-and-see” mode, with traders anticipating a catalyst to determine the next price move.
The decline in volatility is evident in XRP’s Average True Range (ATR), which has dropped by 10% since August 7. The ATR measures the degree of price fluctuation over a set period, and a falling ATR signals calmer market conditions with less volatility.
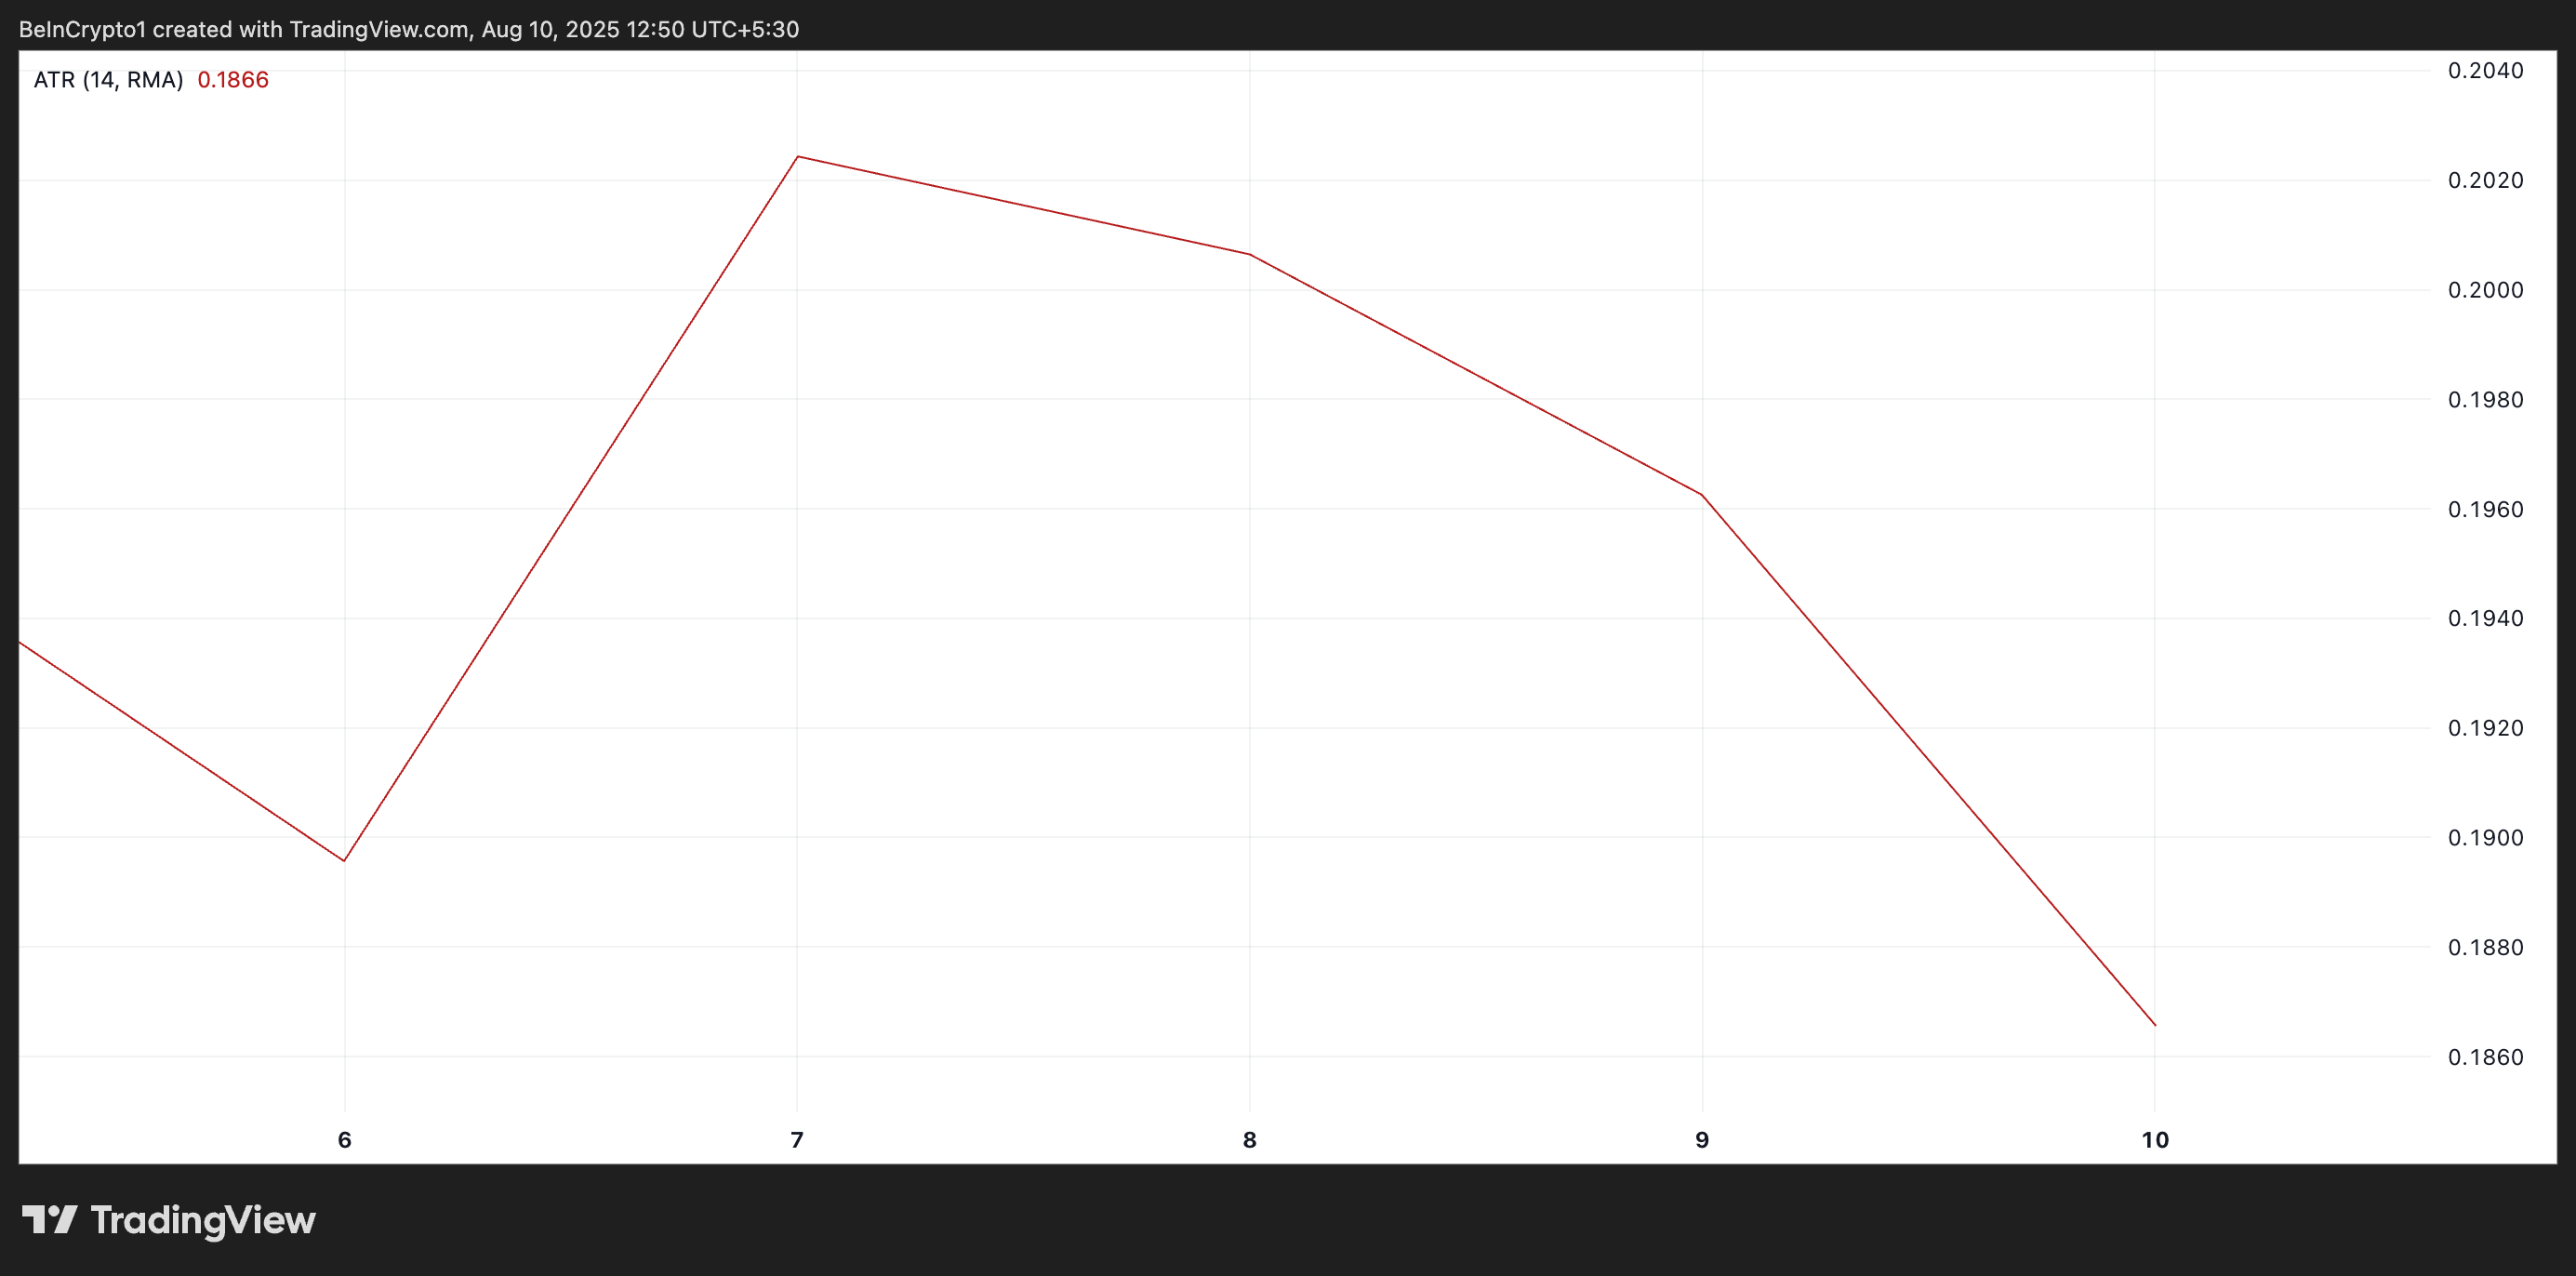
While periods of low volatility suggest market stability, it can also mean traders are becoming less active, often a precursor to a sharp breakout in either direction.
Furthermore, XRP’s Elder-Ray Index strengthens the case for a potential bearish breakout. This indicator measures the strength of buyers (bull power) and sellers (bear power) by comparing price movements against a moving average.
On XRP’s daily chart, the Elder-Ray Index has been posting green histogram bars, representing bullish strength, that have steadily diminished in size over the past few days.
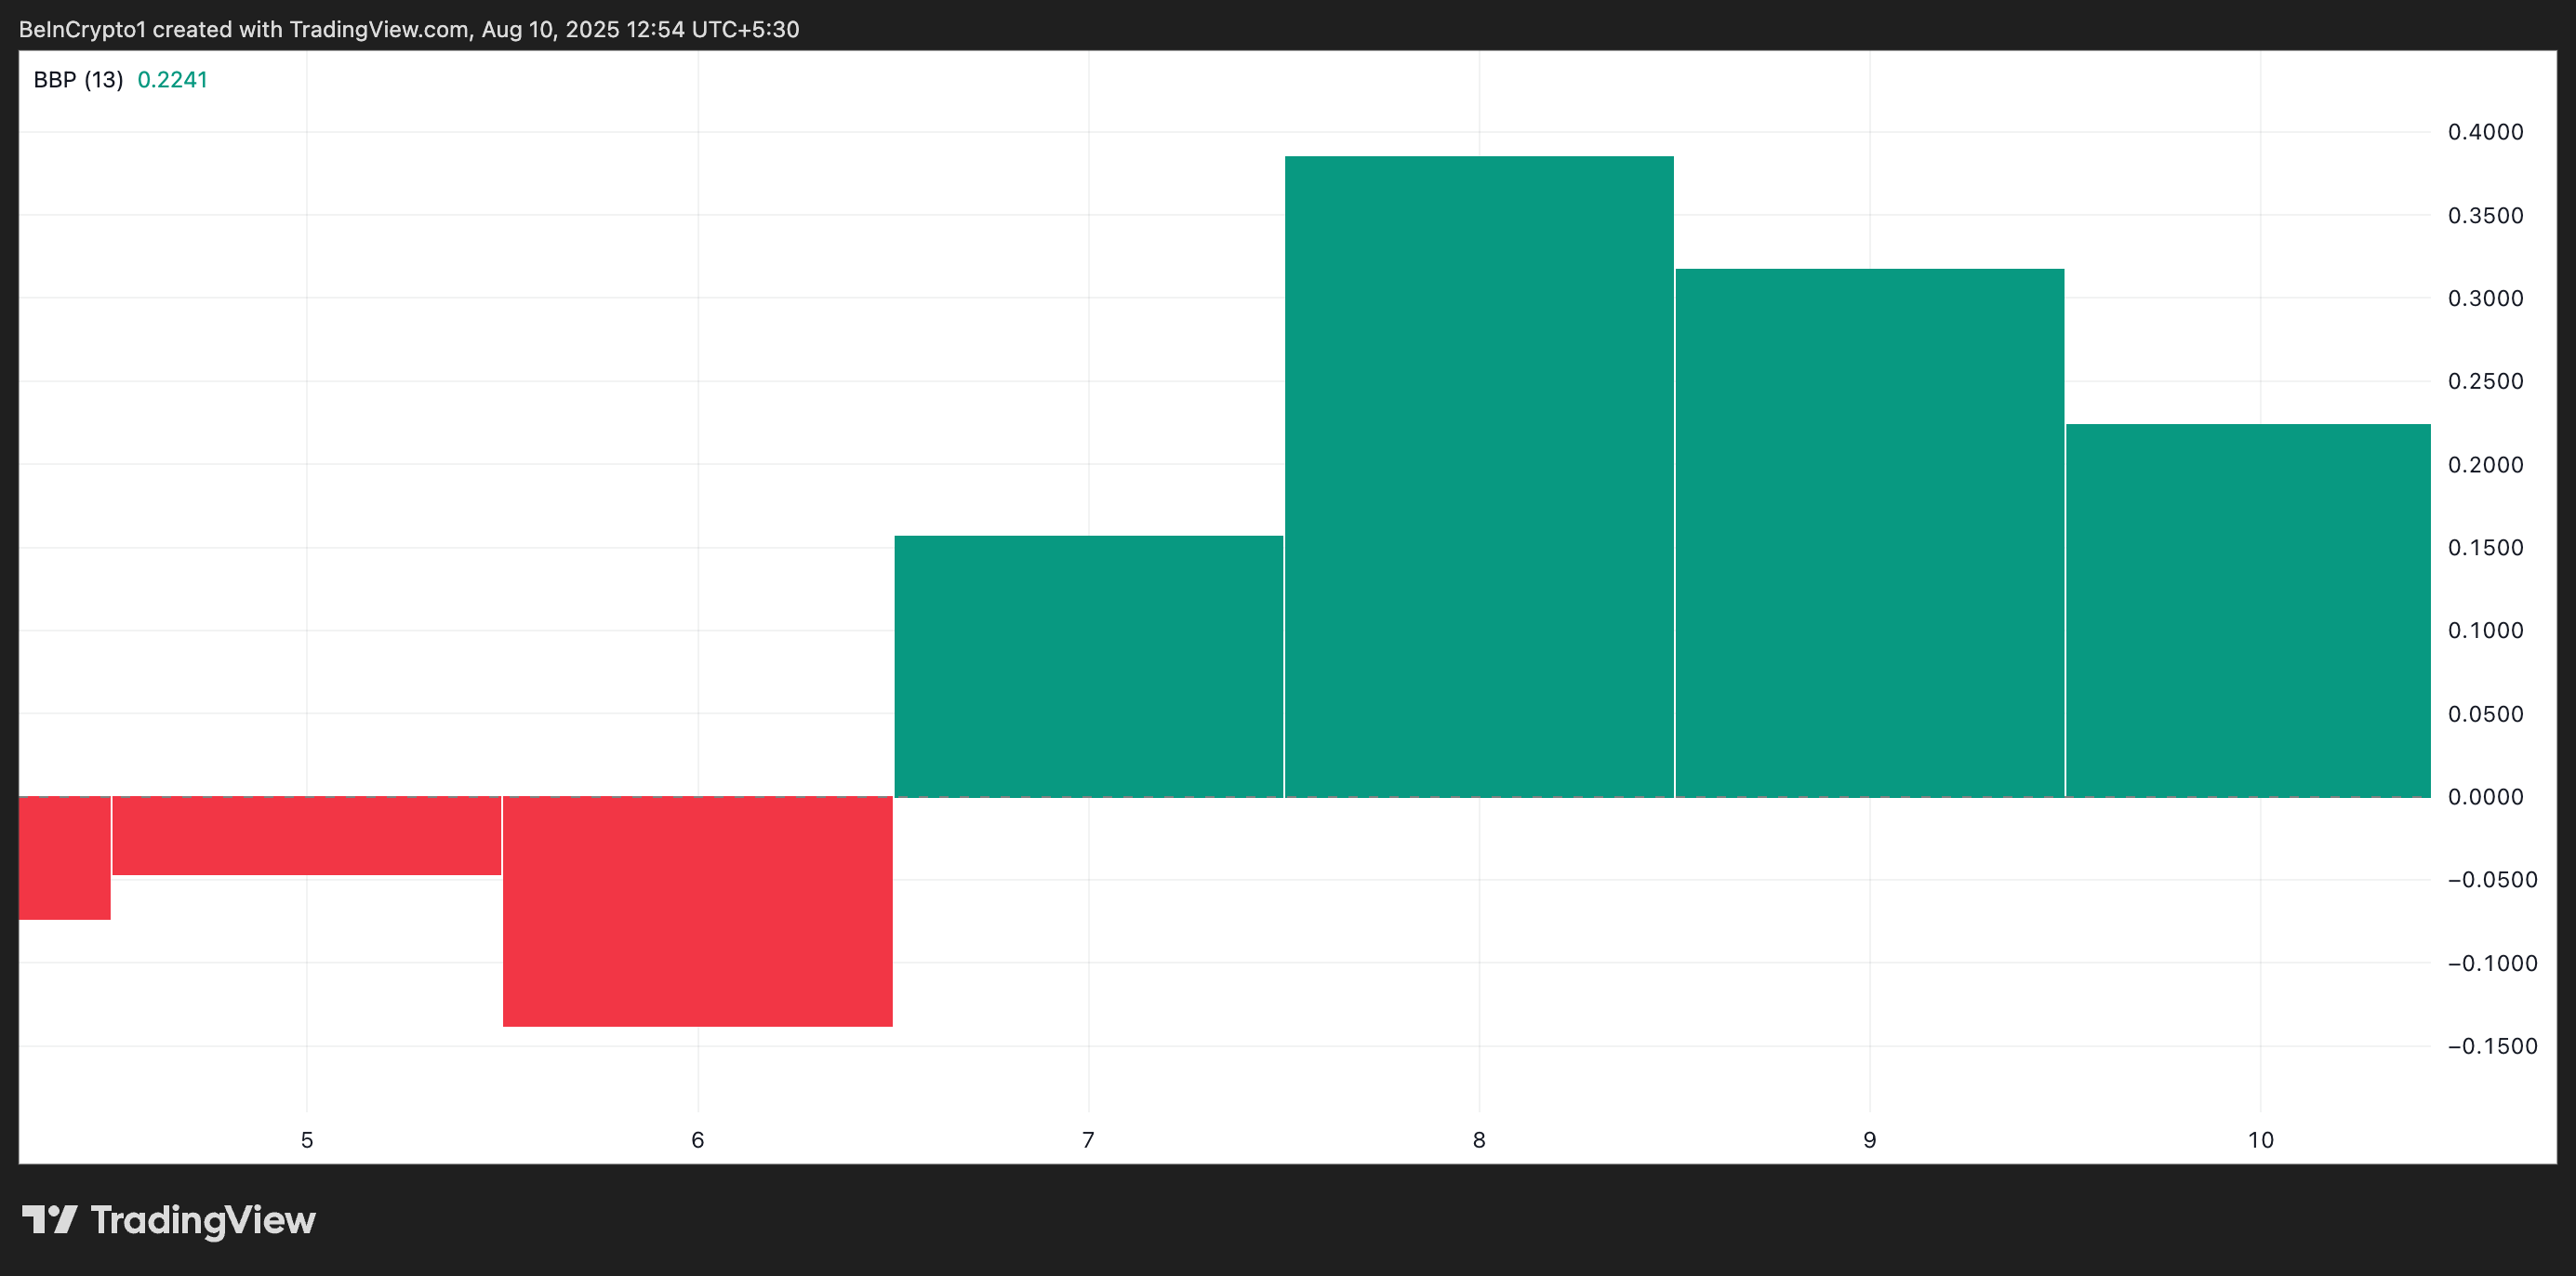
This contraction points to a loss of buying momentum and creates an opening for sellers to assert control and drive XRP’s price lower.
XRP Faces Make-or-Break Moment Between $3.22 and $3.66
Strong sell-side pressure could trigger a break below support at $3.22. If this happens, XRP’s price could deepen its decline and fall to $2.99.
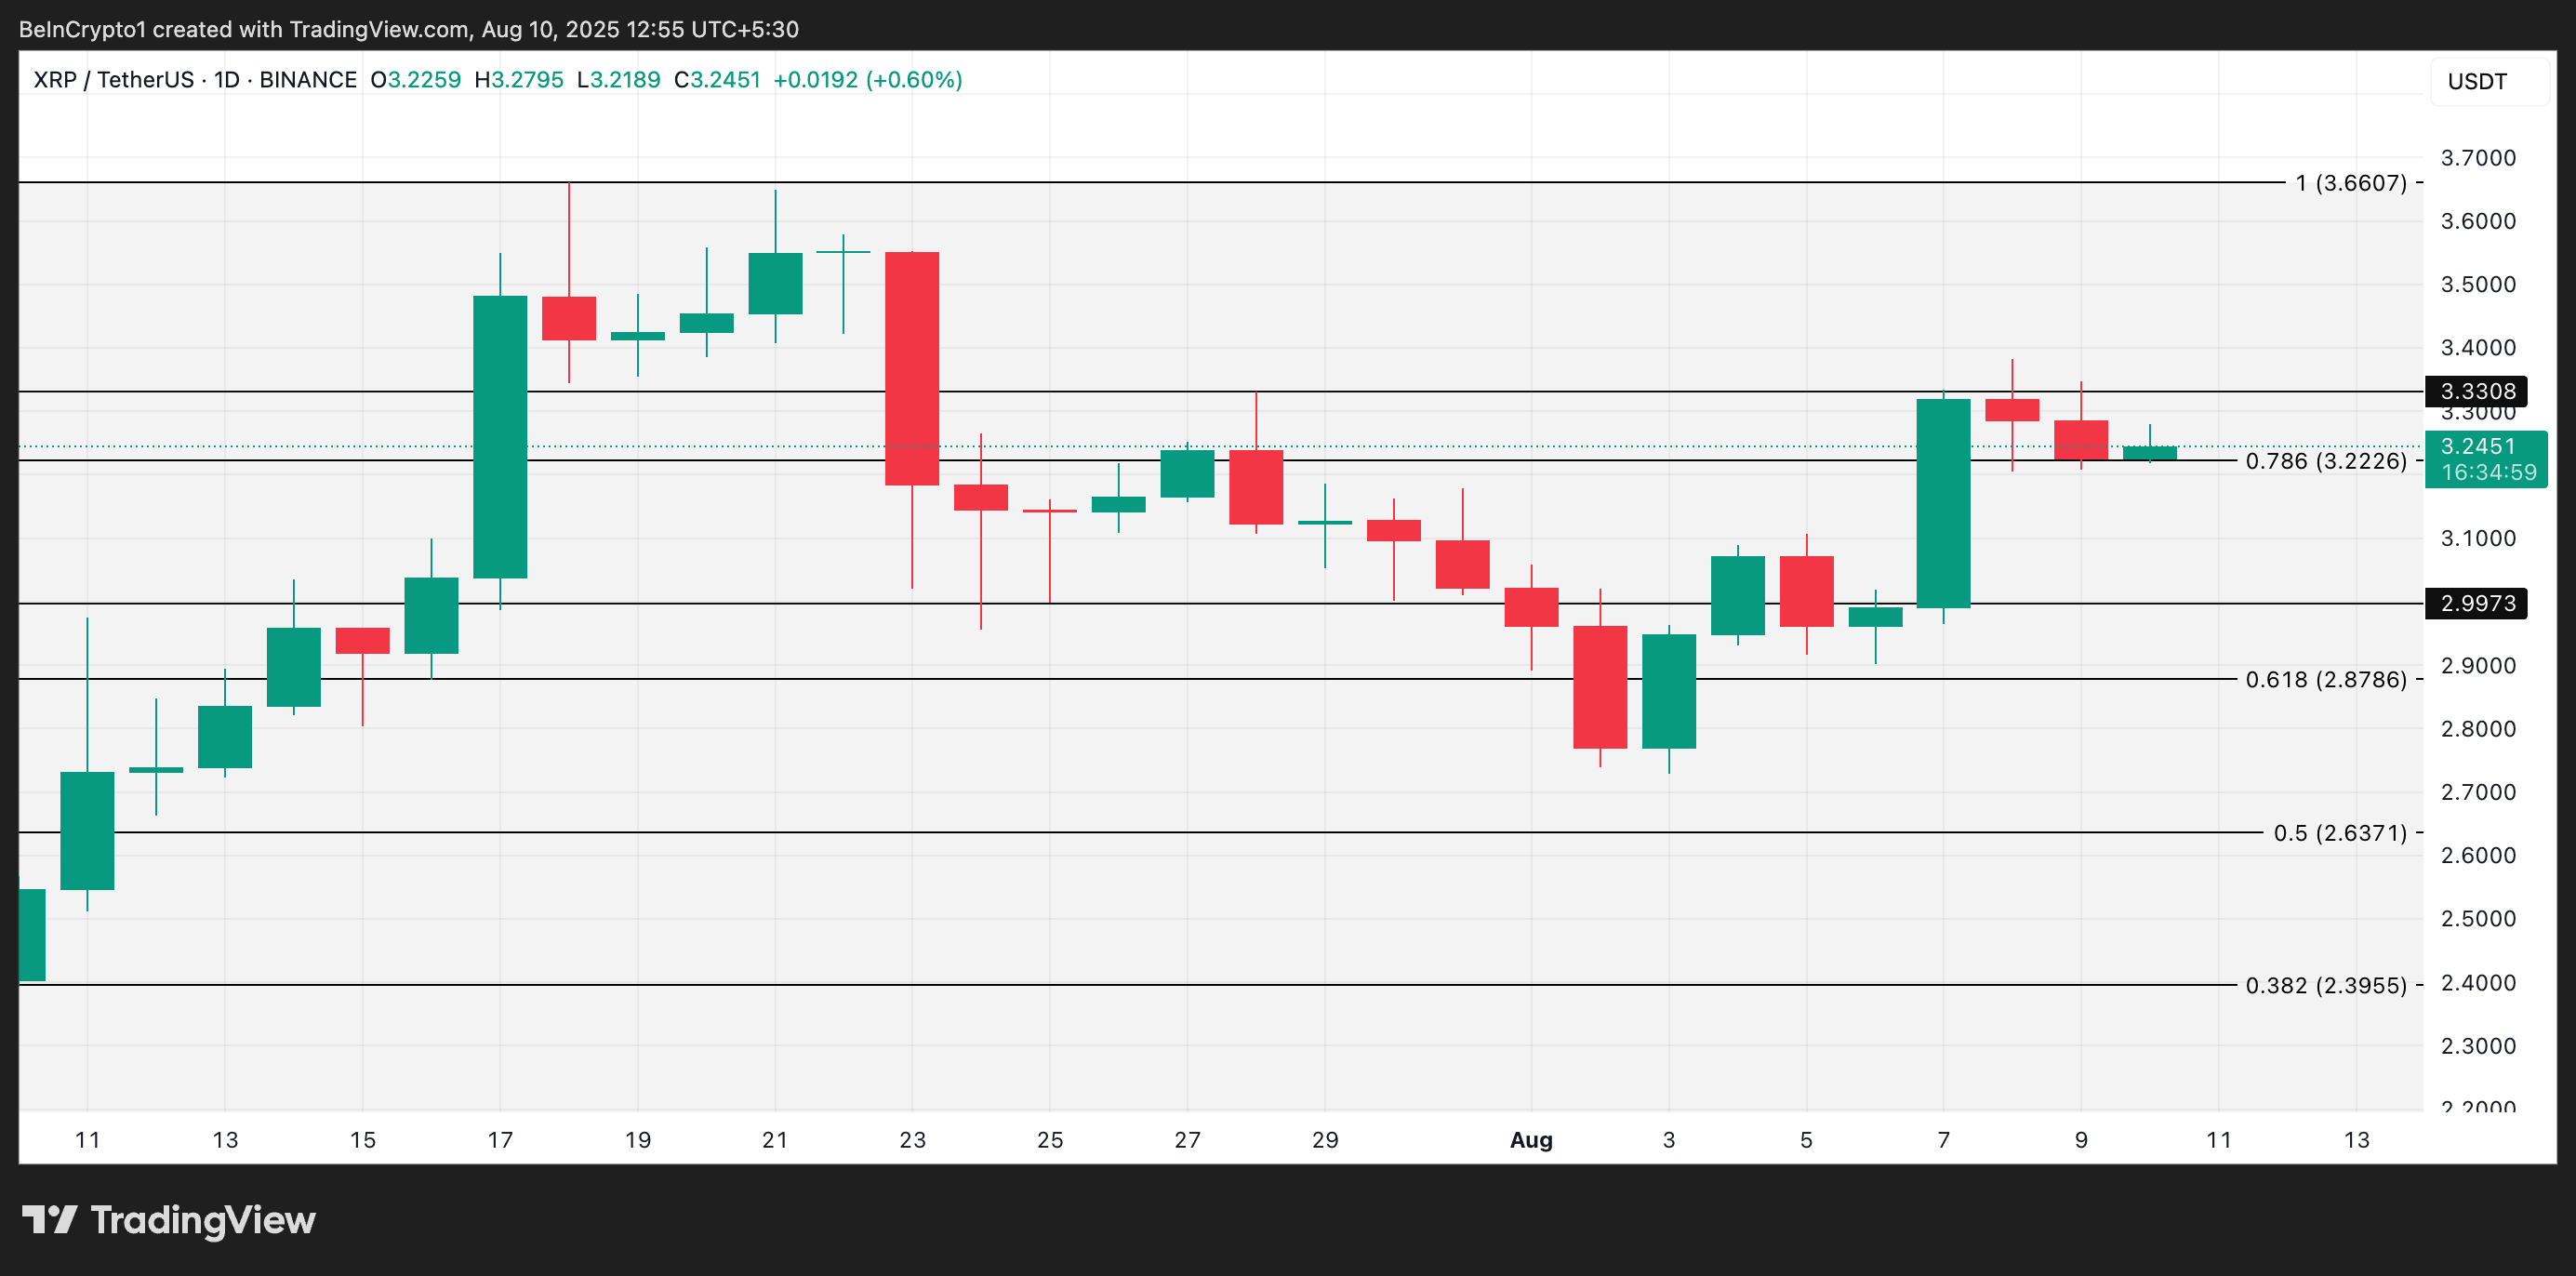
However, XRP could push above the price wall at $3.33 if new demand resurfaces. A successful breakout could open the door for a rally toward $3.66.
