Pi Coin Surges with 2 Bullish Signals in August—Is the Market Still Hungry for PI?

Pi Coin just flashed back-to-back bullish signals this month—but is the hype real or just another crypto sugar rush?
Breaking Down the Moves
Two major price catalysts hit PI in August, sparking trader chatter. No specifics? Classic crypto—always keeping us guessing. Meanwhile, retail buyers scramble for scraps like it's a Black Friday sale on volatility.
The Real Question: Who’s Left at the Table?
After this month’s action, the real test is whether buyers still see PI as a long-term hold or just a quick flip. Spoiler: Wall Street’s probably already shorting it.
Final Thought: If you’re not trading PI with Monopoly money, are you even doing it right?
Bulls Show Signs of Life First Time In August
The first notable signal came on the 4-hour bull-bear power chart, where a green bar flashed after 40+ sessions. This matters. The last time bulls registered on this chart was back in July, and since then, sellers have completely dominated. A green bar suggests that for the first time in weeks, buying pressure has overtaken selling power, even if briefly.
: Want more token insights like this? Sign up for Editor Harsh Notariya’s Daily crypto Newsletter here.
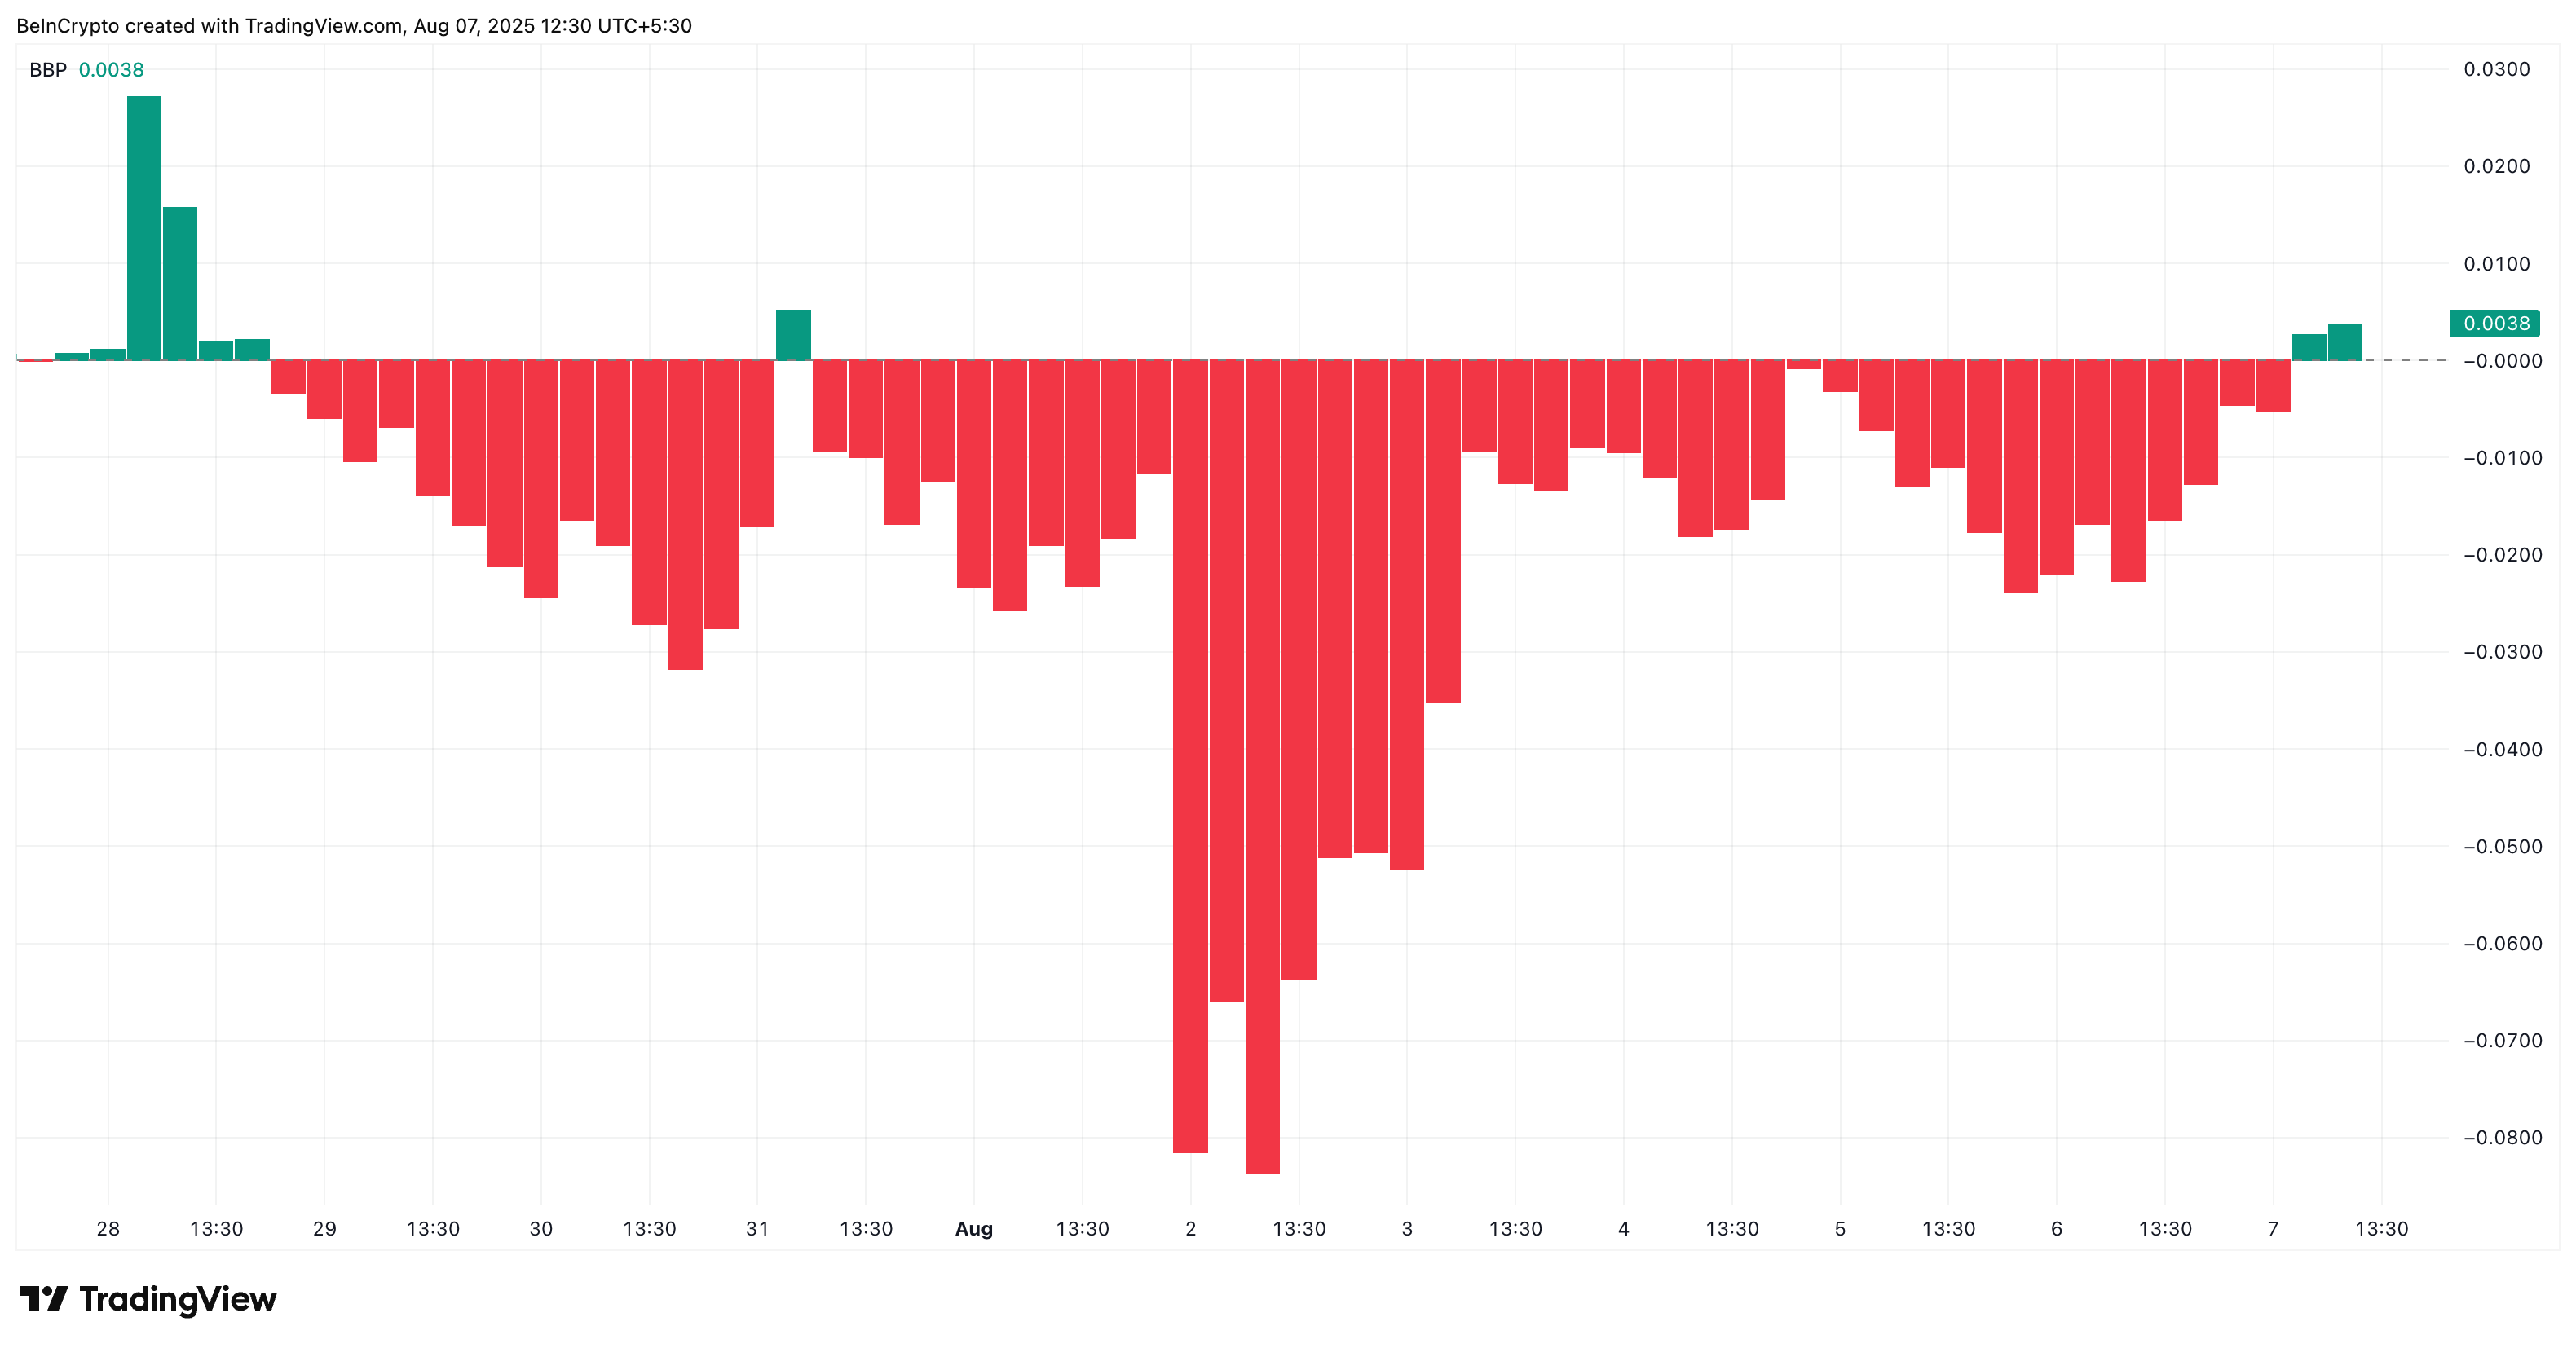
The Bull-Bear Power index tracks the difference between intraday highs and lows relative to a moving average. When green bars appear, it indicates bulls are attempting to take control, often a subtle but early sign of accumulation.
2-Hour Chart Reveals PI Coin Trend Shift With EMA Crossover
While the 4-hour chart showed the first signs of buying pressure, it lacked directional clarity. That’s why we shift to the 2-hour chart: to catch early trend changes and momentum buildups that larger timeframes might blur.
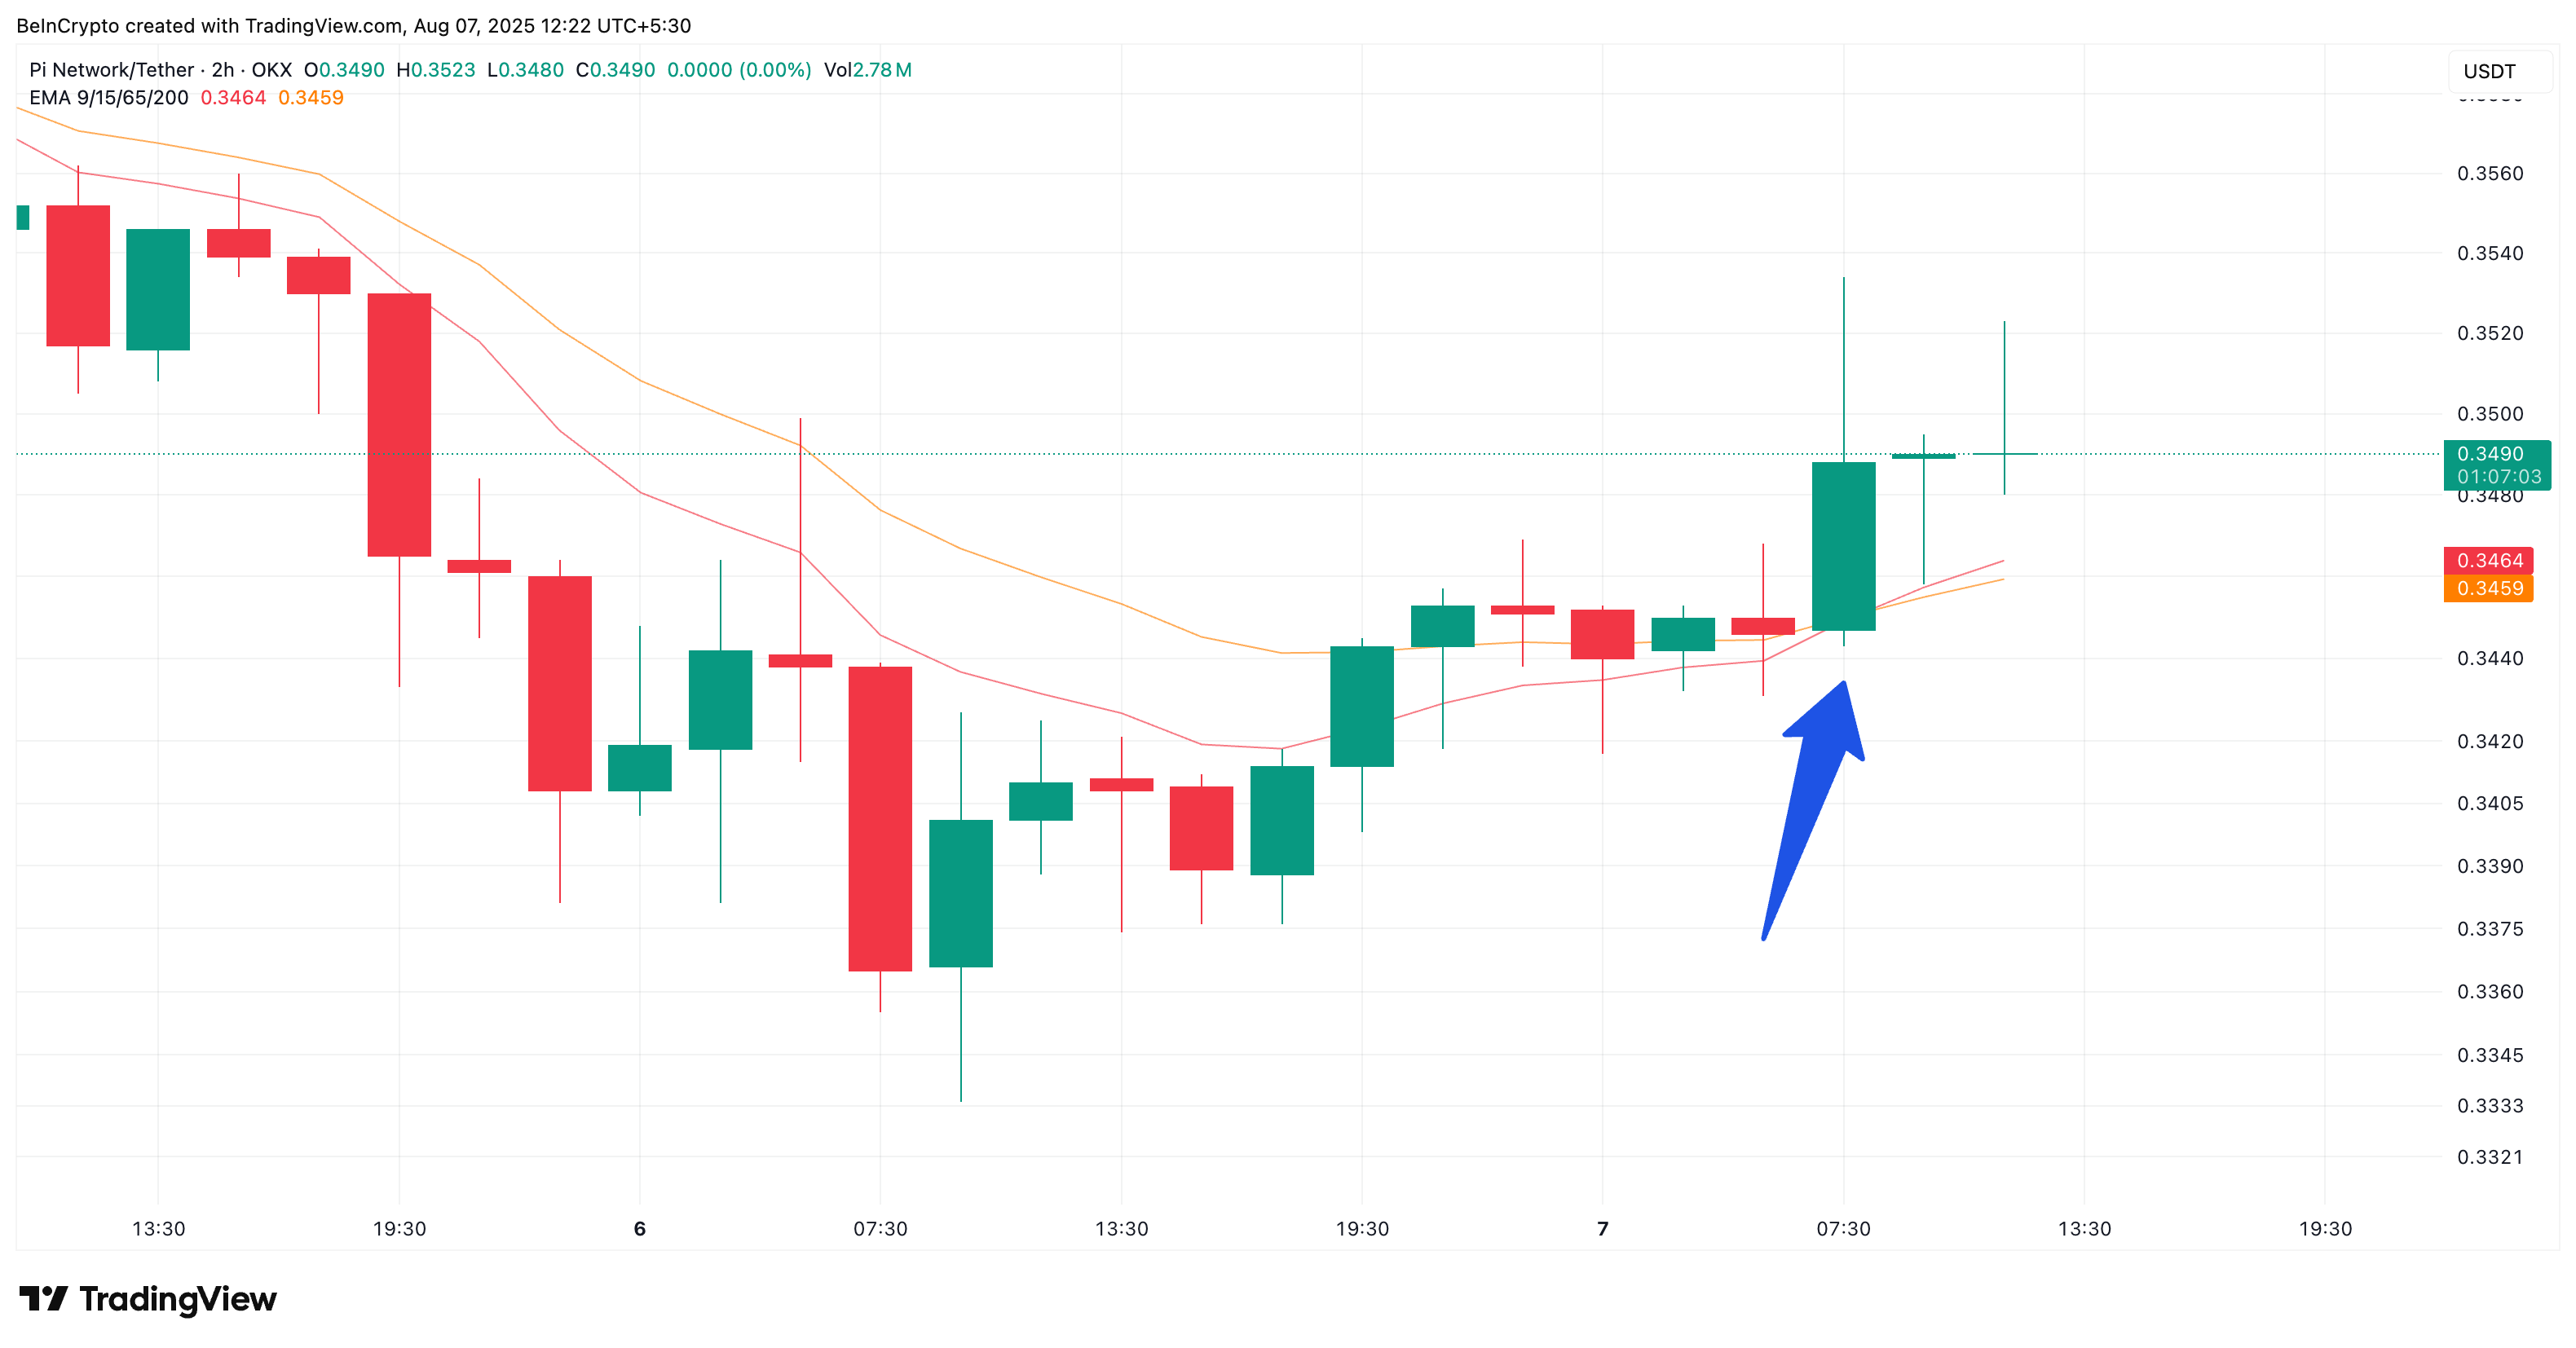
On this lower timeframe, a 9/15-period exponential moving average (EMA) crossover has just taken place, with the faster-moving 9-EMA (red line) crossing above the slower 15-EMA (orange line). This suggests that buyers have started gaining control over short-term price action, overpowering sellers for the first time in August. The 9/15 EMA is often used to identify early momentum shifts before they appear on higher timeframes, making this crossover a relevant bullish cue.
Compared to the more commonly used 20/50-period EMAs, the 9/15 crossover reacts faster to smaller price shifts, making it more effective for spotting momentum shifts before they become obvious on longer timeframes. However, while it gives earlier signals, it’s also more sensitive to noise, so confirmation from price structure and volume remains essential.
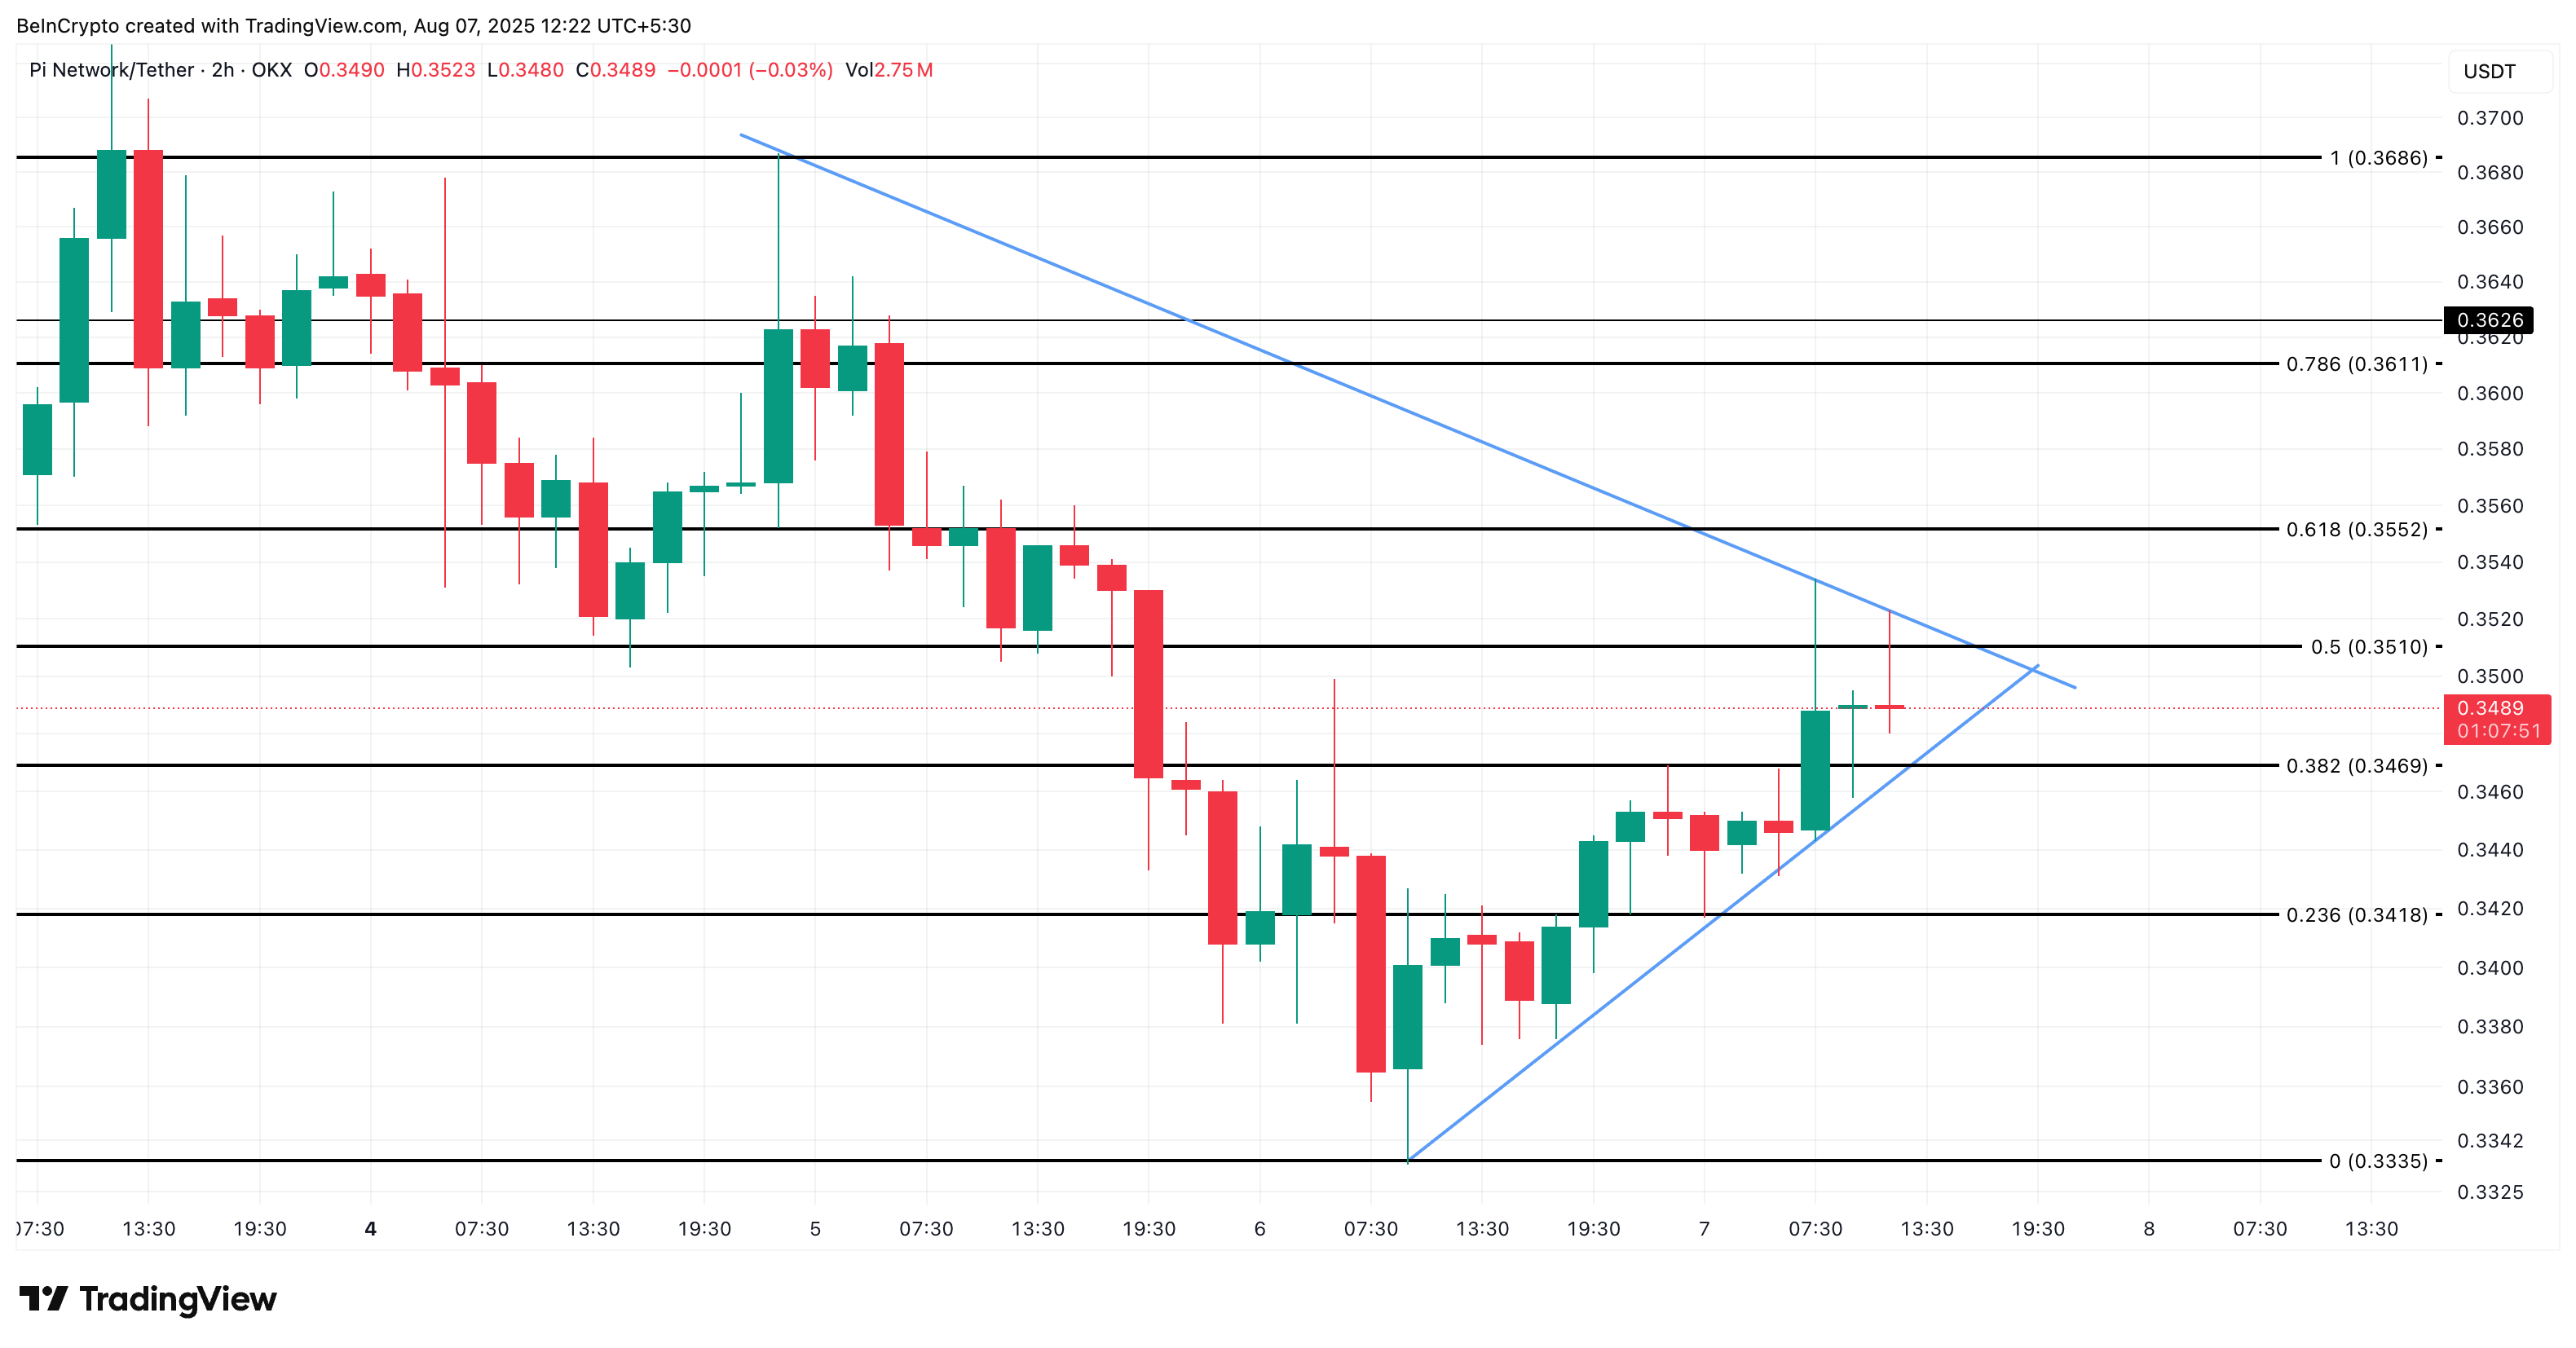
PI Coin Price: All About A Pennant Pattern and Key Breakout Levels
On the same 2-hour chart, the Pi Price is also pressing against the upper trendline of a bullish pennant, consolidating tightly near $0.35. A clean candle close above that level could unlock a short leg higher, with short-term targets near $0.36.
The daily Pi Coin price chart confirms that these levels are key resistance zones. The 0.36 mark aligns with the upper boundary of previous rejections, followed by $0.39.
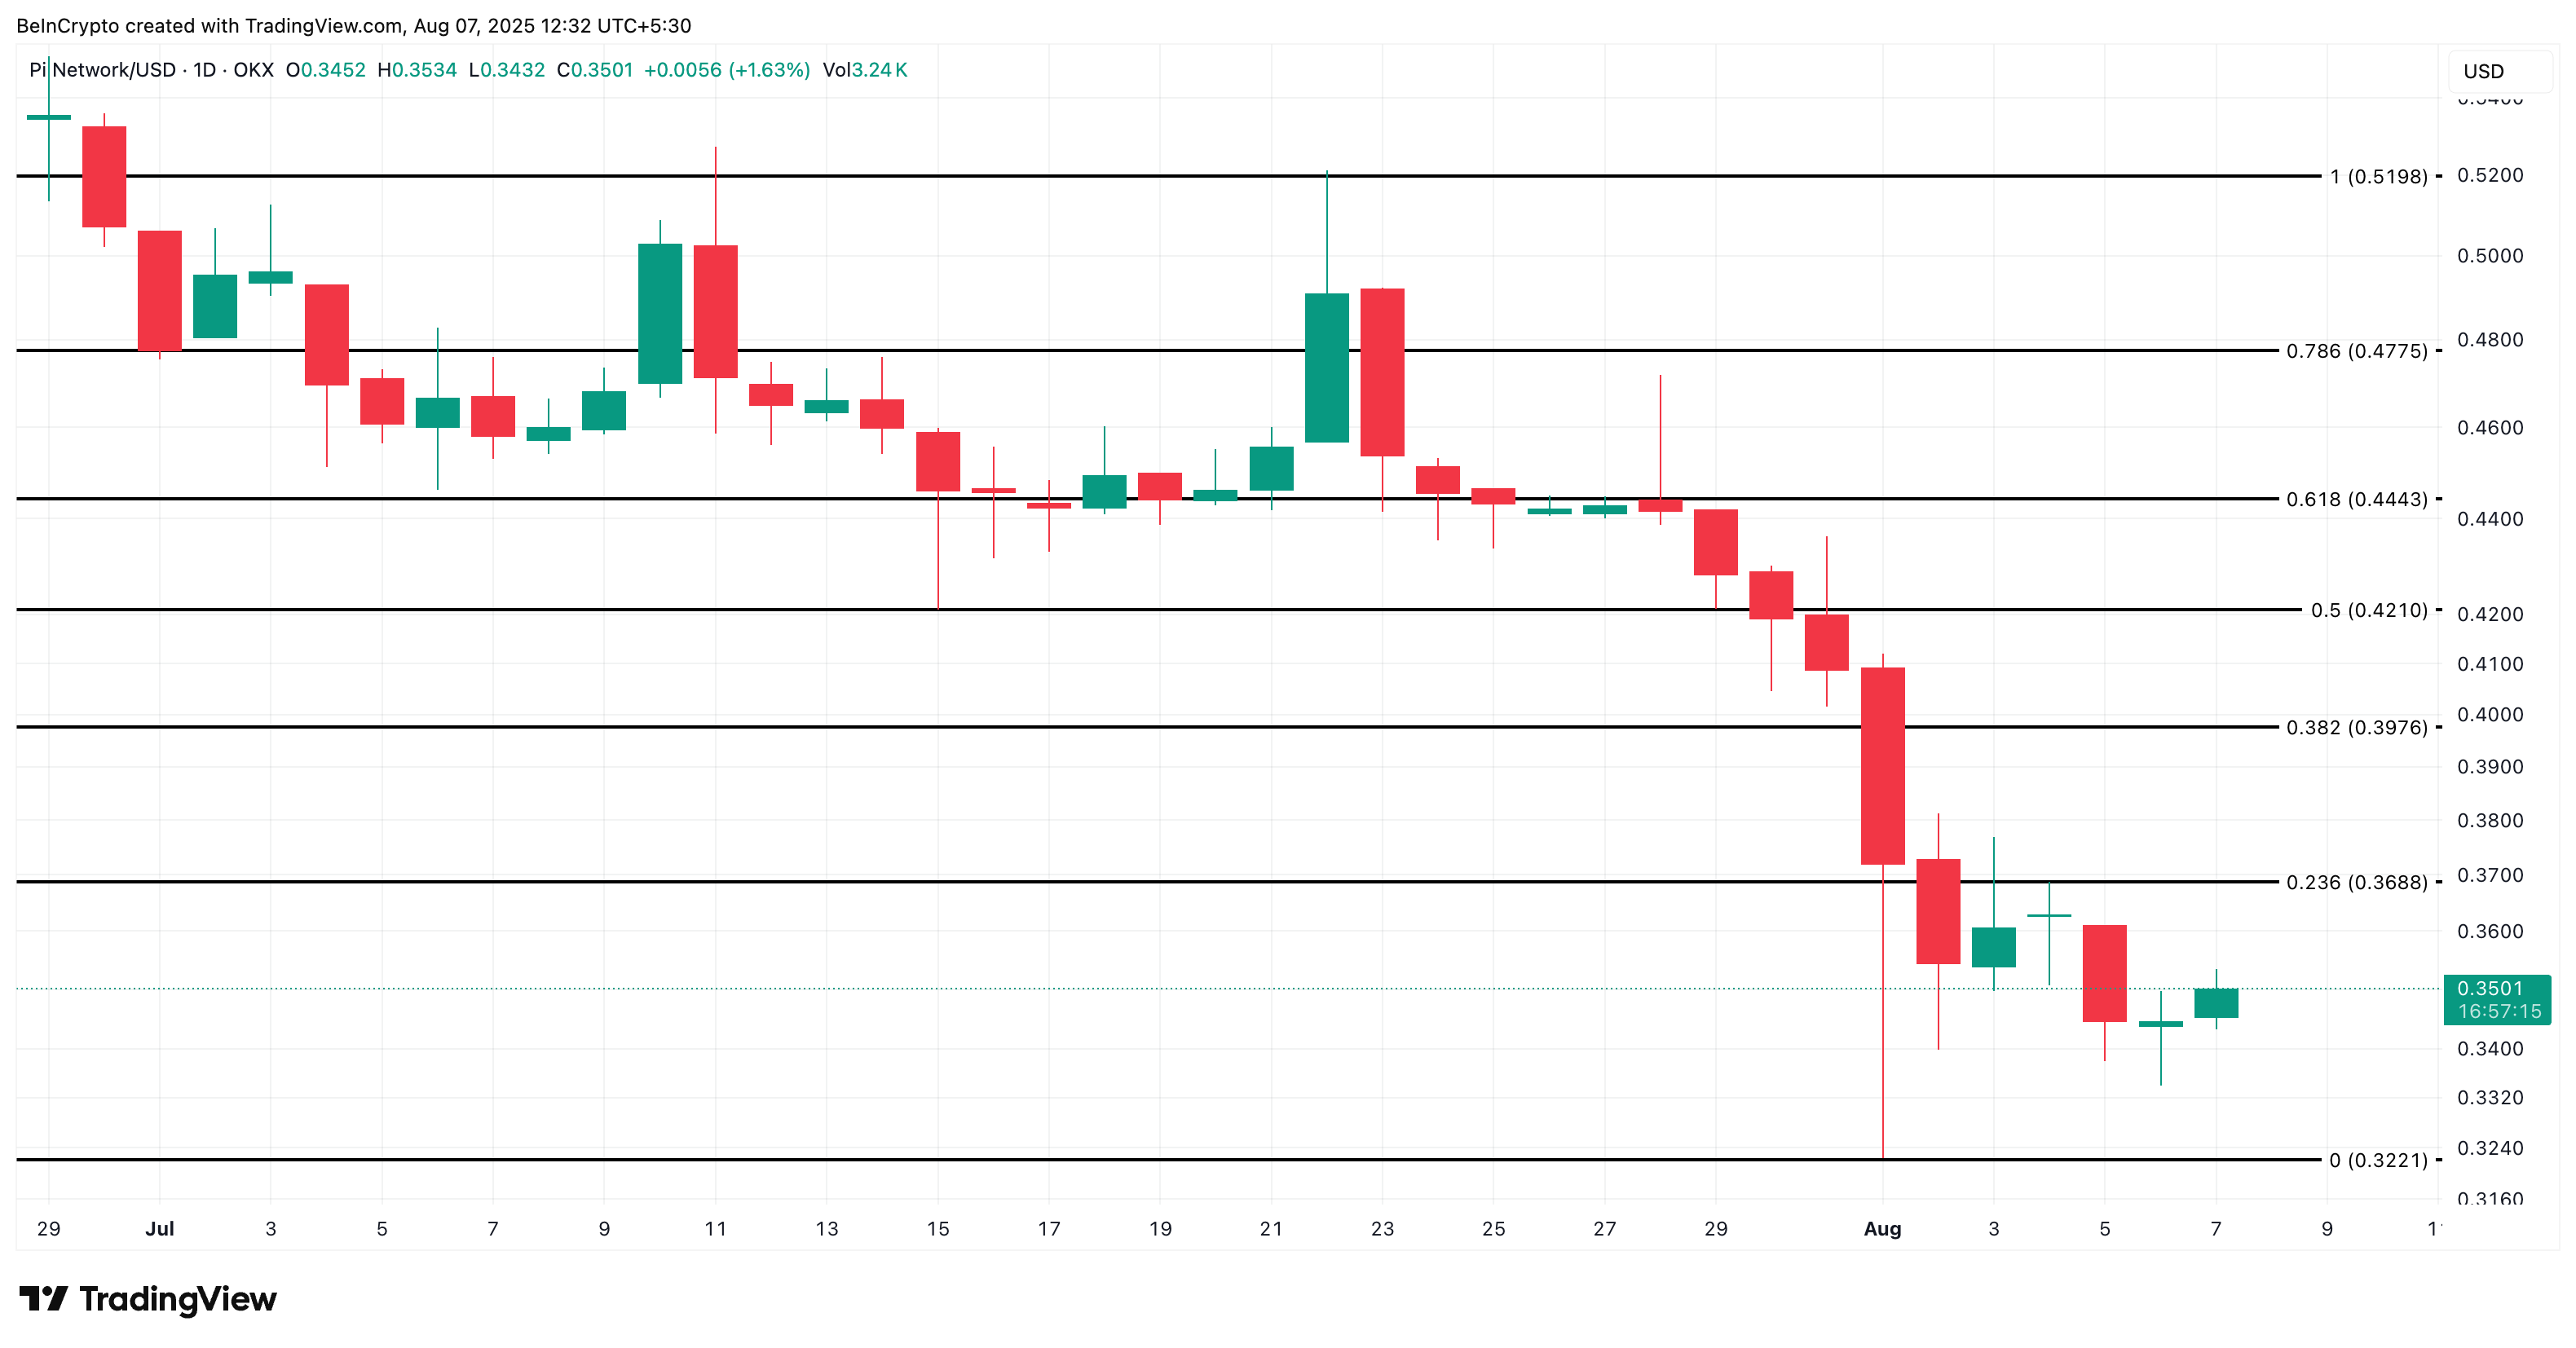
PI price invalidation lies NEAR $0.32; if that breaks, the current pattern fails and fresh lows are likely.
