Succinct’s ’PROVE’ Token: Bullish Pennant Signals Explosive Breakout Potential

Another day, another crypto project promising to revolutionize transparency—but this one's chart might actually back up the hype.
Succinct's PROVE token is painting a textbook bullish pennant on low timeframes, while on-chain data shows steady accumulation. The pattern suggests traders are betting big on its upcoming exchange listing.
Key signals flashing green:
- Tight consolidation after a 30% rally last week
- Rising volume despite flat price action (classic accumulation tell)
- Relative Strength Index holding above 60 without overheating
Of course, in crypto-land, 'technical analysis' often just means drawing triangles until something happens. But with exchange listings still acting as rocket fuel for altcoins—regardless of actual utility—this setup could print fast gains for momentum traders.
Just remember: In a market where 'fundamentals' means checking which VC dumped their tokens last, even pretty charts deserve side-eye.
Cliff Unlocks Are Delayed, While Top Holders Step In Early
One of the biggest fears with newly listed tokens is the looming cliff unlock, when large amounts of tokens are released to insiders and early backers, often triggering steep price drops. But in Succinct’s case, the structure tells a different story.
According to the official distribution, over 65% of the total supply allocated to Core contributors, investors, and R&D comes with 0% unlocked at TGE, a 12-month cliff, and gradual linear vesting over 36 to 48 months. Even the incentives and foundation allocations, while partially unlocked at launch, still follow the same one-year cliff schedule before any further supply hits the market.
This means that no meaningful unlock pressure exists until mid-2026, giving the market ample time to absorb the initial token release or float and establish demand organically.
: Want more token insights like this? Sign up for Editor Harsh Notariya’s Daily crypto Newsletter here.
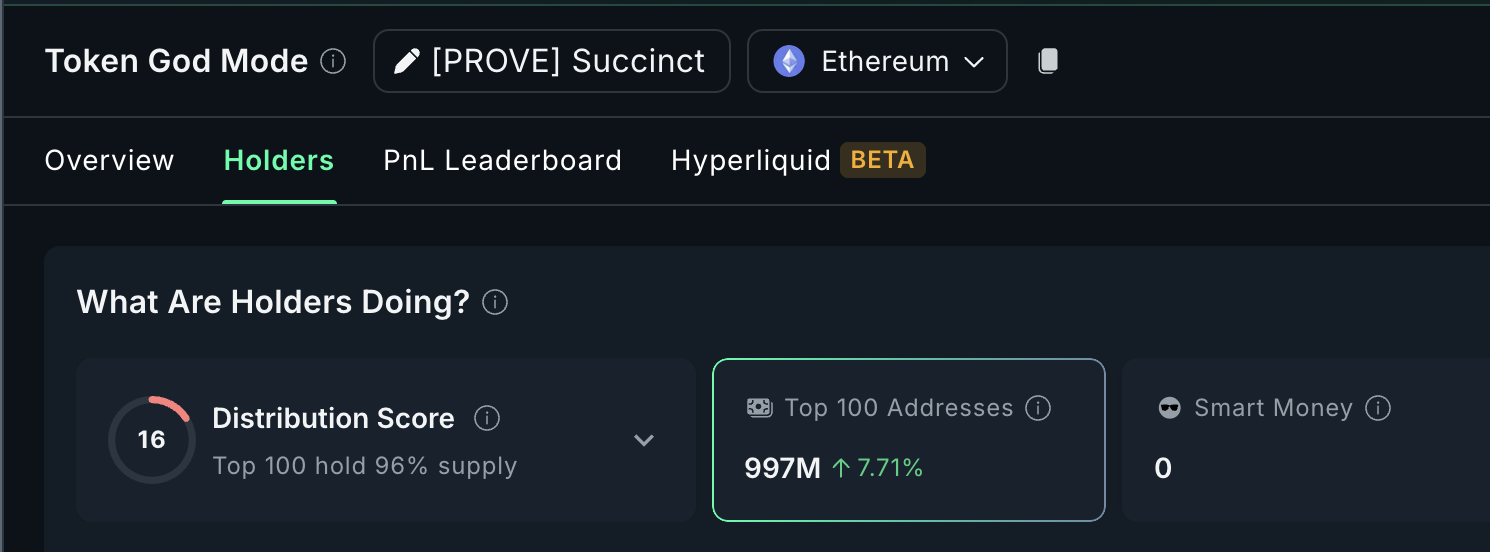
Now here’s where it gets more interesting. Despite the early volatility, top 100 holders have added 7.71% more tokens, now holding 96% of the total supply. This surge in ownership concentration signals that early accumulation is taking place. It is likely from long-term participants, either insiders or whales, anticipating strength in Succinct’s token model.
With cliffs keeping most of the token supply locked away and top holders quietly stacking, the risk of a near-term supply shock looks minimal. If anything, current trading is happening on low float, and price action is more susceptible to momentum and sentiment than mass unlocks.
Fibonacci and VWAP Hold; But $1.18 Is the Make-or-Break for the Succinct (PROVE) Price
The 1-hour chart paints a classic retracement story. After peaking at almost $1.55, PROVE retraced cleanly toward the $1.14 level and is now hovering around $1.23. Importantly, this area also aligns with the anchored VWAP (Volume Weighted Average Price) line at $1.21, where price has respected support multiple times.
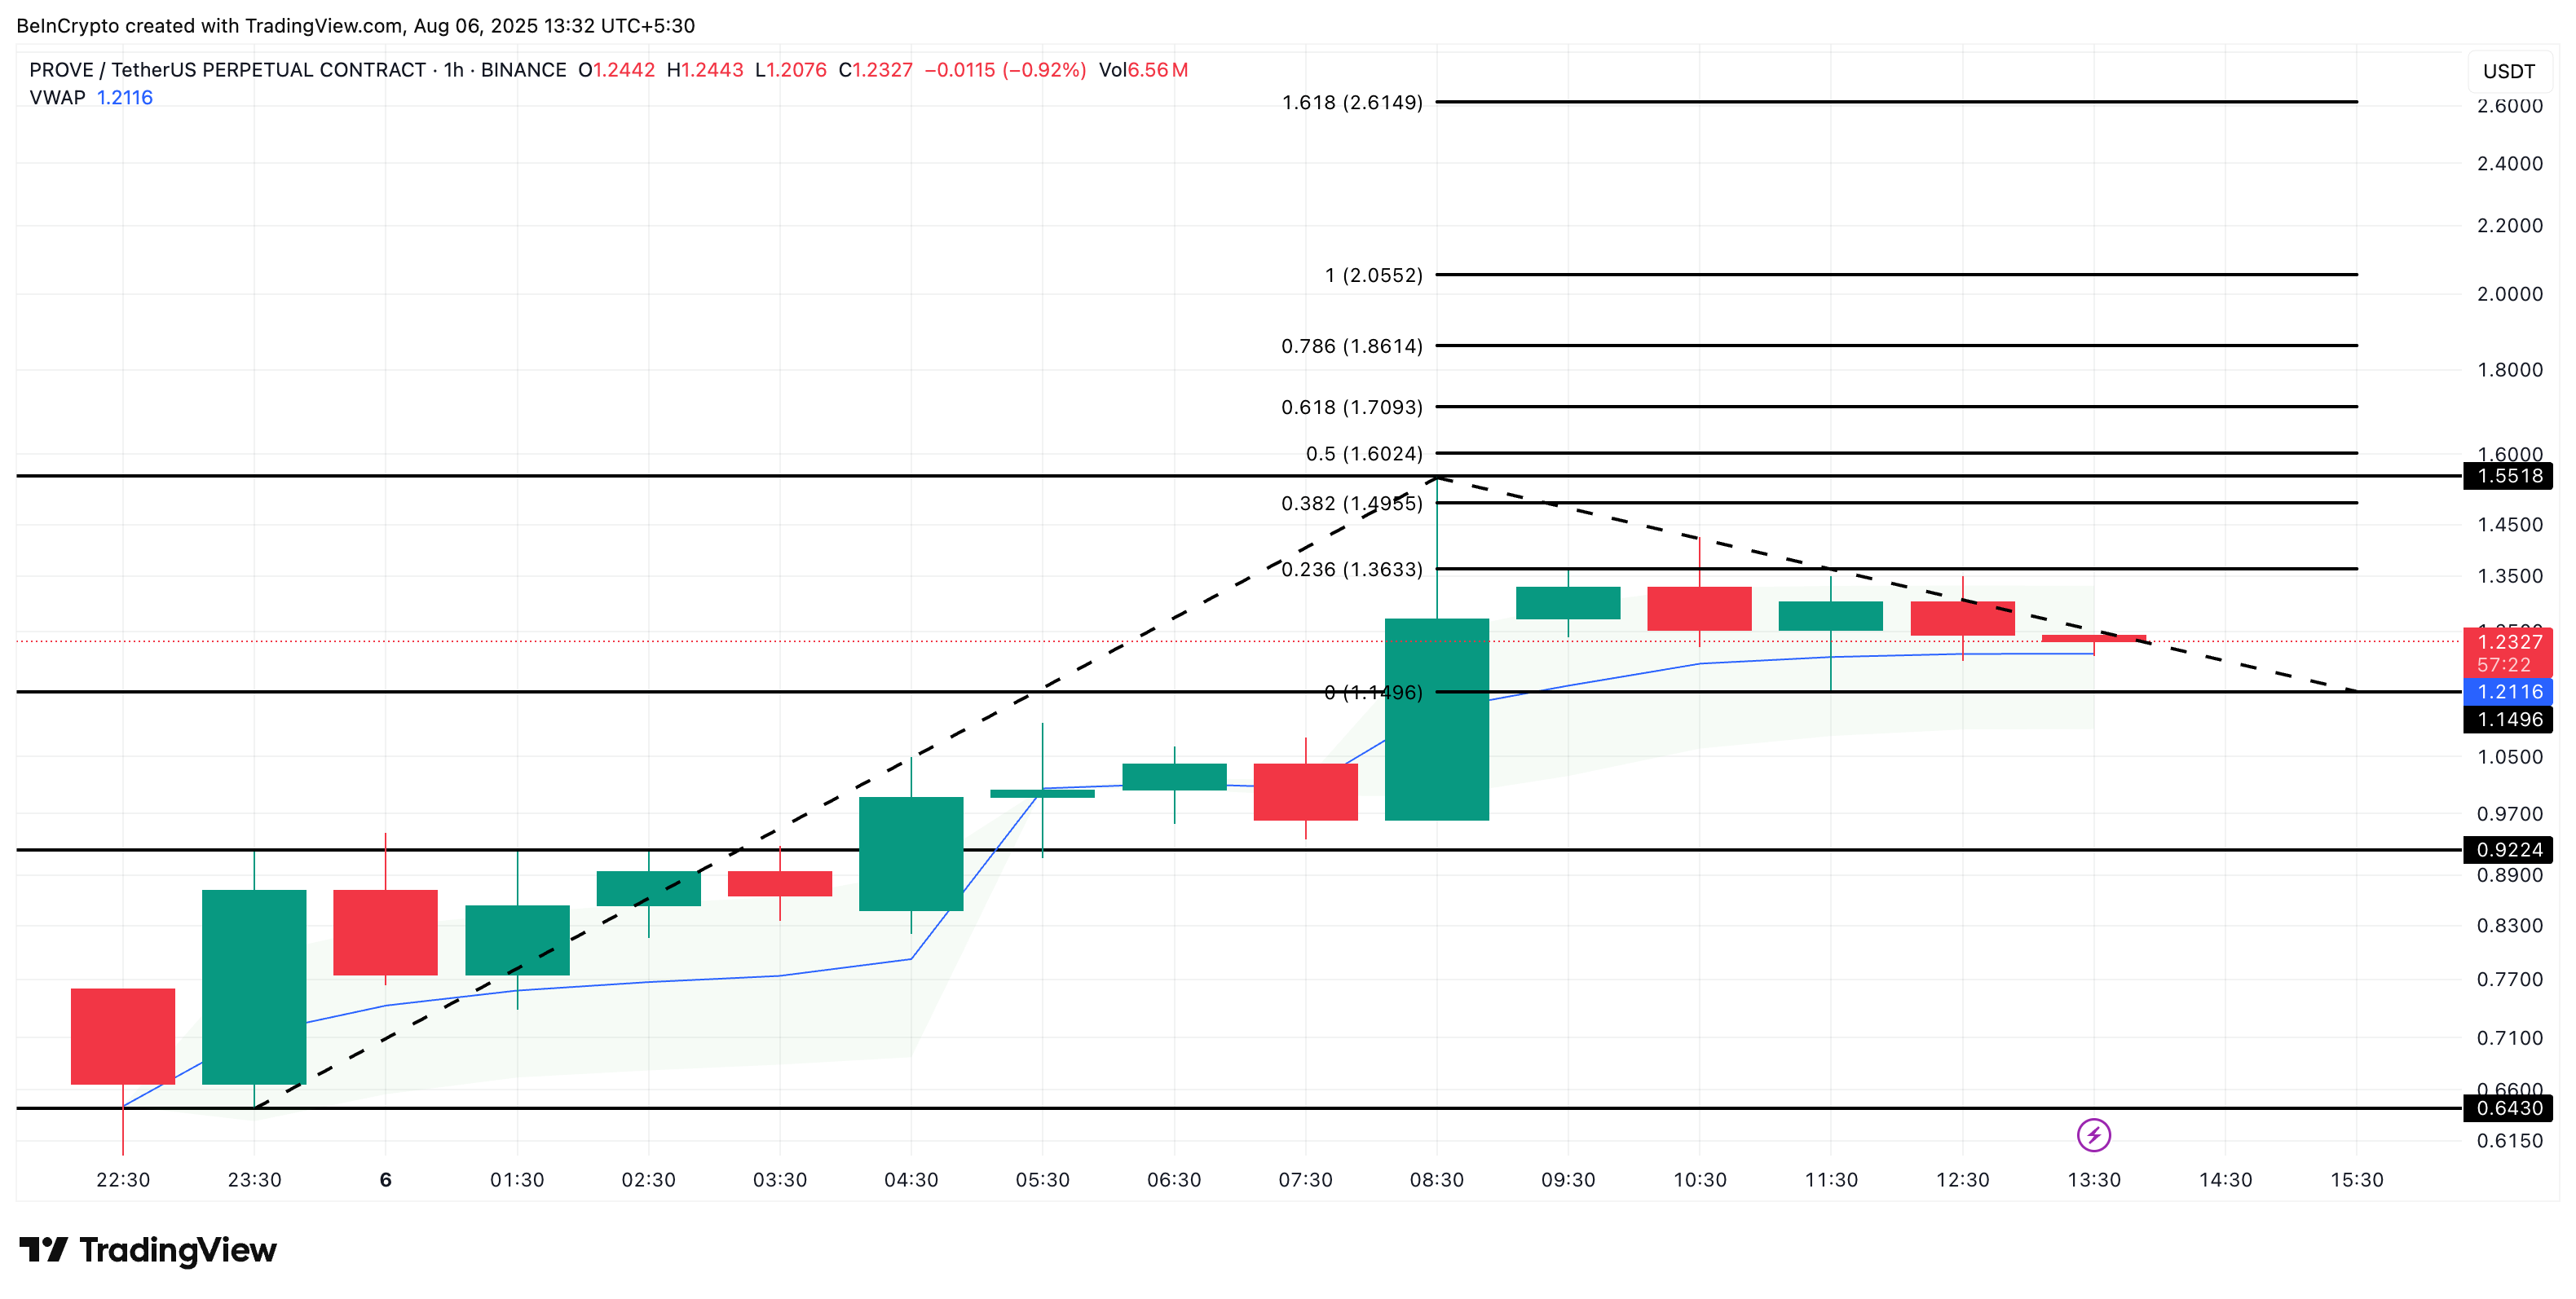
If the VWAP line (blue line) breaks, the next key support is $1.14 and then $0.92. A fall below the latter WOULD risk forming a new all-time low (below $0.64), invalidating the short-term bullish structure entirely.
Note: The first candle from the left was discarded as the low of the Fibonacci extension due to the listing volatility.
VWAP is a popular intraday indicator that traders use to assess whether a token is trading at a premium or discount relative to its average price throughout the day. When the price stays above VWAP, it usually suggests buyers are in control in the short term. In this case, PROVE maintaining above VWAP adds a LAYER of support beneath the current range.
But if PROVE manages to push past $1.36 and then $1.49, the 0.618 Fib level at $1.70 opens up as the next target. Do note that this trend-based Fibonacci extension pattern might keep shifting as PROVE is still experiencing post-listening volatility.
Bullish Pennant Forms on 15-Min Chart, But 9/15 EMA Cross Still Unconfirmed
Zooming into the 15-minute chart, we see a textbook bullish pennant forming;lower highs converging with higher lows in a symmetrical triangle. This pattern typically resolves in the direction of the prevailing trend, which here is upward from the $1.58 breakout zone.
If the Succinct (PROVE) price breaks $1.49 (per the 1-hour chart), it would also mean a pennant breakout. However, a clear trend-backed breakout level lies above $1.61, which also aligns with the 1-hour Fib chart from earlier.
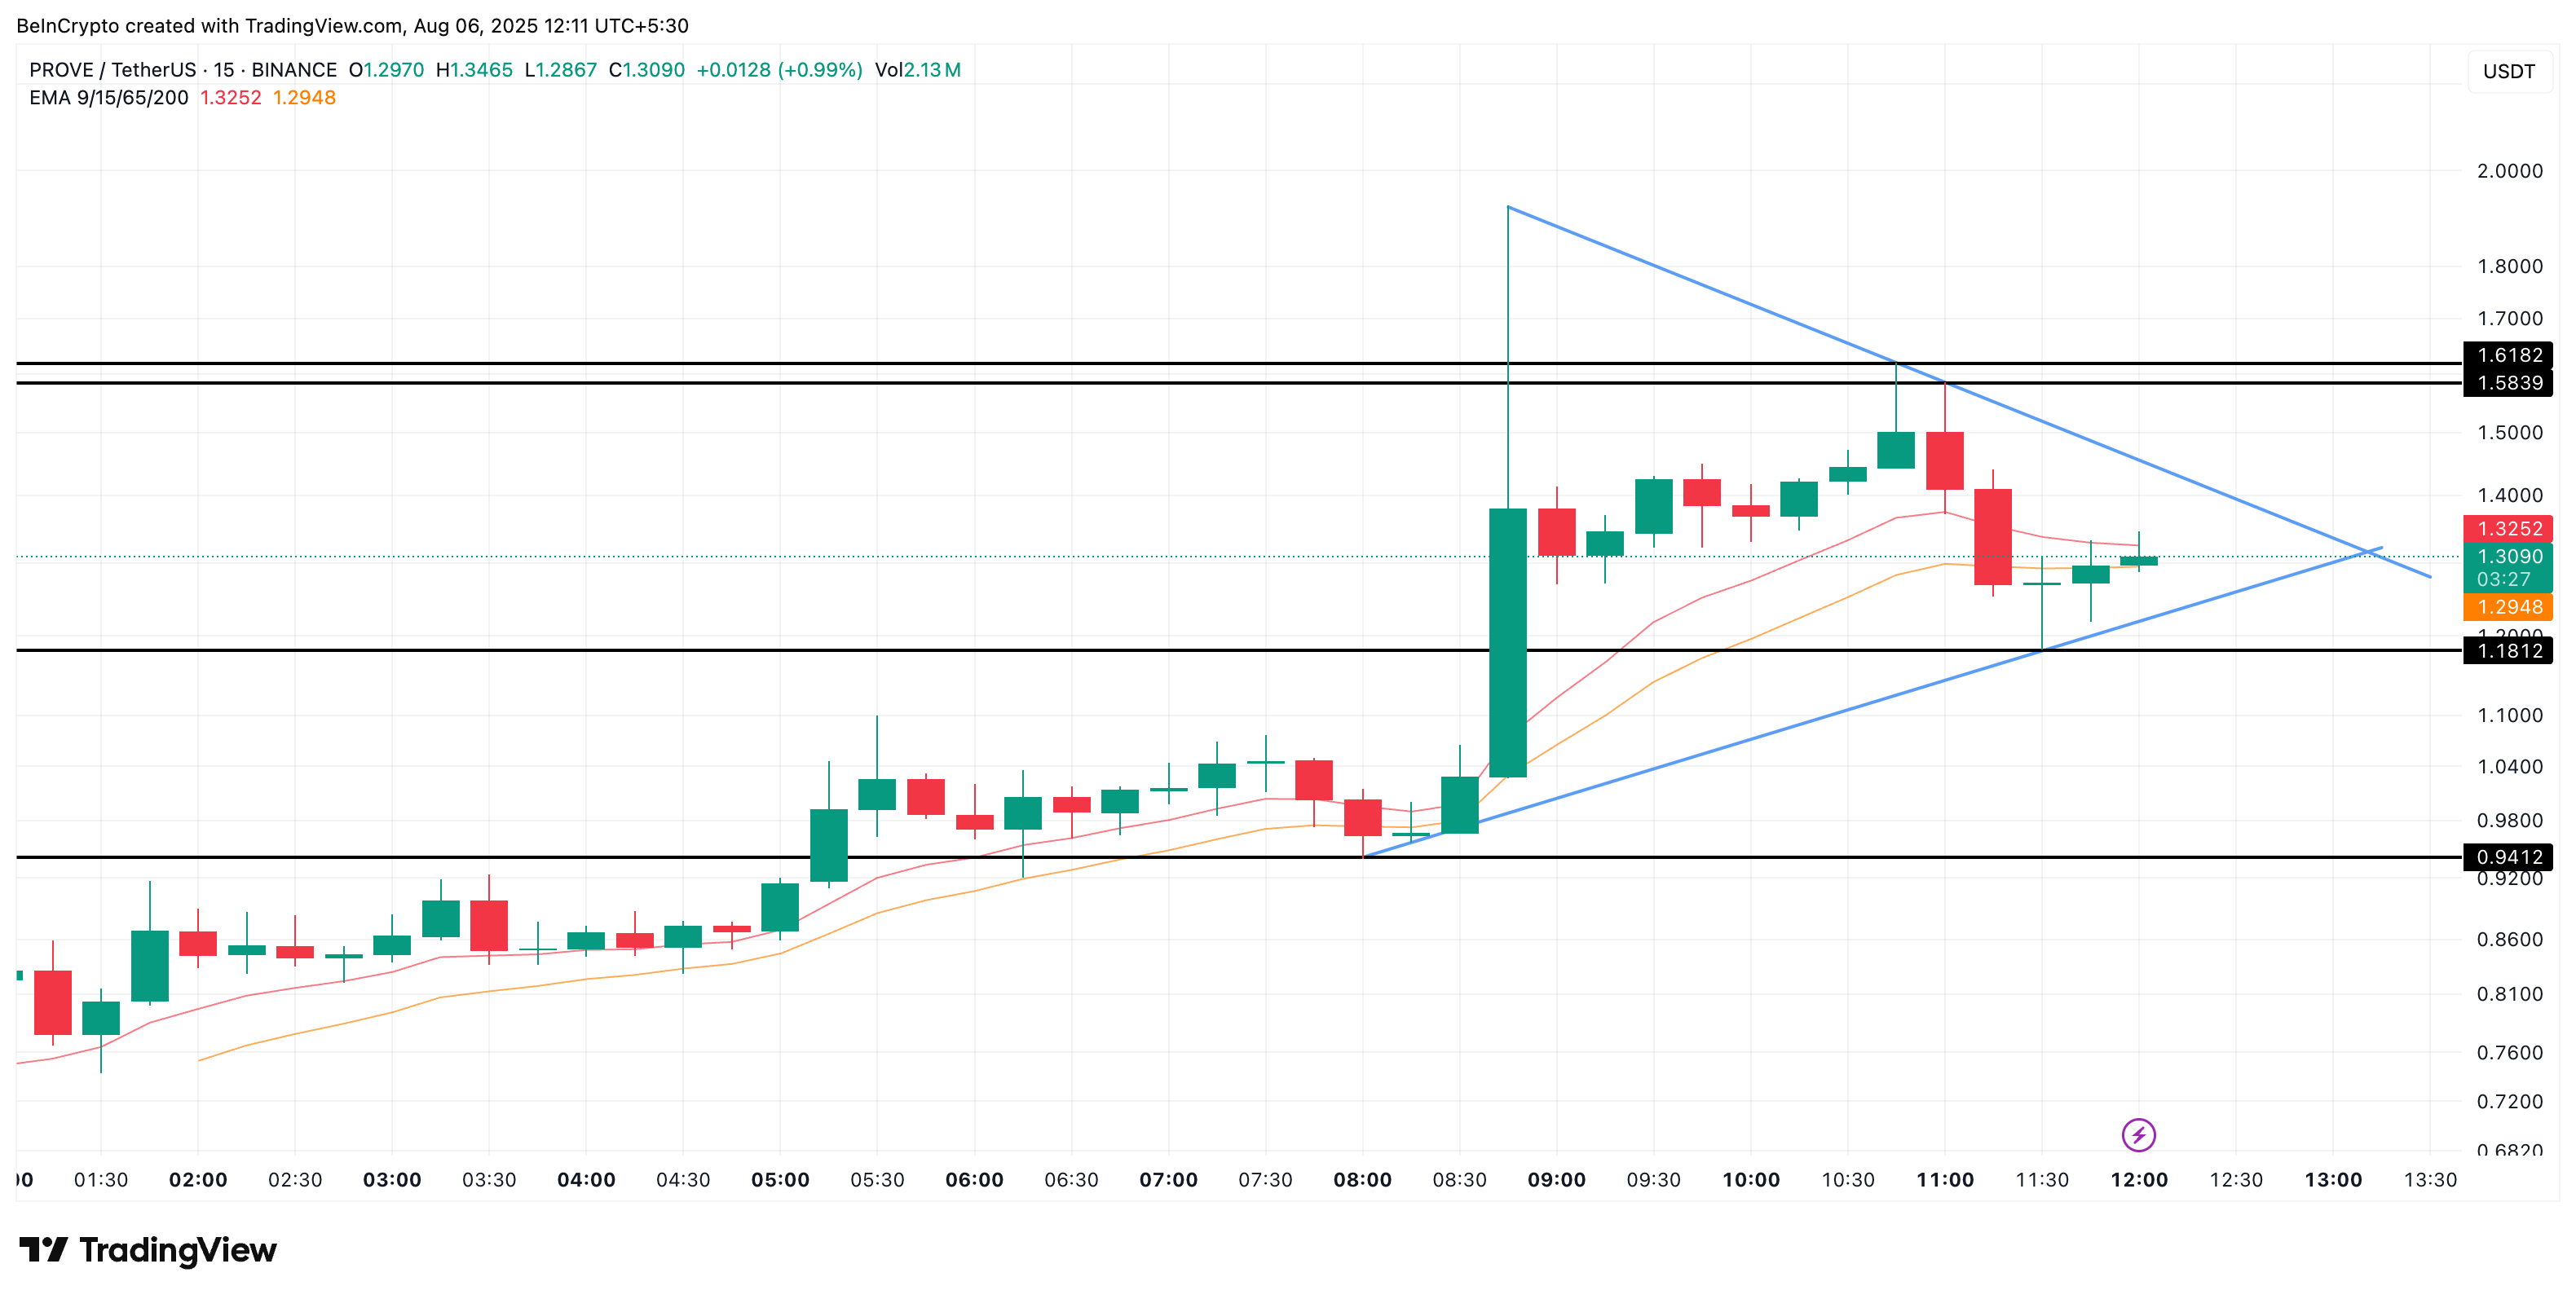
However, a small caveat: the 9 EMA is approaching the 15 EMA, but hasn’t crossed above it yet. Until that crossover confirms, momentum remains neutral on the very short-term scale.
If the crossover happens and the price breaks the upper pennant line ($1.49), it could trigger a short-term rally. That would push the price toward $1.61 or higher. On the flip side, if the pattern breaks downward and $1.18 gives out, sub-$1 becomes a real risk.
