ZORA Price Surges—But Is This a Bull Trap? Late Buyers Beware

ZORA's recent pump has traders buzzing—but the charts whisper caution. Those FOMOing in now might be stepping into a classic crypto bear trap.
Warning signs flash as momentum diverges
While the price action looks tempting, key indicators suggest this rally lacks conviction. RSI's looking overcooked while volume fails to confirm the move—a textbook setup for disappointment.
Smart money's already positioned
Whale wallets have been quietly distributing since the local top. Retail's late arrival to the party? Just in time to hold the bags, naturally.
The eternal cycle repeats
Another altcoin, another pump-and-dump waiting to happen. But hey—at least the volatility makes for great Twitter content between rekt stories.
ZORA’s Bullish Steam Fades
Readings from the ZORA/USD daily chart reveal a recent negative crossover in ZORA’s Moving Average Convergence Divergence (MACD) indicator. This occurs when the MACD line (blue) breaks below the signal line (orange), a classic bearish signal suggesting waning momentum.
: Want more token insights like this? Sign up for Editor Harsh Notariya’s Daily crypto Newsletter here.
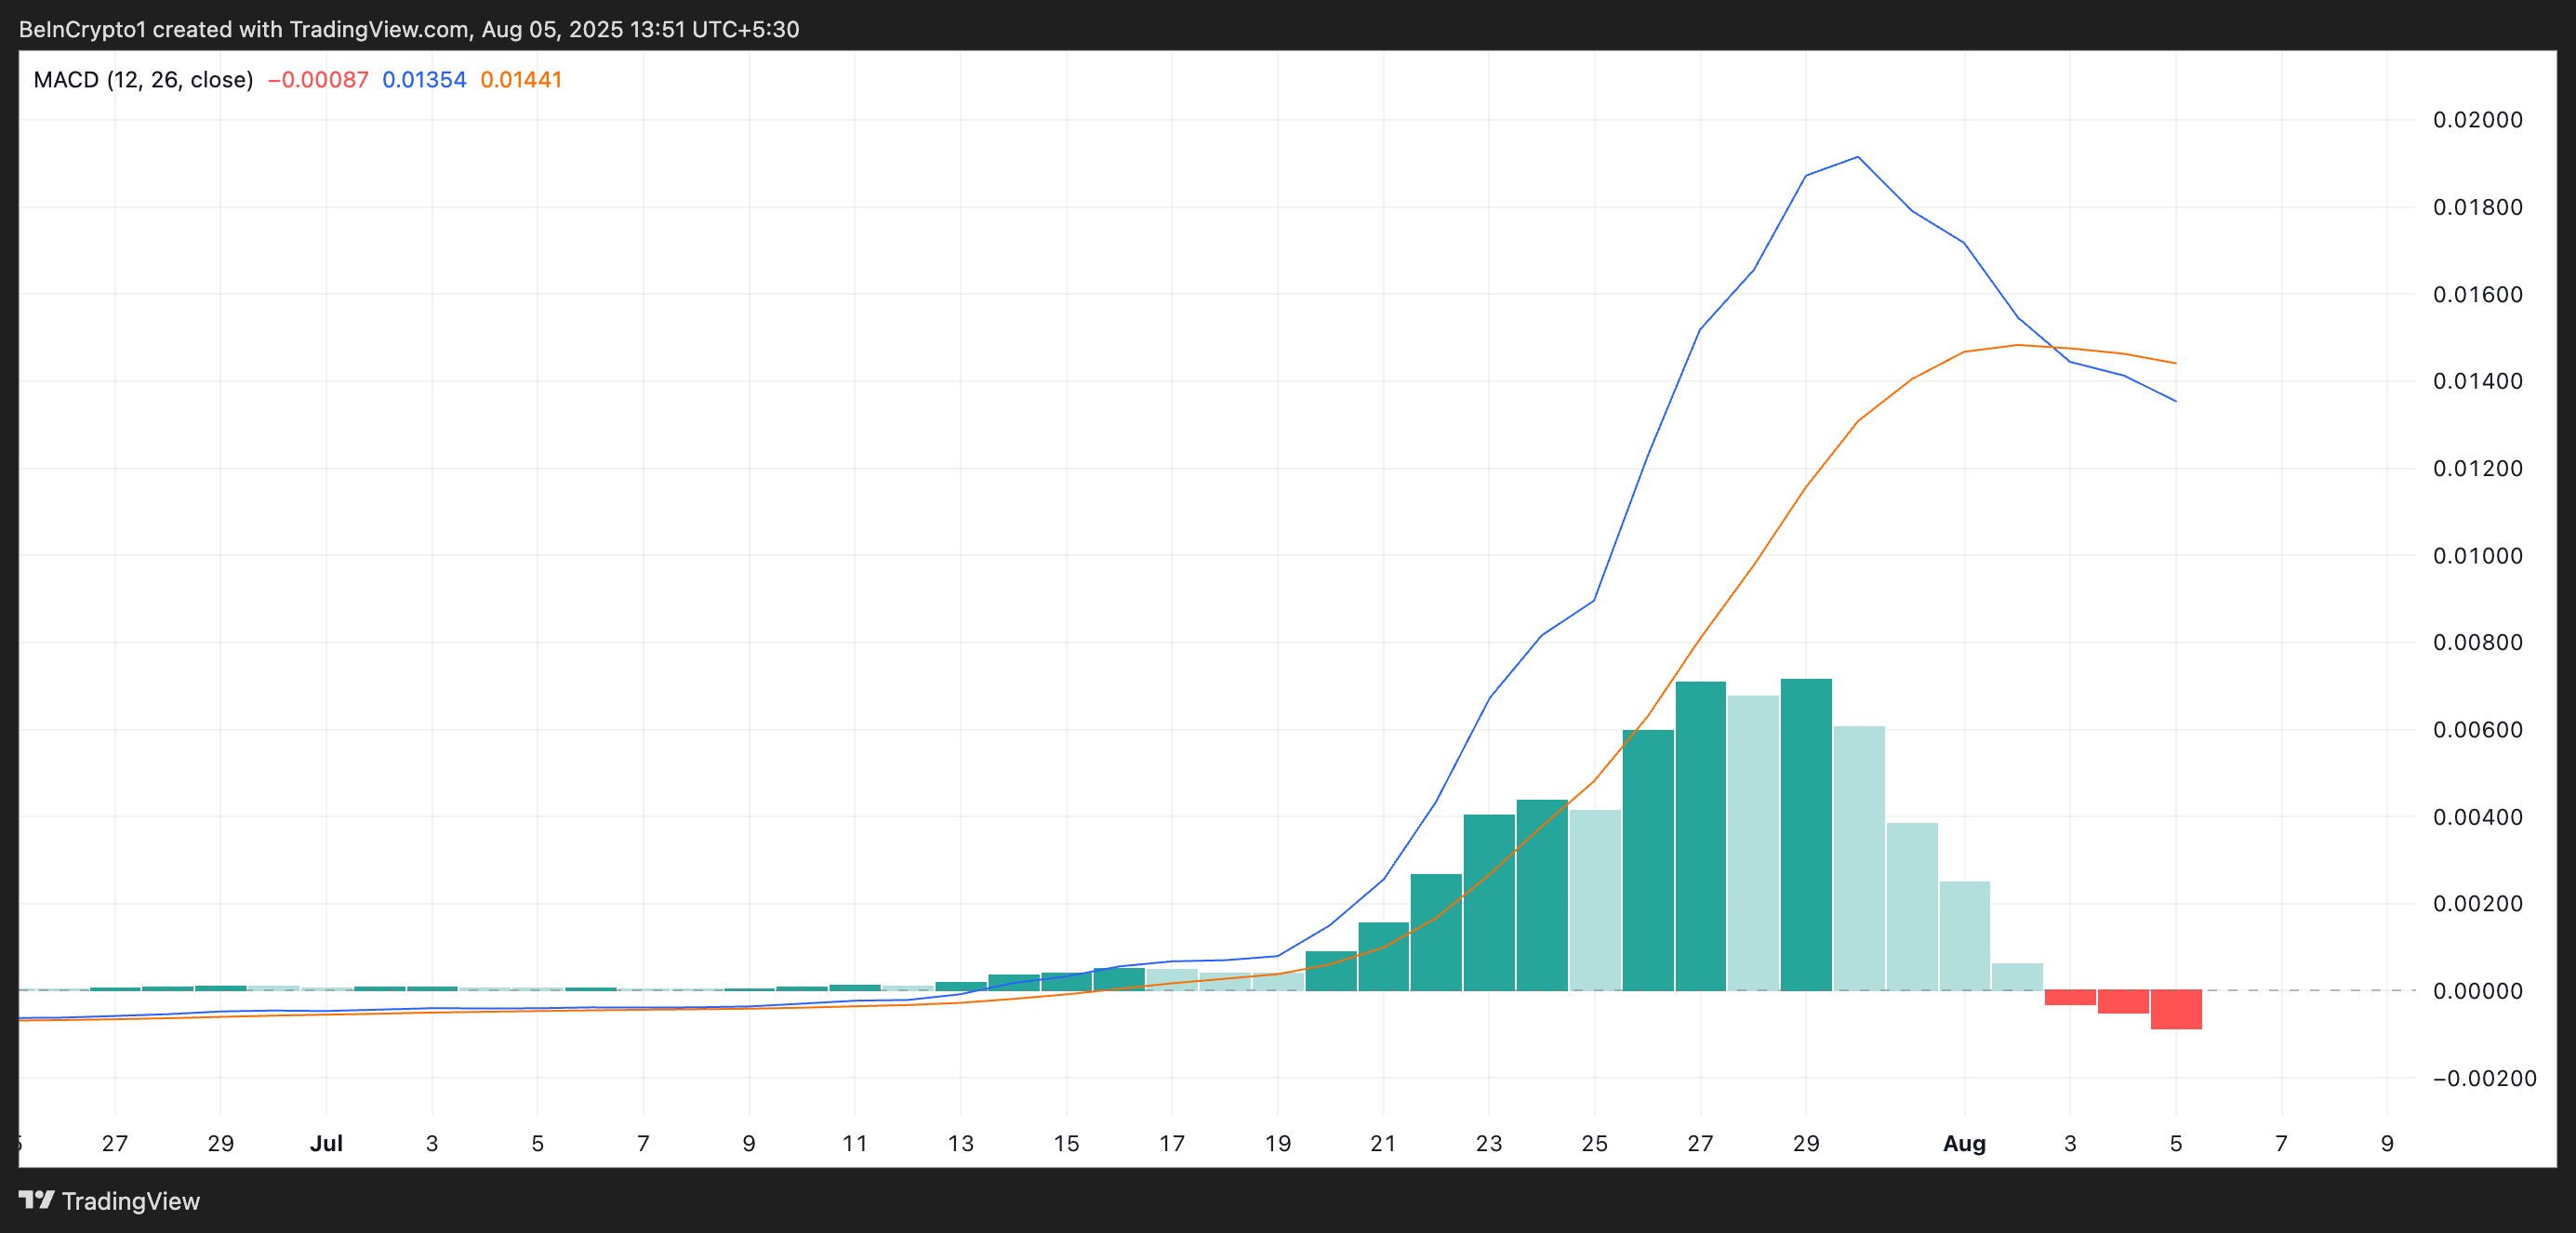
An asset’s MACD indicator identifies trends and momentum in its price movement. It helps traders spot potential buy or sell signals through crossovers between the MACD and signal lines.
When the MACD line is above the signal line, it indicates bullish momentum, suggesting that the asset’s price may continue to rise.
On the other hand, when the MACD line sits below the signal line and falls toward the zero mark — as is currently the case with ZORA — it signals fading bullish momentum and a potential shift toward bearish control.
Furthermore, the sentiment among ZORA’s futures is not any different. This is reflected by its long/short ratio, which sits at a 14-day low of 0.92.
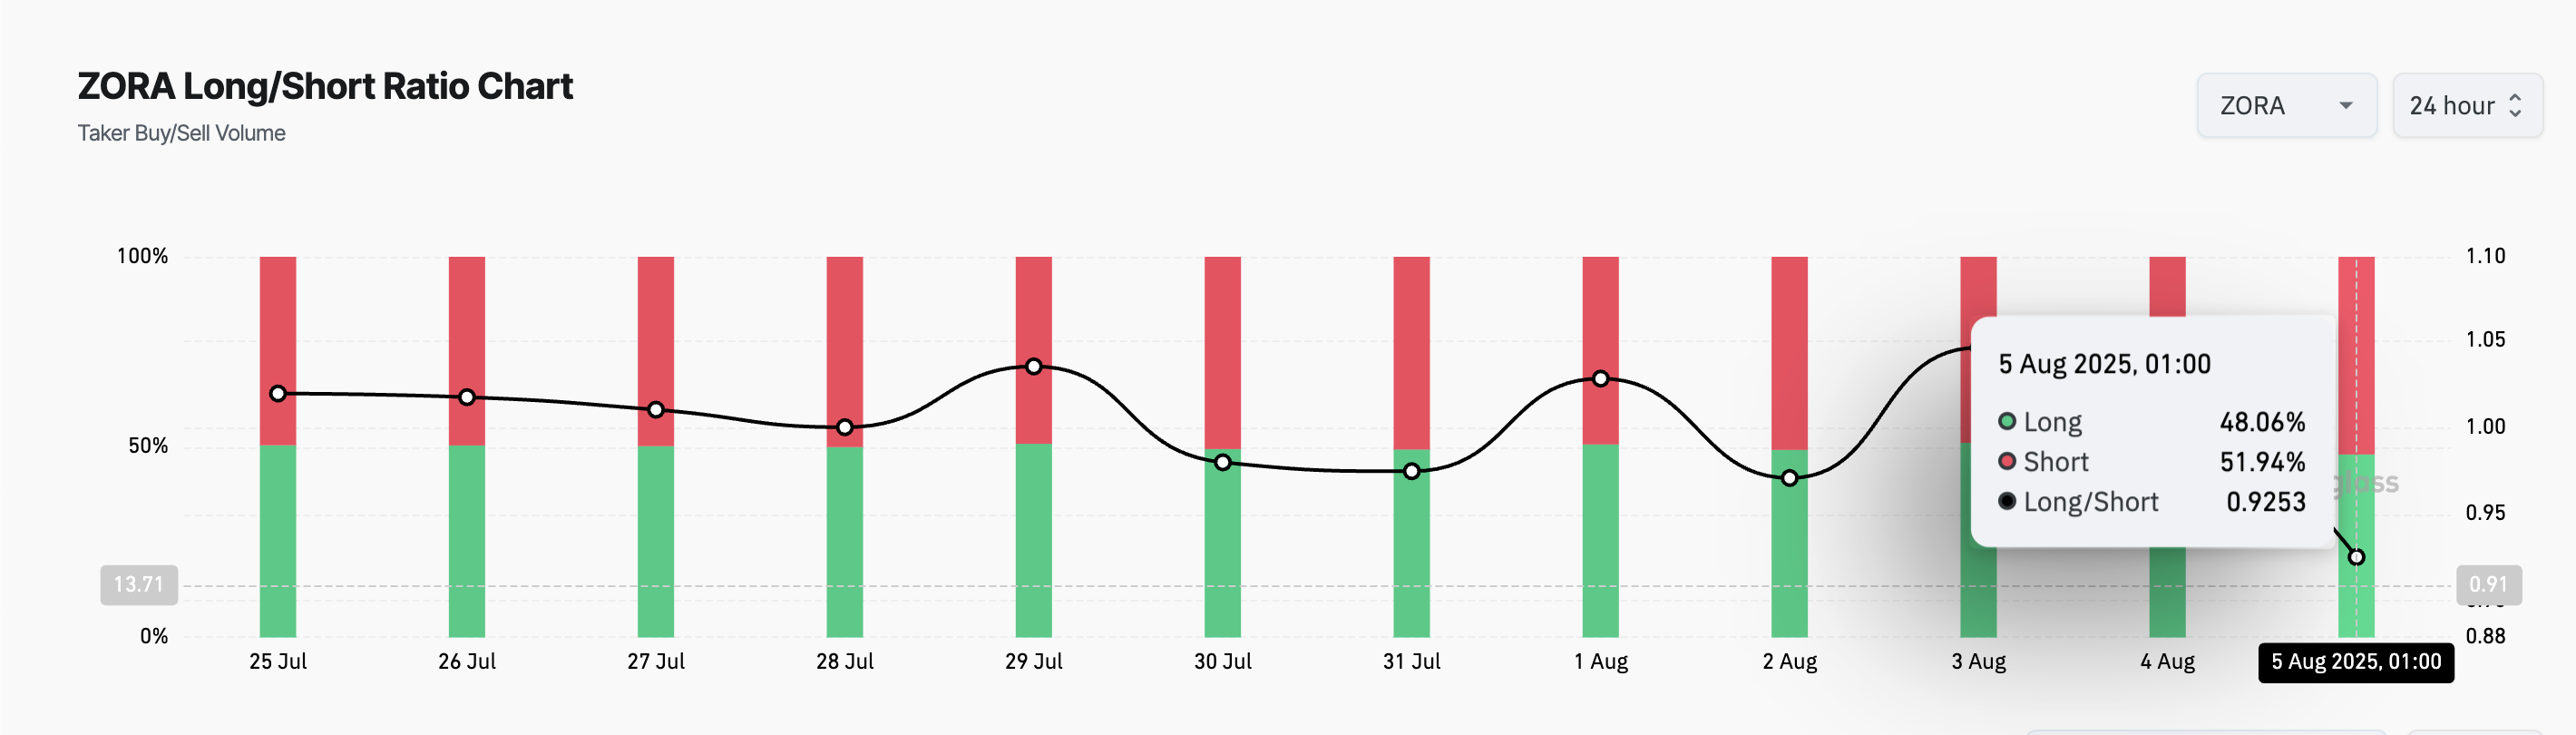
The long/short metric measures the proportion of long bets to short ones in an asset’s futures market. A ratio above one signals more long positions than short ones. This indicates a bullish sentiment, as most traders expect the asset’s value to rise.
On the other hand, a long/short ratio below 1 means that more traders are betting on the asset’s price to decline than those expecting it to rise.
Therefore, ZORA’s current long/short ratio suggests that most traders are increasingly bracing for a correction rather than a push to new highs.
ZORA Stalls at Resistance — Traders Brace for Sharp Move
At press time, ZORA trades at $0.06799, resting just below the resistance formed at $0.06802. If the bears strengthen their control and buying falls, the token could witness a pull toward the support floor at $0.05666.
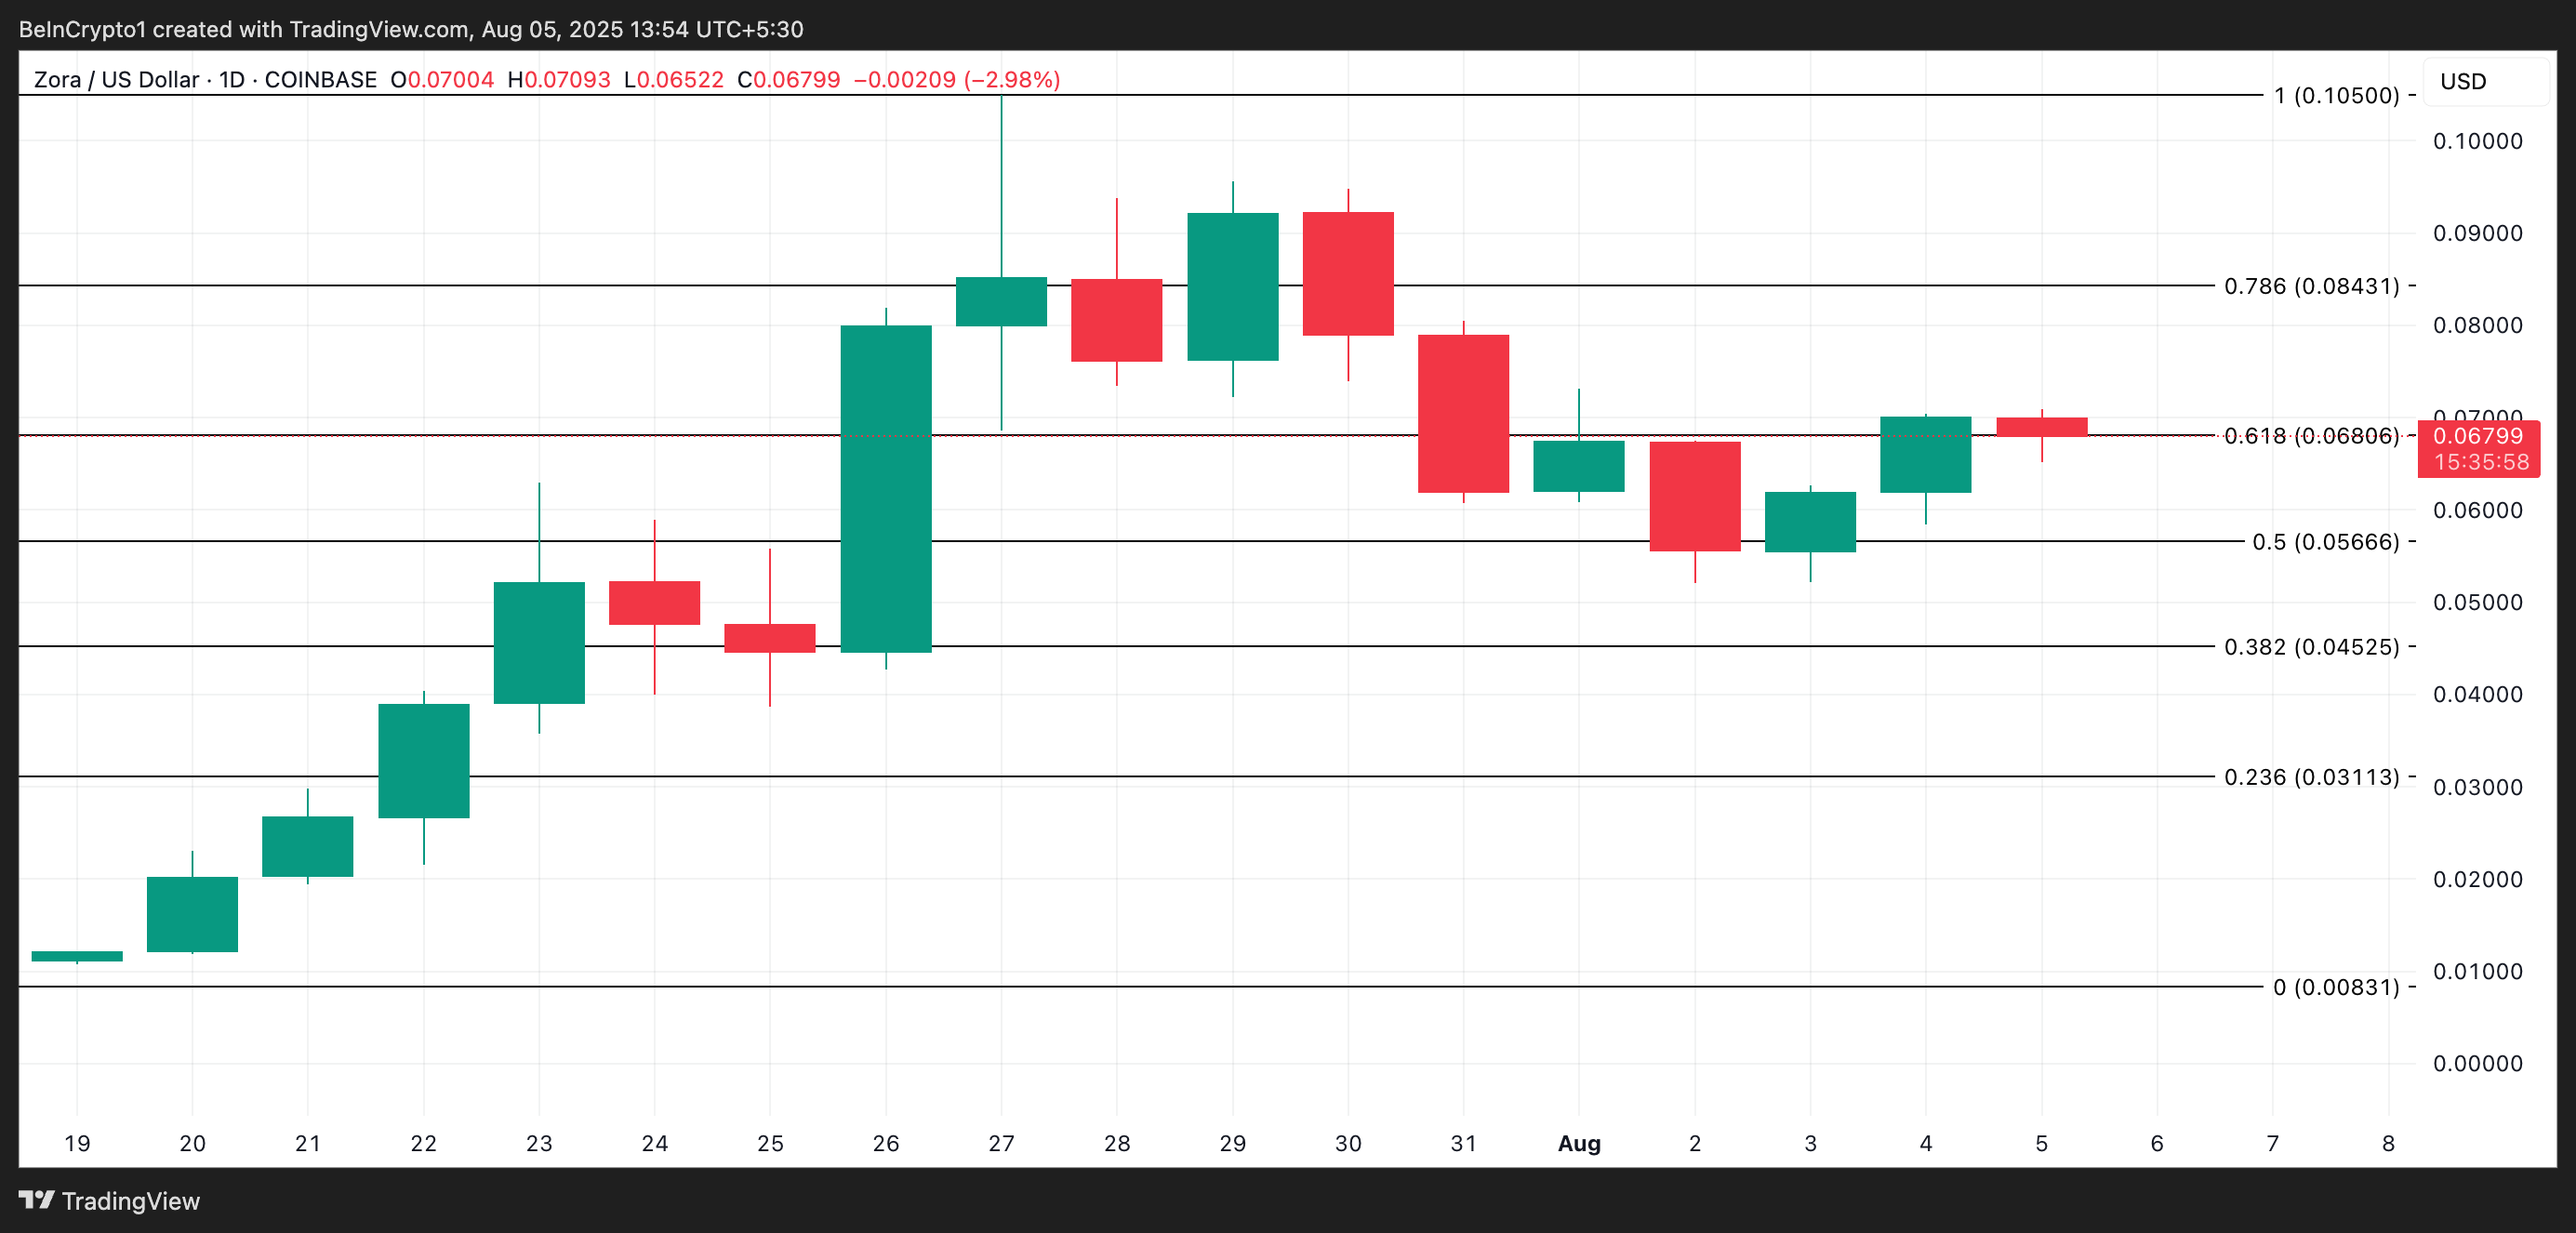
However, if accumulation grows and ZORA breaches $0.6802, it could extend its gains to $0.08431.
