Pi Coin’s Survival Hinges on This Make-or-Break Divergence

Pi Coin traders might finally catch a break—if the stars align just right.
### The Divergence That Could Save Pi
A rare technical pattern is forming, and if history repeats, Pi could dodge another brutal downturn. No promises—this is crypto, after all.
### Why This Time *Might* Be Different
Past cycles suggest Pi’s current bleed could reverse if key support holds. But let’s be real: ‘support’ in crypto often means ‘place where hopes go to die.’
### The Fine Print
Even if the divergence plays out, Pi’s team still needs to deliver something besides mining apps and vague roadmaps. Maybe try shipping a product? Just a thought.
Bottom line: Pi’s fate rests on a razor’s edge—typical Tuesday for altcoins. Bulls get one shot. Miss it, and well… enjoy the ride back to ‘fair value’ (zero).
Bears Losing Their Edge as Bull-Bear Power Shifts
Sellers have had firm control over PI’s trend for weeks. That’s why the Bull-Bear Power (BBP) indicator is important right now. When bearish strength starts fading after an extended downtrend, it can often signal that sellers are running out of steam.
That’s what the chart is beginning to show. BBP has been rising since August 1, shifting from a deeply negative zone to a less aggressive print, similar to what happened between July 15 and 21. Back then, the fading bearish momentum preceded a MOVE from $0.45 to $0.52.
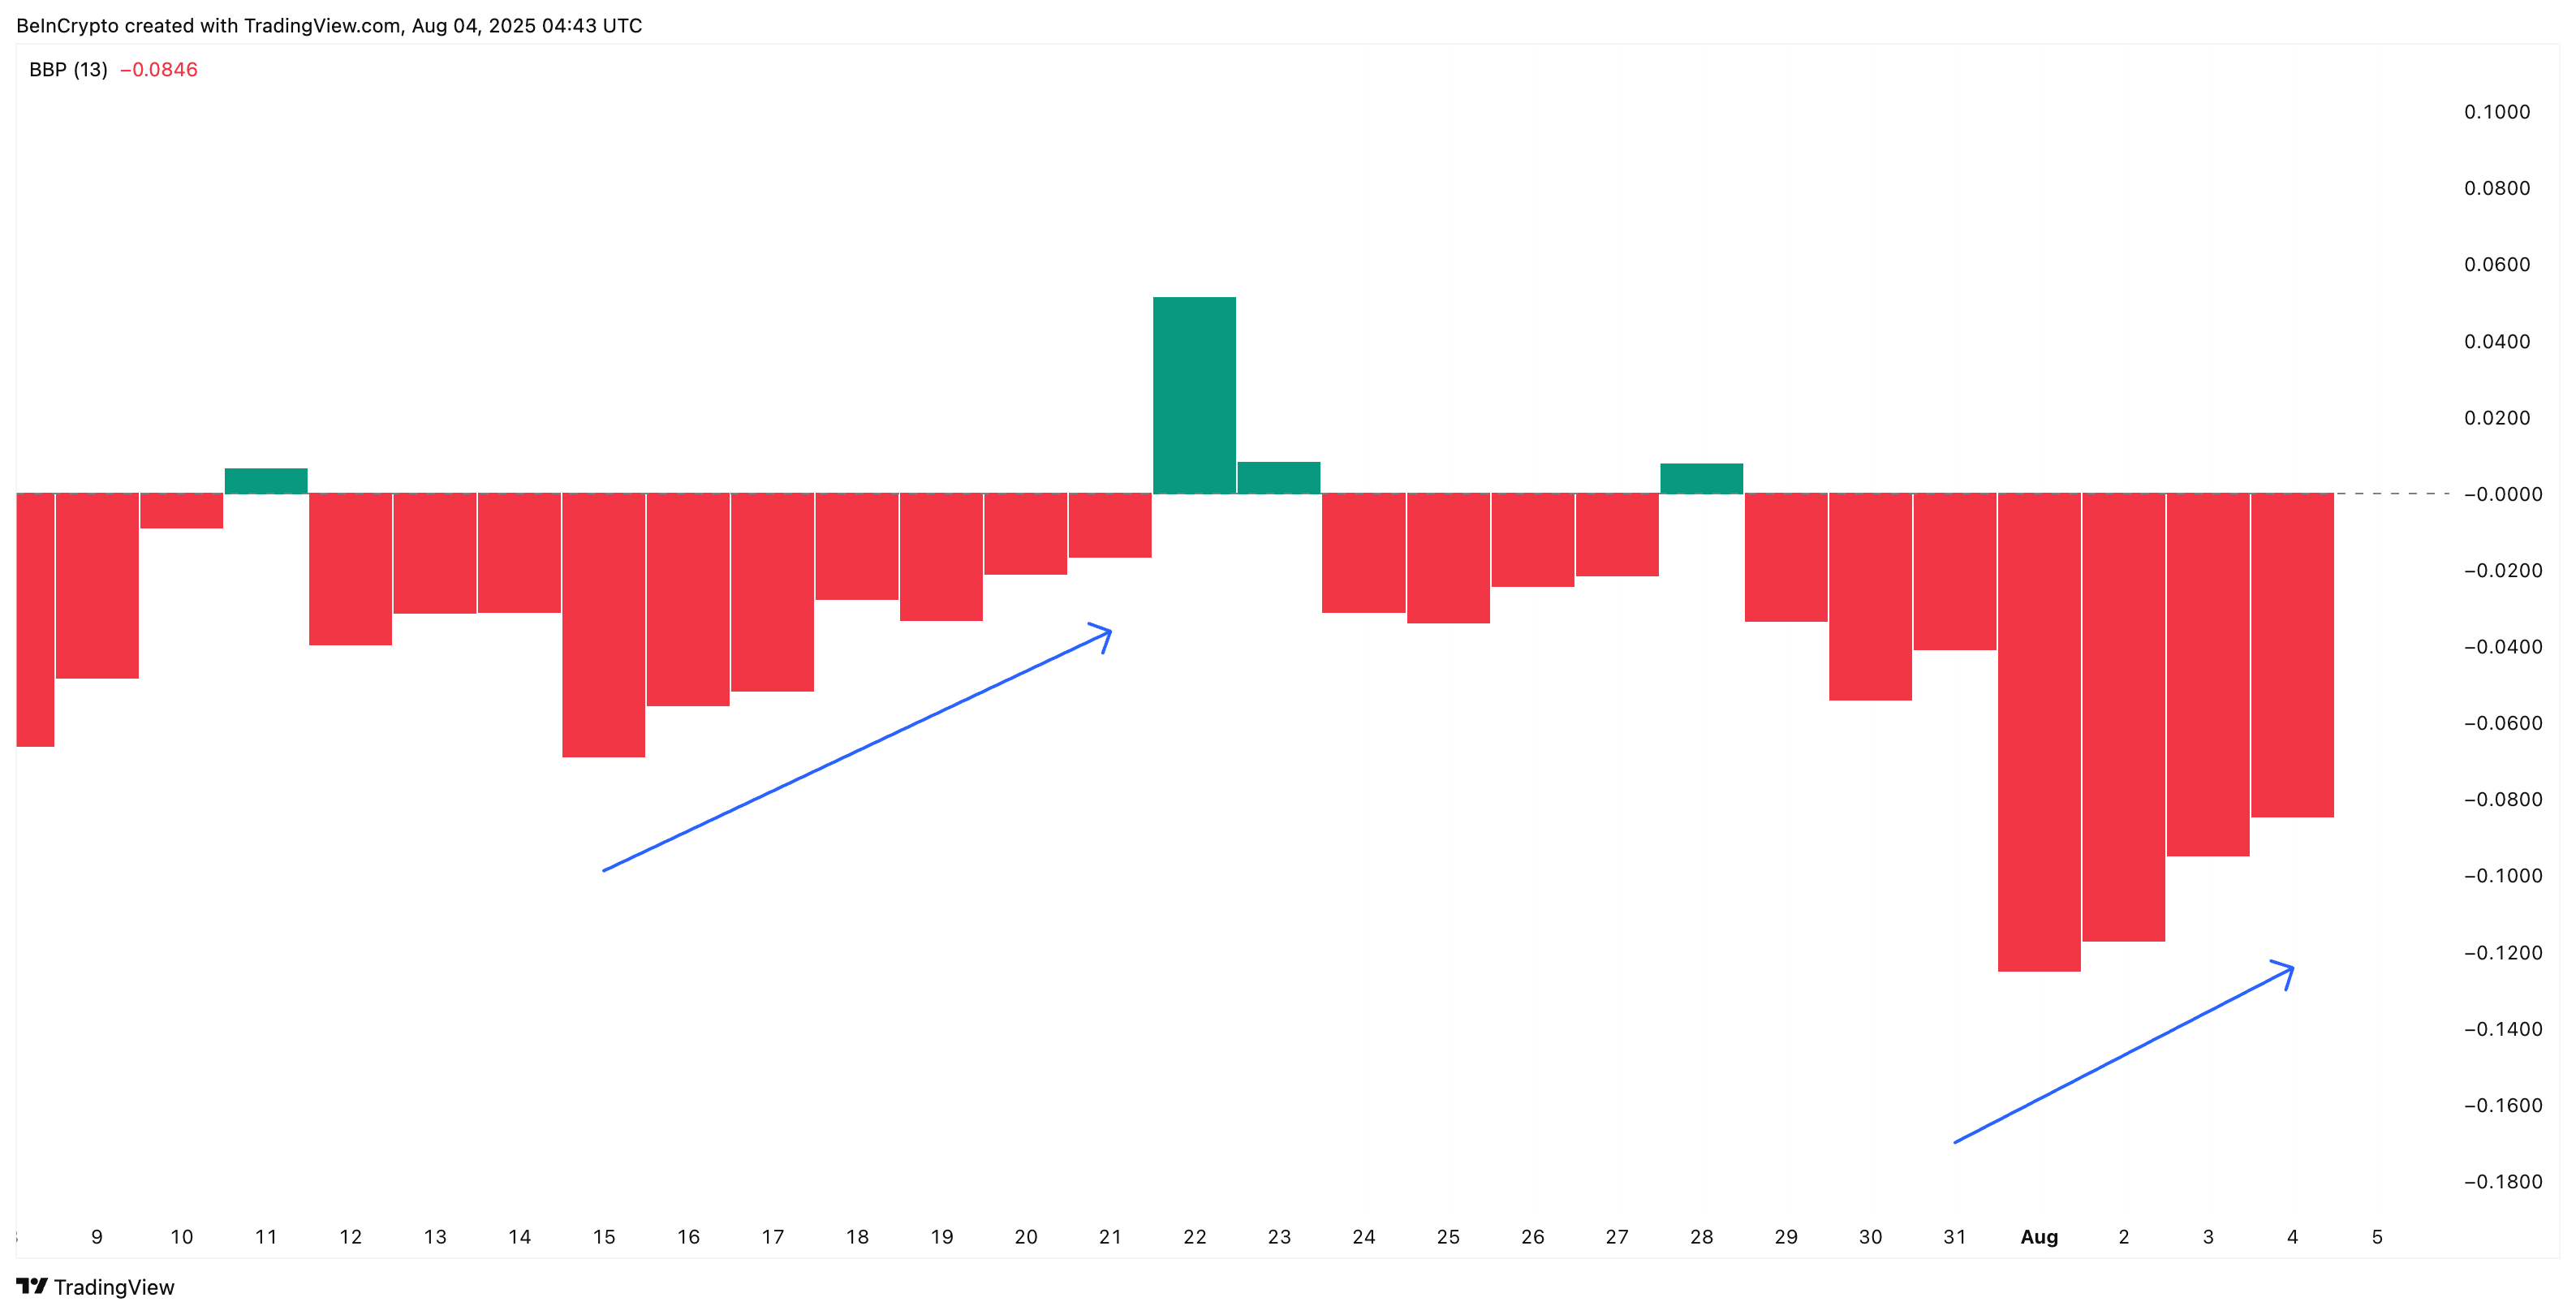
The Bull-Bear Power indicator tracks the difference between the highest price and a short-term moving average to show whether bulls or bears are currently in control.
Supporting this is social dominance, which measures how much of the crypto conversation is about PI. Between August 1 and 3, PI’s social dominance formed a three-day streak of higher highs, just like it did between July 15 and 23. That earlier stretch aligned with a local price bottom and led to that surge to $0.52.
: Want more token insights like this? Sign up for Editor Harsh Notariya’s Daily Crypto Newsletter here.
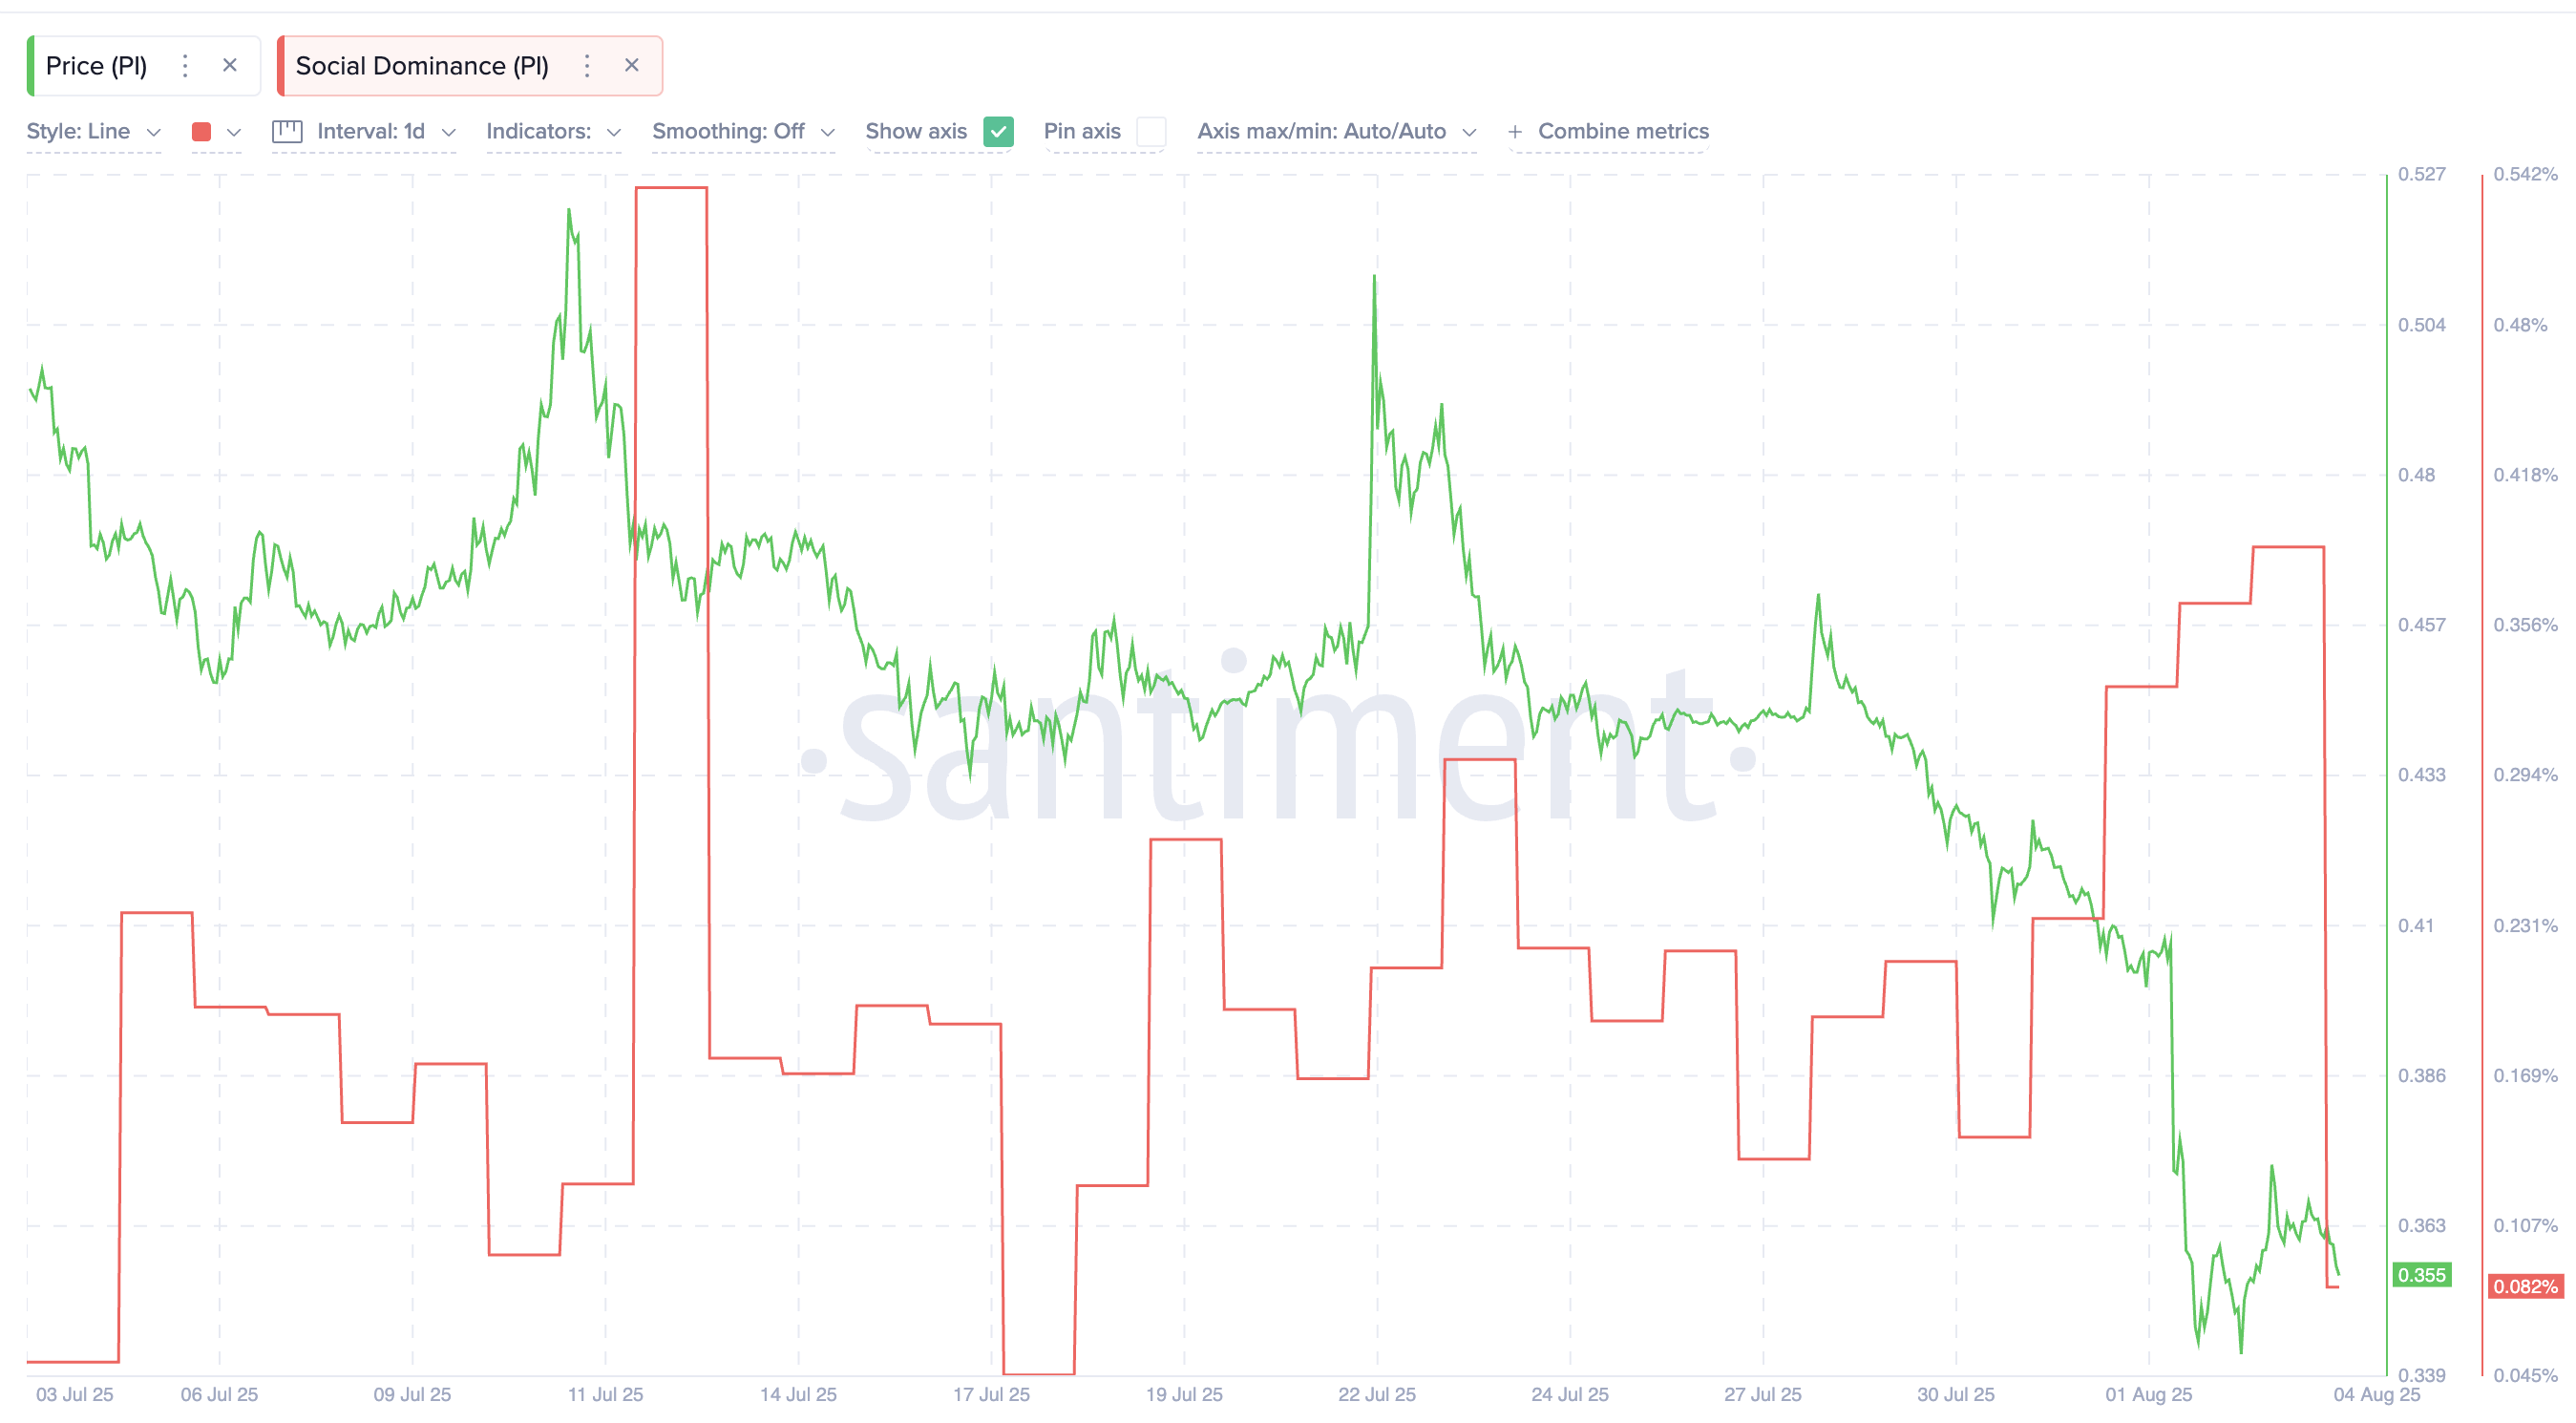
The alignment of sentiment and weakening bearish strength now adds weight to the idea that the Pi price may be preparing for another leg up.
RSI Shows Bullish Divergence, But Pi Coin Price Needs to Respond
The Relative Strength Index (RSI) is currently at 23.37, indicating oversold territory. But beyond the number, the pattern it’s forming matters more.
PI’s price recently made a higher low, while the RSI made a lower low. This setup is known as a hidden bullish divergence, and it’s often seen before local bottoms.
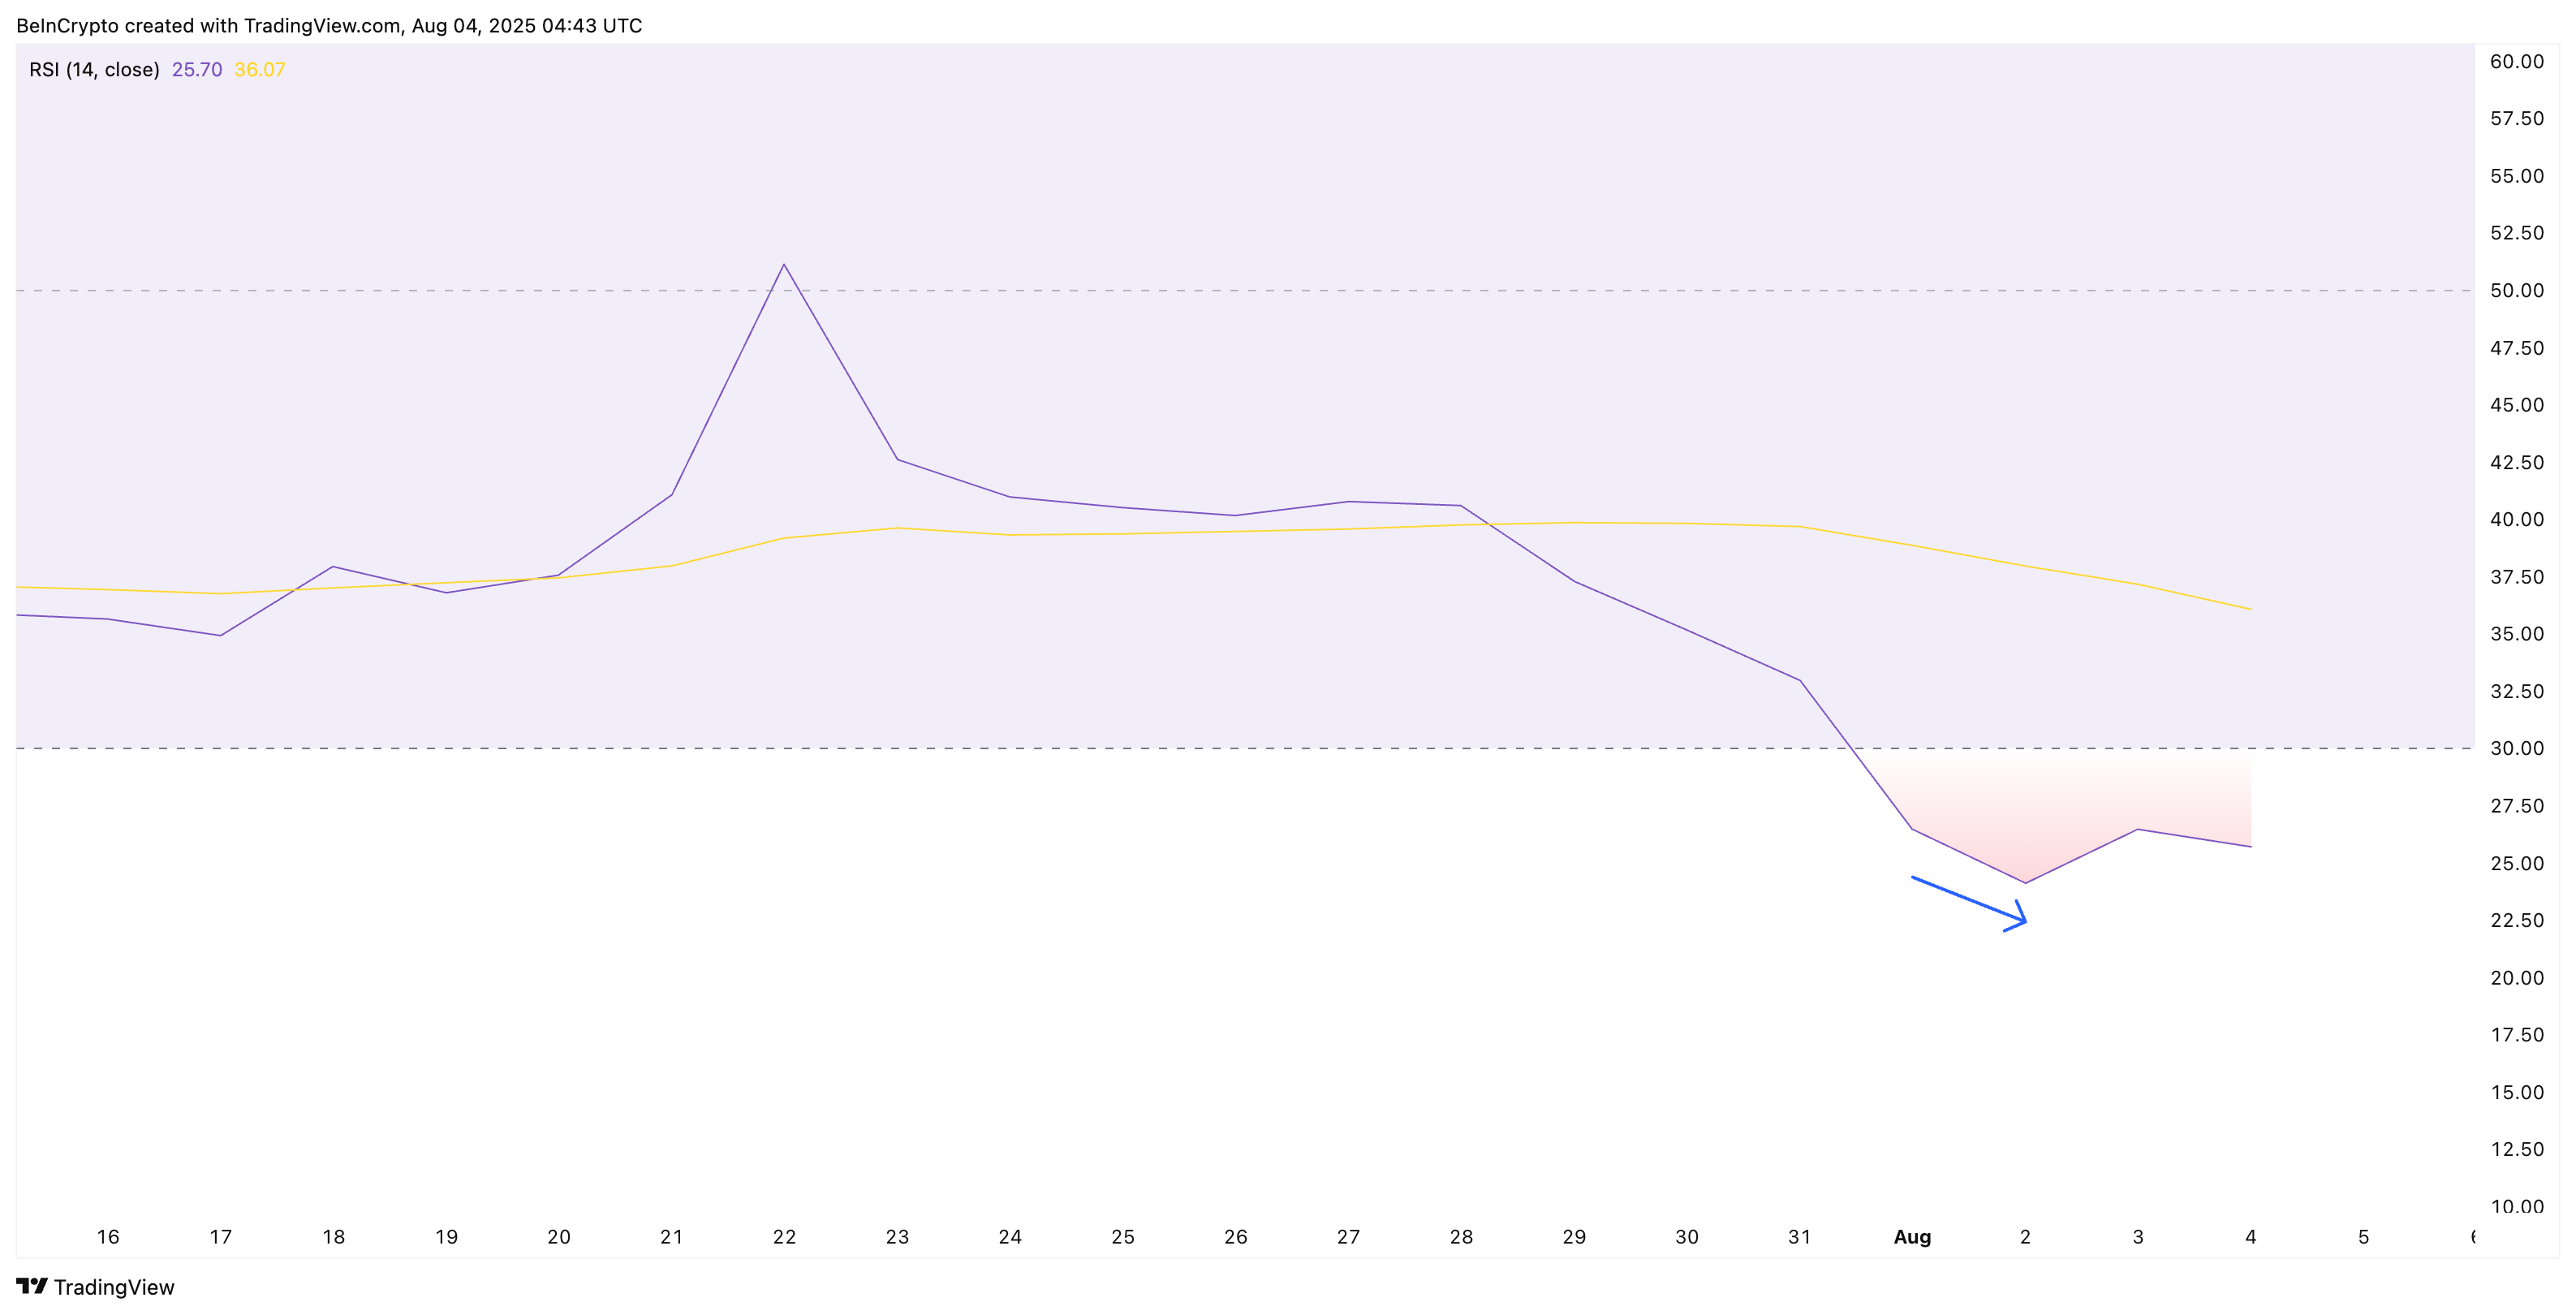
At first glance, a falling RSI might seem bearish. But when price doesn’t follow it lower, that’s usually a sign that downside momentum is weakening, even as sellers try to push. It shows that supply pressure is failing to drag the price further, which can be a bottoming signal.
Still, this kind of RSI divergence alone doesn’t confirm a bounce, especially when PI Coin’s price is declining. It is more like a subtle early sign.
For that, the price needs to move through the resistance.
RSI is a momentum oscillator that tracks the speed and change of price movements. Readings below 30 often signal an oversold asset with potential for reversal.
PI Price Must Clear $0.369 to Signal Breakout
The Pi Coin price is currently trading around $0.35. Based on the Fibonacci retracement drawn from the July 22 high ($0.52) to the July 31 low ($0.32), the next major resistance lies at $0.36, followed by $0.39, and $0.42.
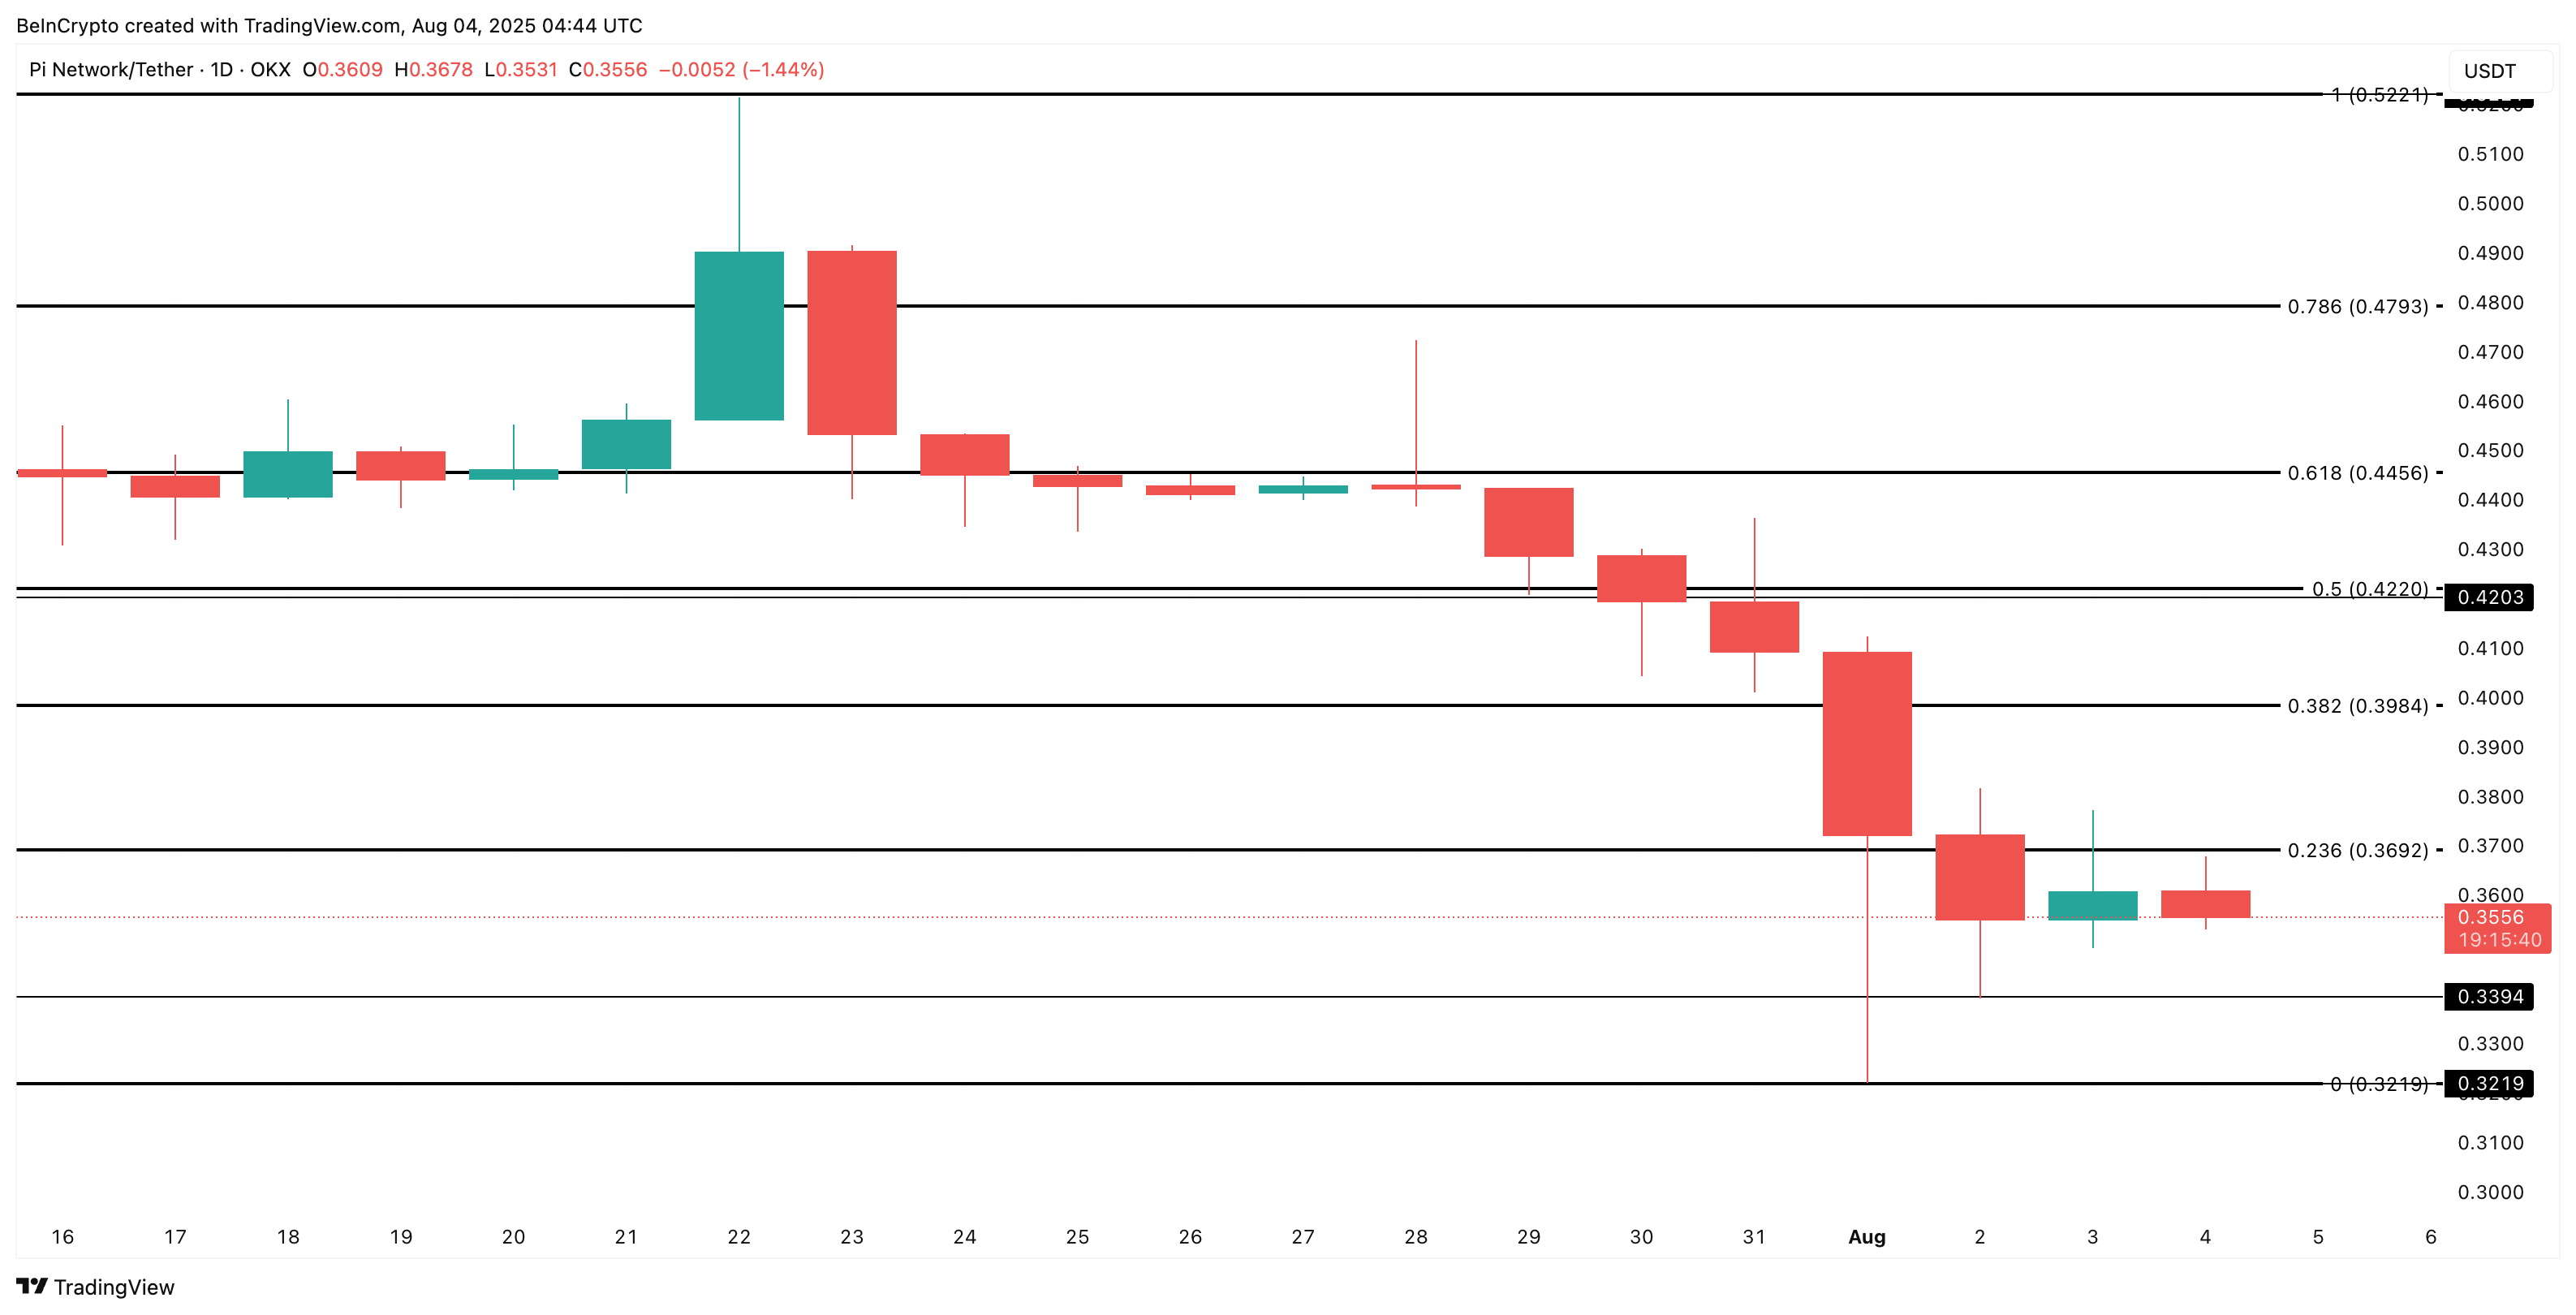
A daily close above $0.39 WOULD be the first sign that the bulls are back in control. But if PI breaks below $0.32, the bullish divergence setup would be invalidated, and the trend may continue lower.
Until then, Pi Coin’s chart may still look heavy, but for the first time in weeks, there’s reason to believe its trajectory could shift. However, this probable shift needs to be backed by an improvement in RSI (possibly a higher high or a lower high) and a further dip in bearish pressure.
