Ethereum Teeters on the Brink: Will $3,000 Support Hold Against This Critical Technical Signal?

Ethereum's price is dancing on a knife's edge—and traders are holding their breath. The $3,000 level isn't just psychological; it's a make-or-break zone confirmed by a classic technical indicator flashing red. Here's what happens next.
### The $3,000 Line in the Sand
Break below this, and the bulls might need a miracle—or at least a whale with deep pockets. The chart doesn't lie: momentum is fading faster than a meme coin's hype cycle.
### Why This Indicator Spells Trouble
No fancy jargon—just a simple pattern that's crushed hopes before. And guess what? It's lining up like a bearish dominos rally. Traders love to ignore history until it bites them. (Sound familiar, leverage junkies?)
### The Silver Lining Nobody's Talking About
Markets overshoot. Always. If ETH nosedives, it'll be another fire sale for the patient—because nothing makes crypto 'experts' panic like a 20% dip after a 200% run. Stay sharp.
ETH Faces Headwinds as Accumulation Dips and Bearish Signals Mount
Glassnode data shows that Ethereum’s Holder Accumulation Ratio closed at a two-month low of 27.57% on Saturday, a sign that investors are no longer aggressively adding to their ETH holdings.
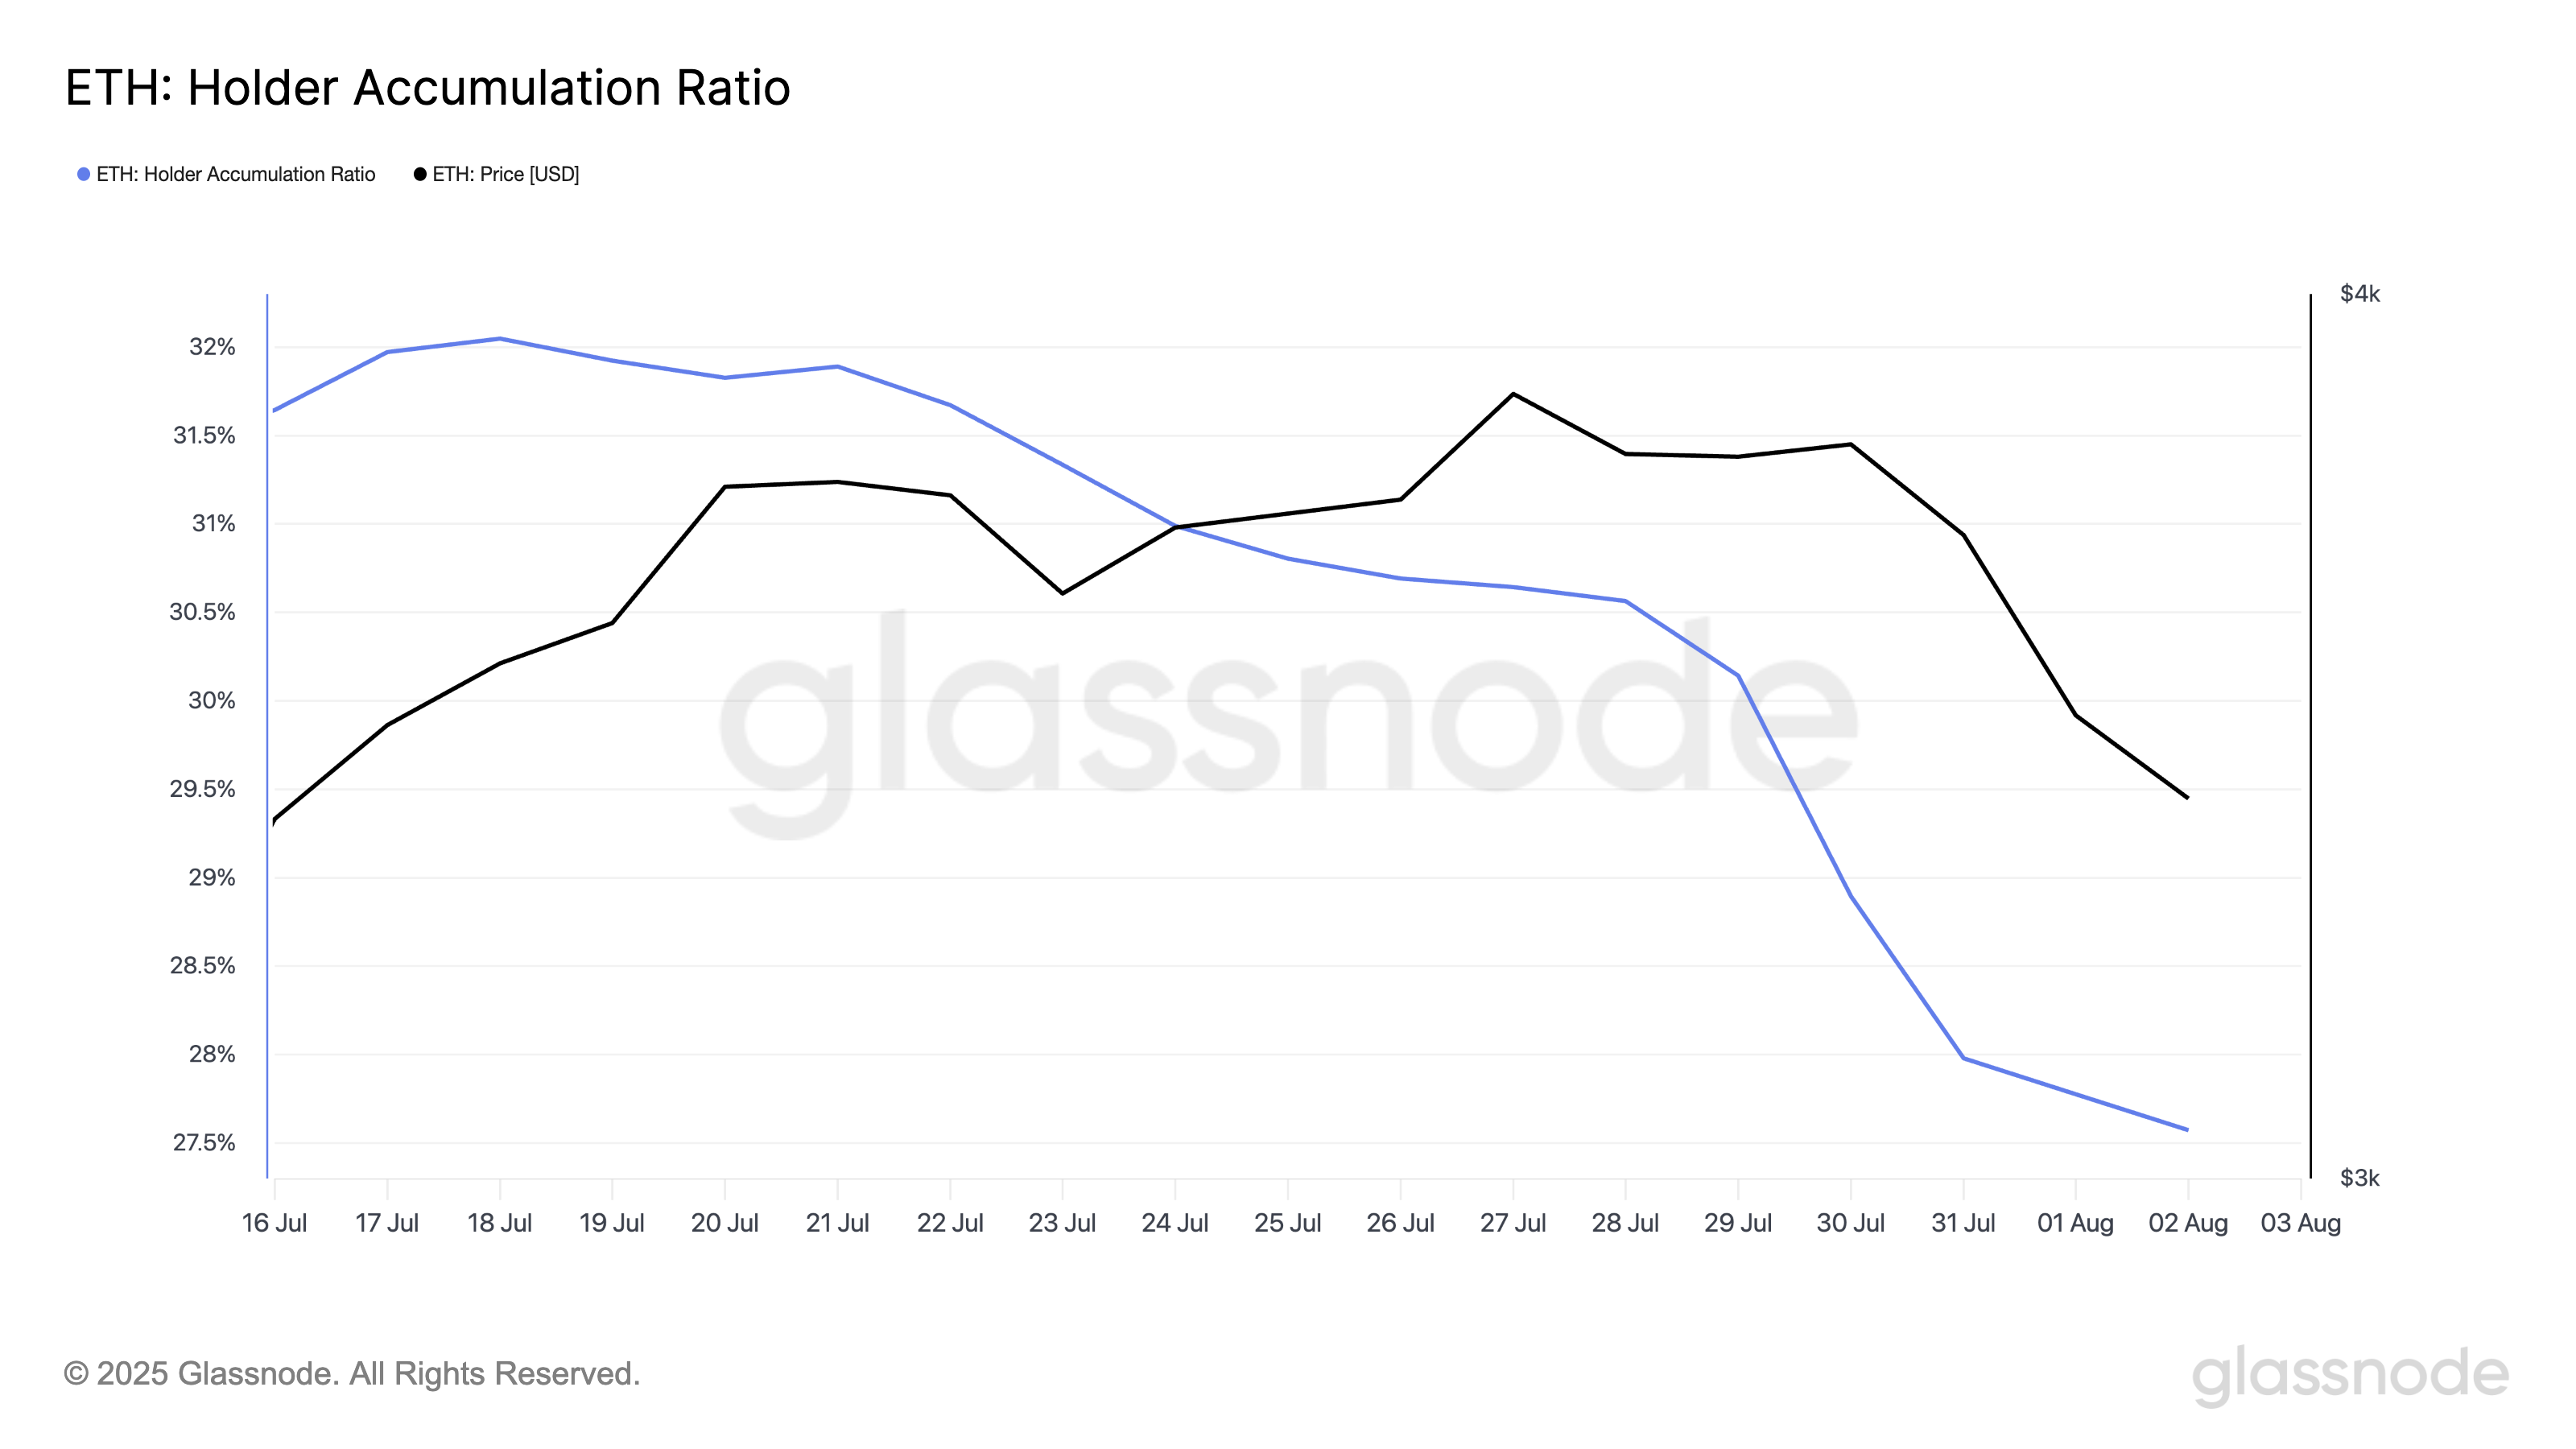
According to the on-chain data provider, this metric measures the percentage of existing addresses increasing their ETH balances relative to those reducing or maintaining theirs.
When it climbs, it indicates accumulation behavior — typically seen during bullish phases when confidence in future price growth is high.
On the other hand, a declining ratio, such as the one currently observed, signals weakening conviction and a reluctance to buy the dip. With fewer holders accumulating, ETH lacks the buy-side pressure typically needed to sustain a rebound.
Furthermore, ETH’s Elder-Ray Index has posted red histogram bars over the past three trading sessions, confirming that the bears have sidelined the bulls. As of this writing, it stands at -342.73.
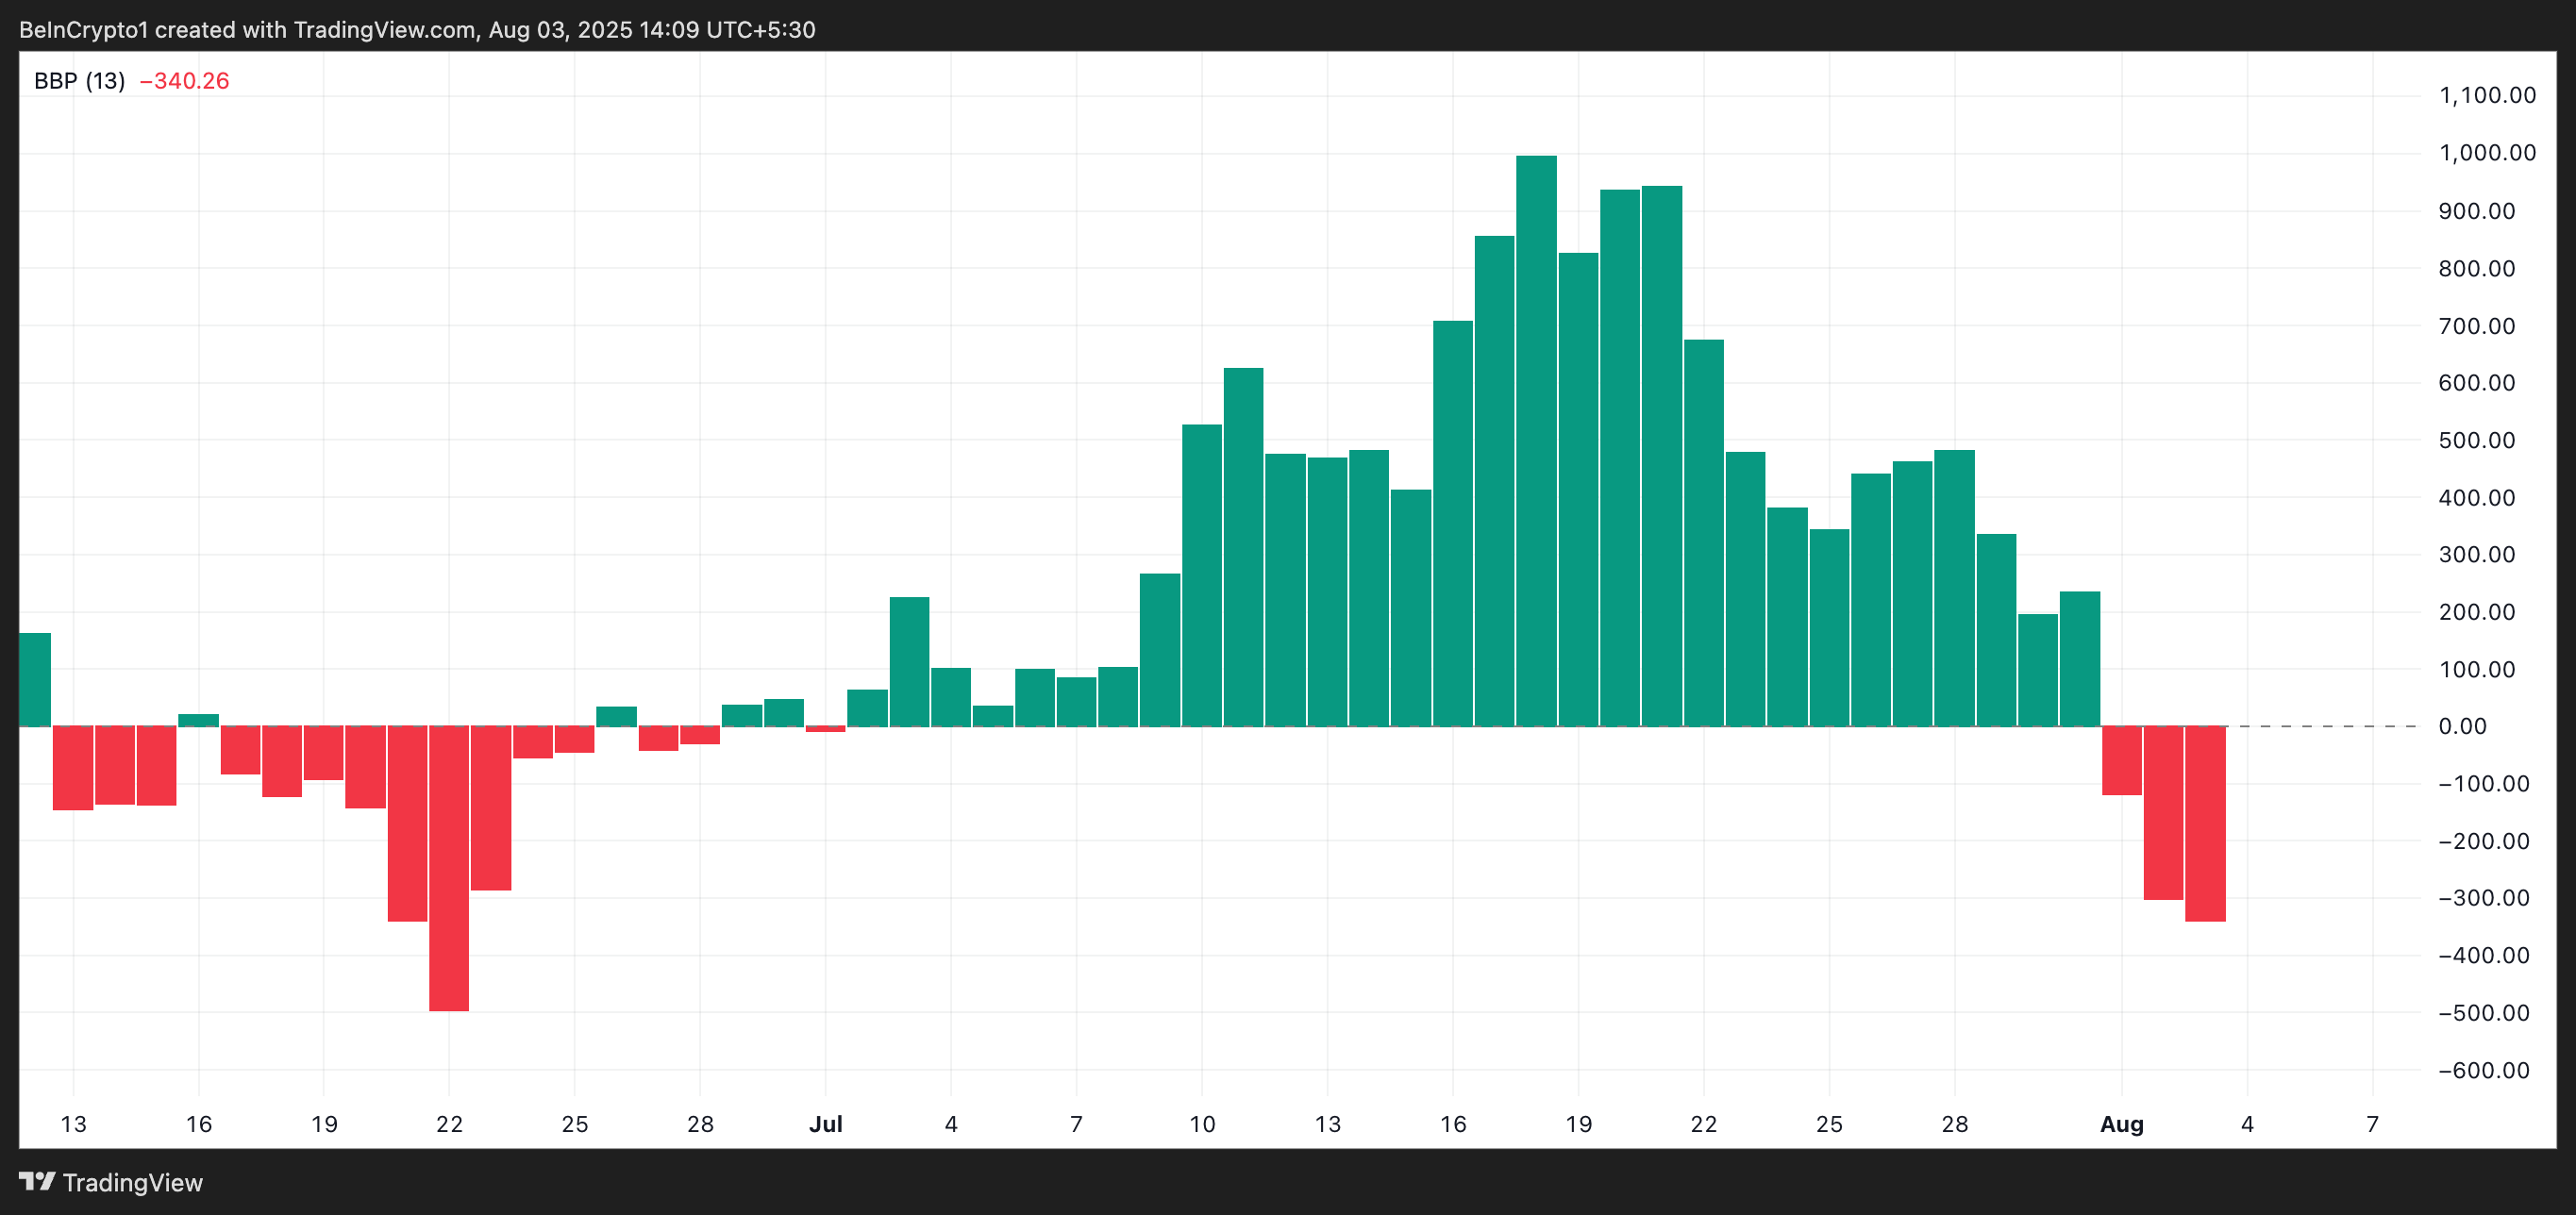
The indicator gauges the strength of bulls and bears in the market. When it prints green histogram bars, it indicates strong buyer dominance and rising upward momentum.
Conversely, as with ETH, bearish momentum grows when it returns red bars whose sizes continue to enlarge. These red bars indicate that selling pressure is not just present but increasing as the day passes.
ETH Eyes $2,745 as Buyers Step Back
ETH currently trades at $3,457, just below a key resistance level formed at $3,524. If accumulation weakens, bearish momentum could drag the price down toward the next major support at $3,067.
Should this support floor give way, ETH may slip further to test the $2,745 zone.
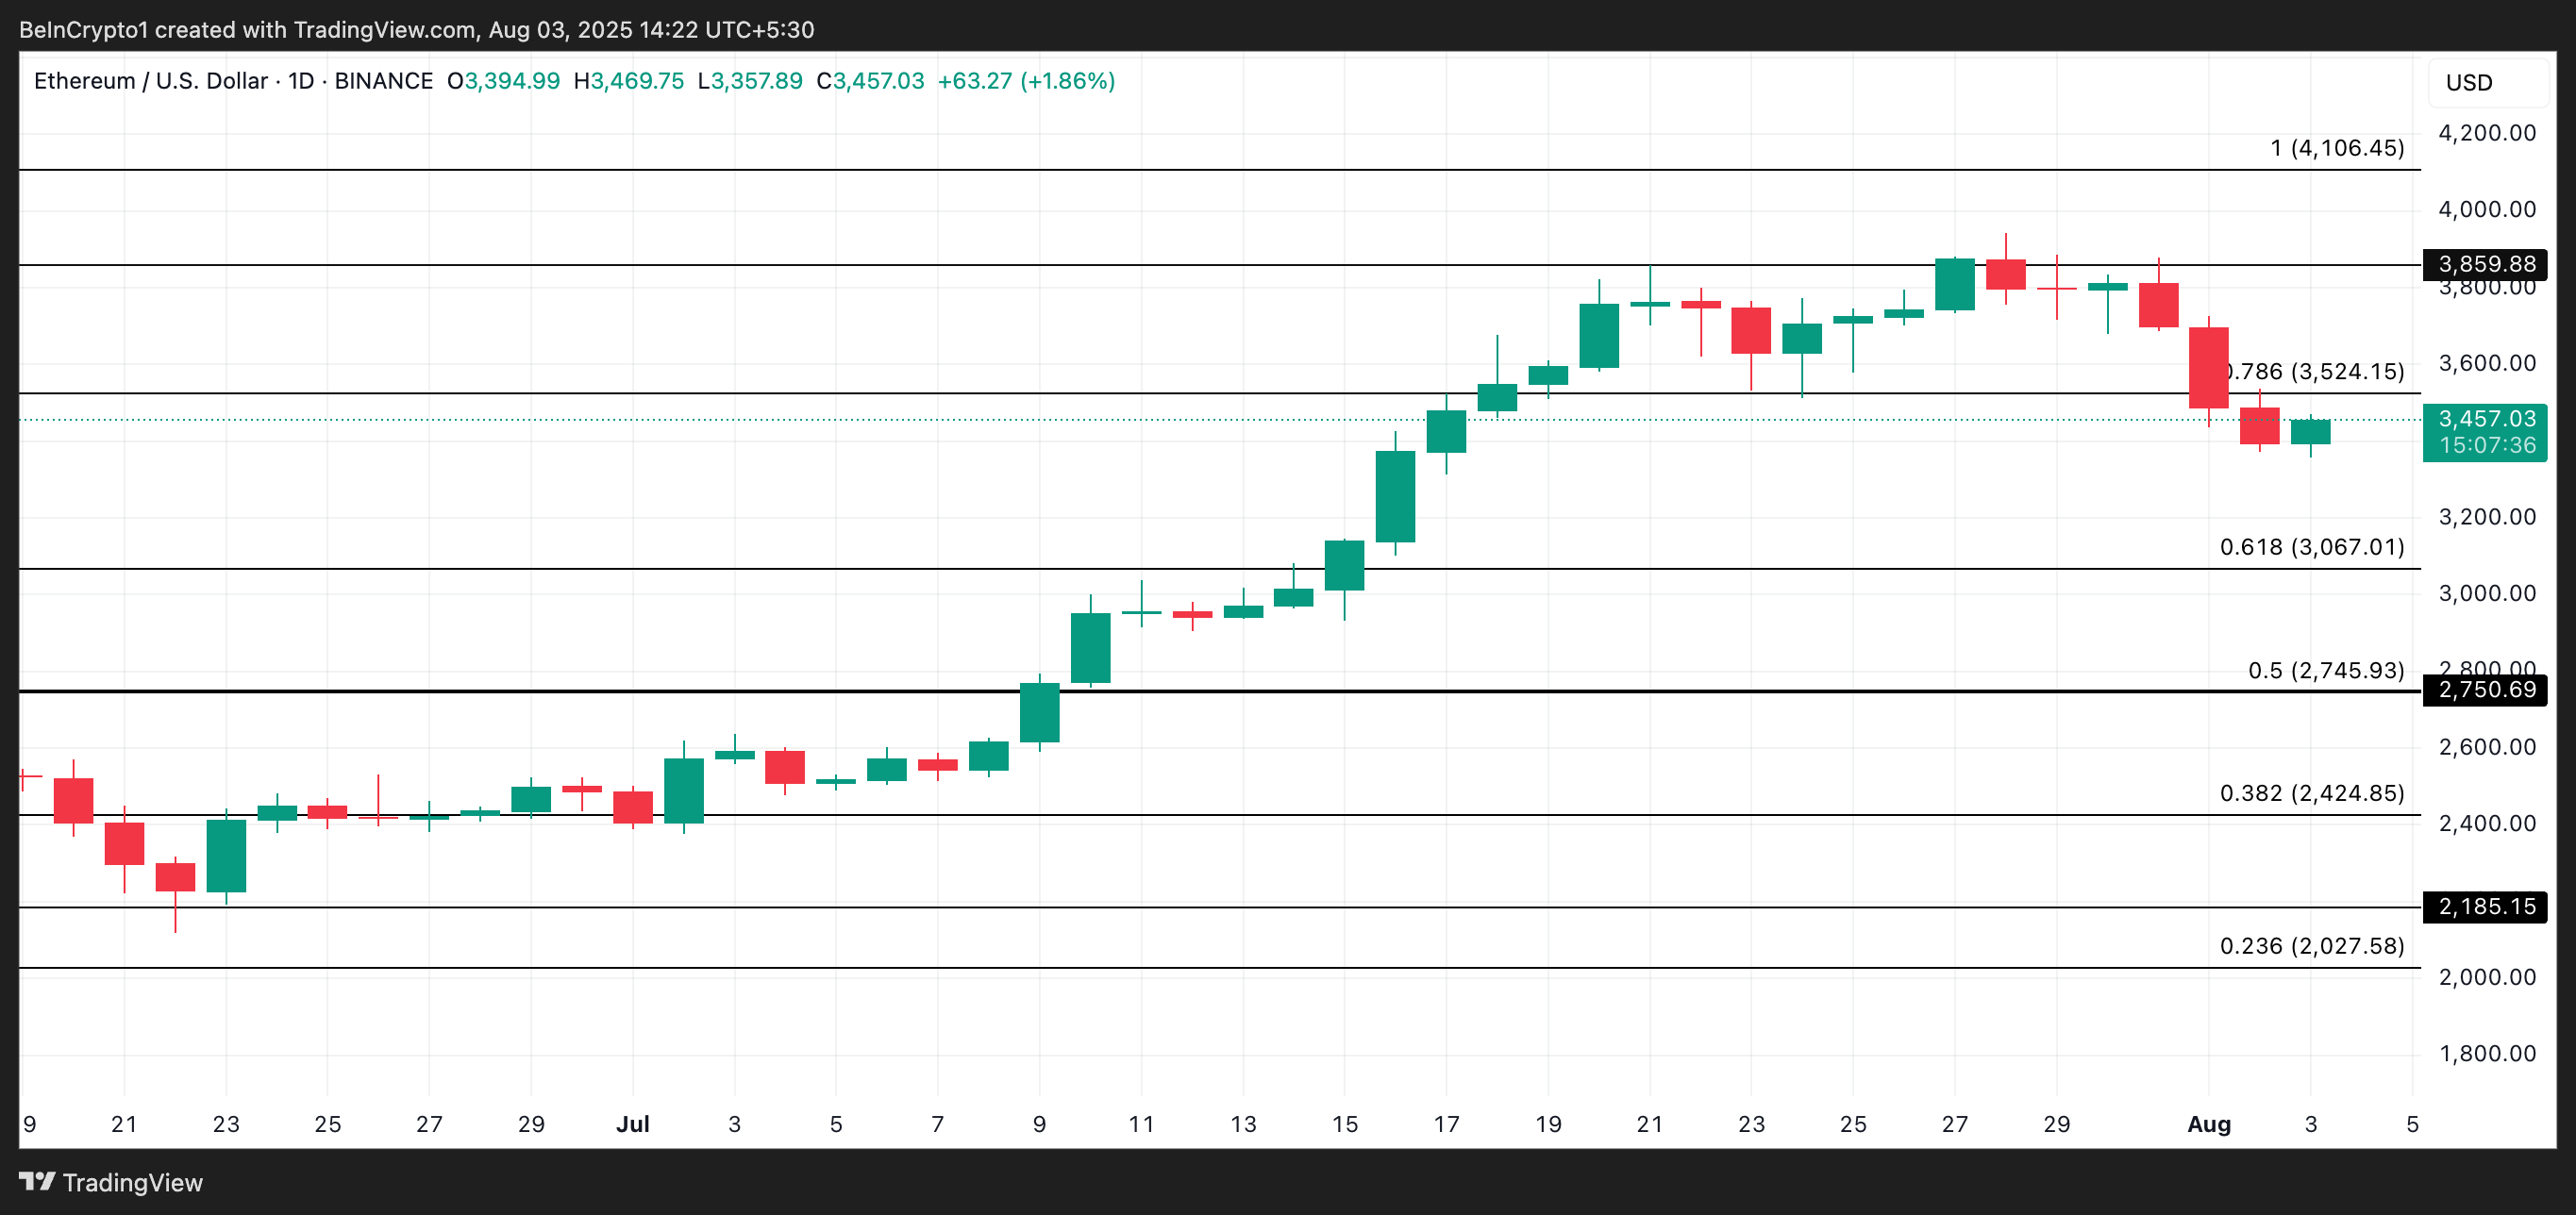
Converesly, a renewed wave of demand could shift sentiment and fuel a recovery. In that case, ETH might make another attempt to break above the $3,524 resistance. A successful breakout could pave the way for an extended rally toward the $3,859 level.
