HBAR’s Bearish Price Pattern Signals More Downside Ahead—Here’s Why Traders Should Prepare

HBAR’s chart is flashing red—and seasoned traders know what comes next.
Brace for impact: The token’s technical setup suggests further downside lurks. A breakdown below key support could trigger cascading liquidations, squeezing overleveraged longs. Meanwhile, the ‘buy the dip’ crowd looks increasingly like bagholders in waiting.
Market psychology 101: When hope fades, pain trades dominate. HBAR’s current trajectory mirrors classic capitulation patterns—just ask anyone who survived the 2022 crypto winter.
Silver lining? Blood in the streets often precedes the best entries. But catching falling knives requires steel nerves and deeper pockets than your average meme coin gambler.
Bonus jab: At least traditional finance has stop-losses that actually work (sometimes).
HBAR Drops Under 20-Day EMA as Bears Take Over
Readings from the one-day chart show that HBAR’s double-digit decline has pushed its price below the 20-day Exponential Moving Average (EMA).
As of this writing, this key moving average forms dynamic resistance above the token’s price at $0.2446. For context, HBAR currently trades at $0.2391.
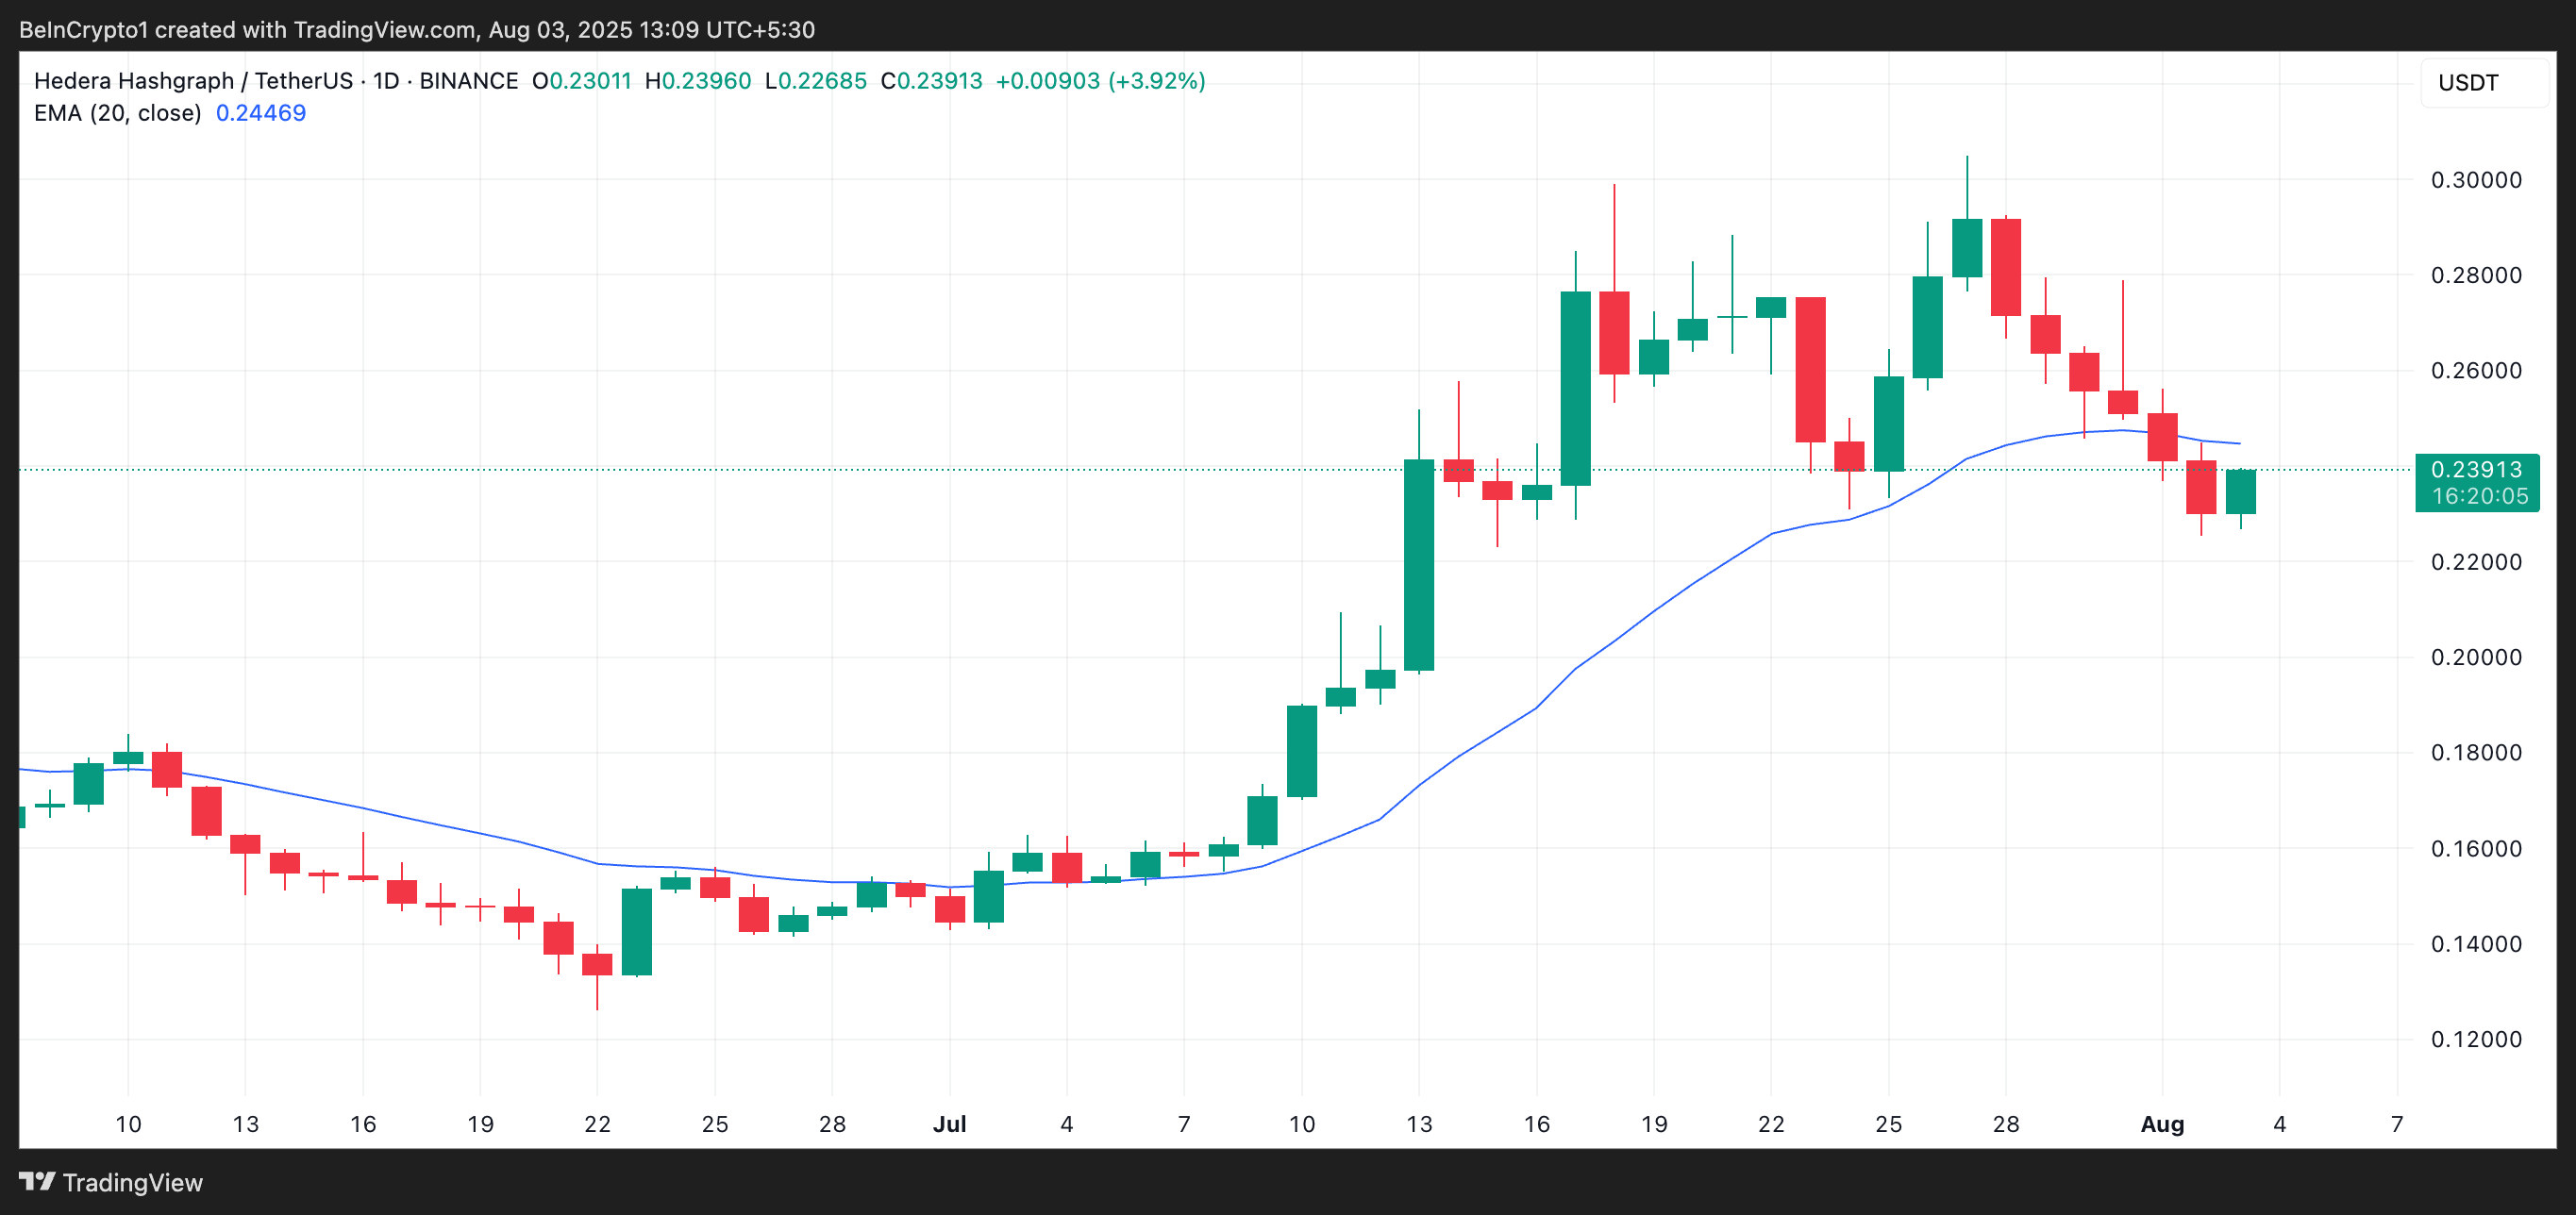
The 20-day EMA measures an asset’s average price over the past 20 trading days, giving weight to recent prices. When price trades above the 20-day EMA, it signals short-term bullish momentum and suggests buyers are in control.
On the other hand, when an asset’s price breaks below this level, it signals increased sell-side pressure and weakening short-term support. This puts HBAR at risk of logging more losses over the next few trading sessions.
Furthermore, the setup of the altcoin’s Moving Average Convergence Divergence (MACD) indicator supports this bearish outlook.
As of this writing, HBAR’s MACD line (blue) rests below the signal line (orange), while the red histogram bars have grown in size — a sign that bearish momentum is accelerating.
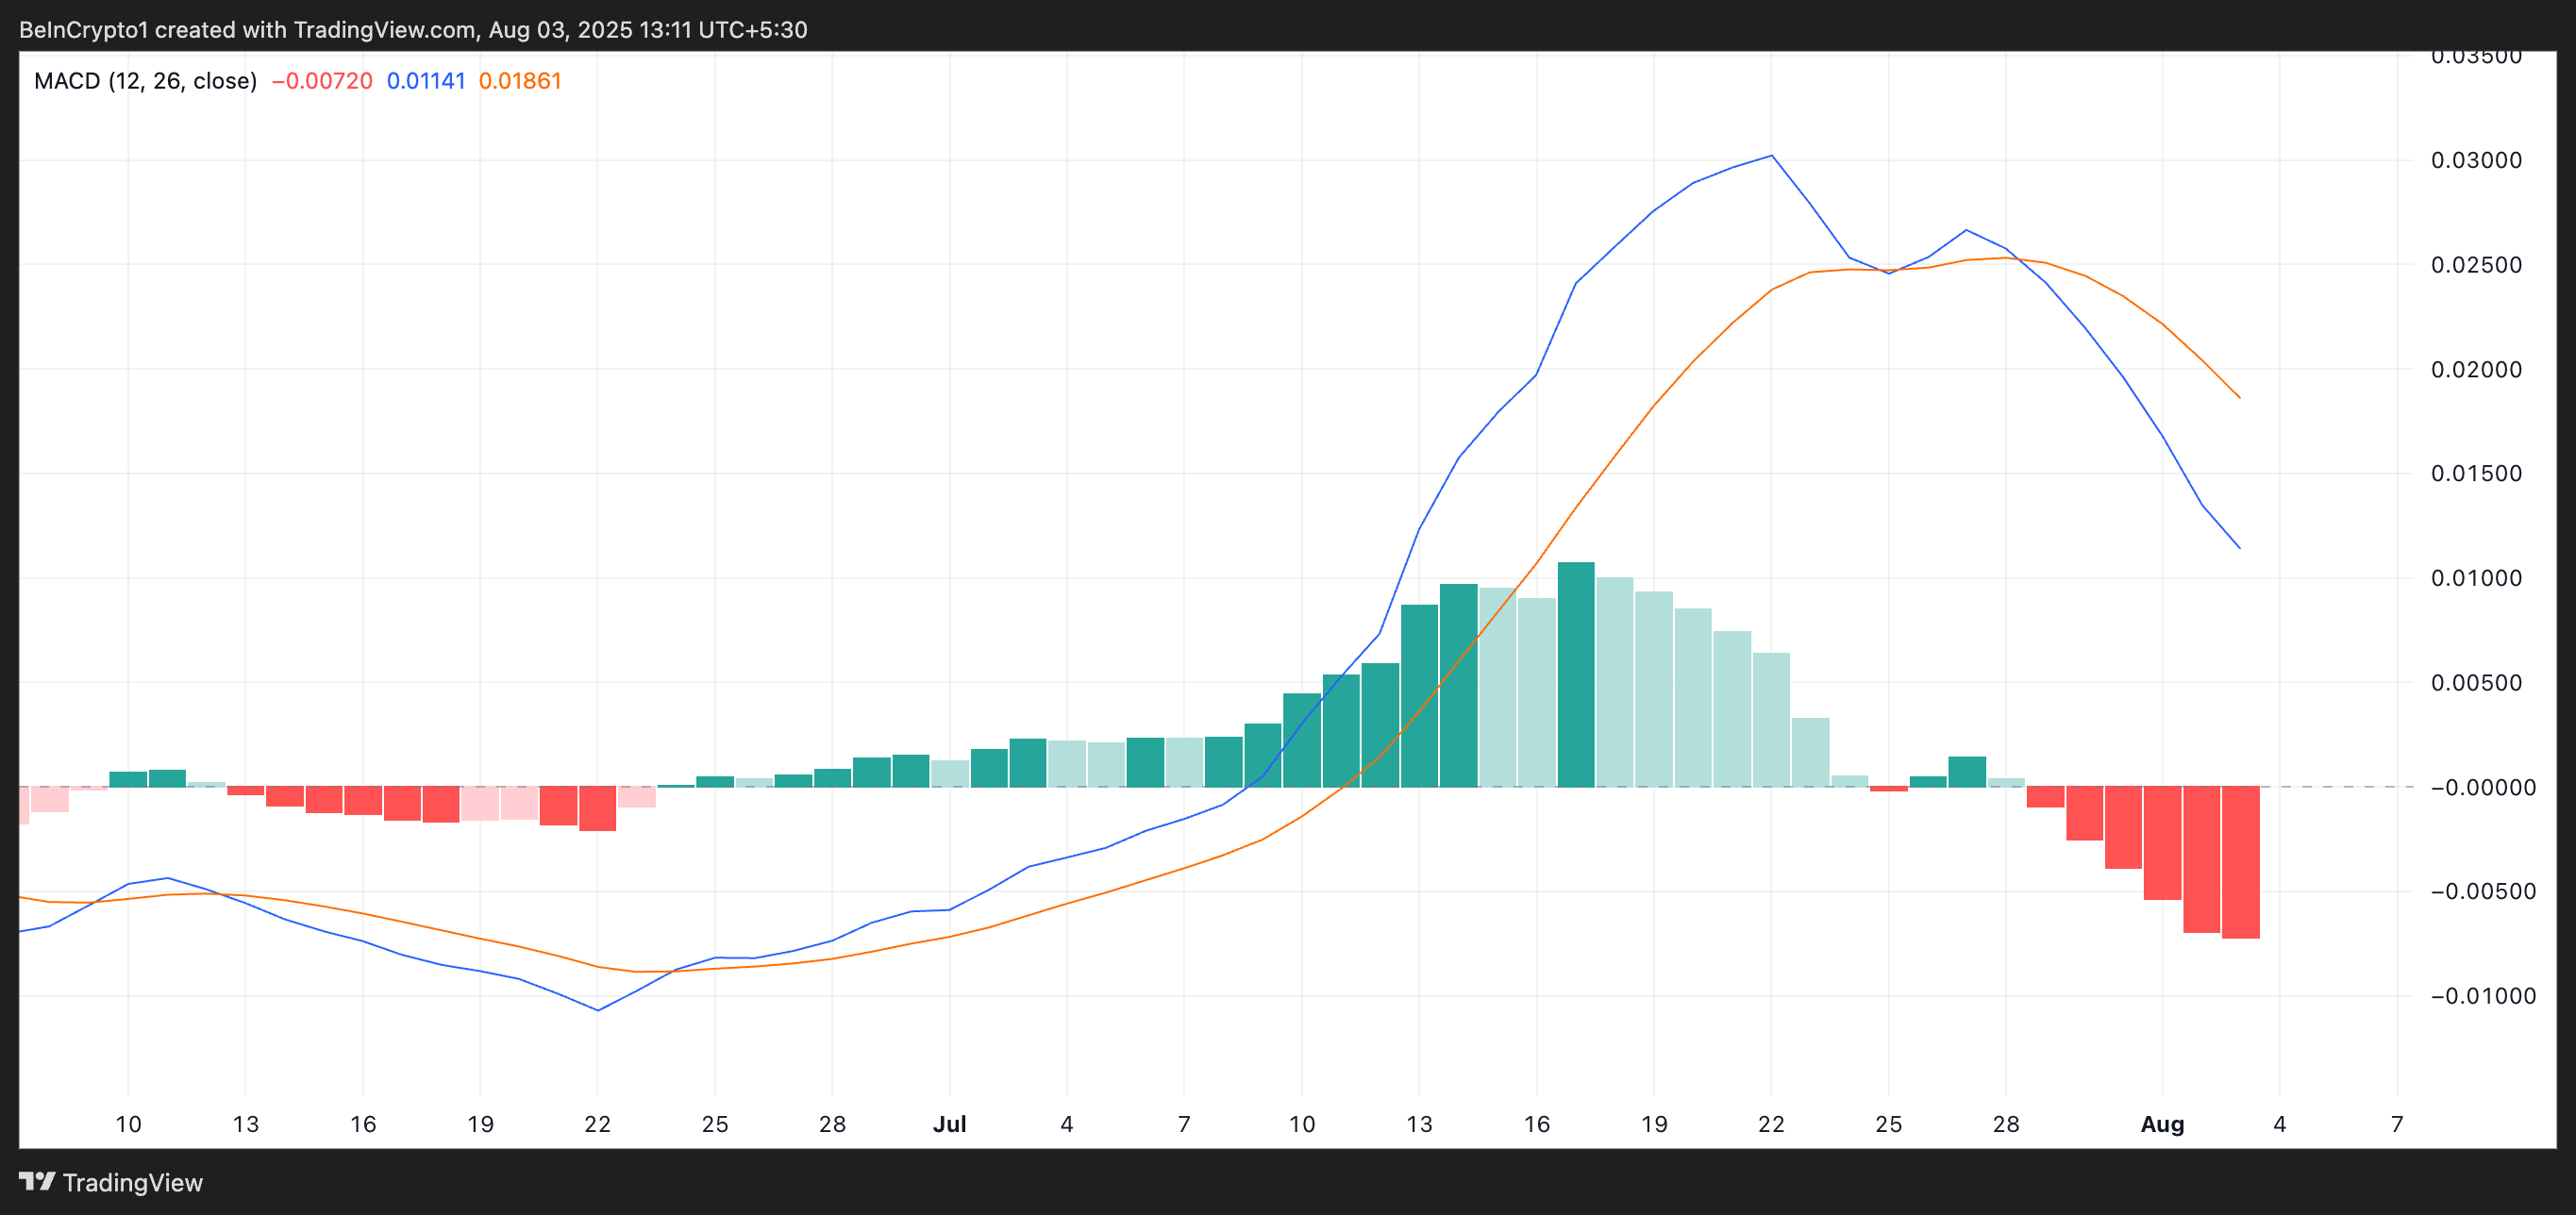
The MACD indicator identifies trends and momentum in its price movement. It helps traders spot potential buy or sell signals through crossovers between the MACD and signal lines.
As with HBAR, when the MACD line rests below the signal line, it signals declining buying pressure and growing sell-side strength. This further supports the case for continued downside in the short term.
Can a Sentiment Shift Save the Token?
HBAR may be on course for deeper losses in the coming days as selloffs strengthen. In this scenario, its price could fall below $0.2283.
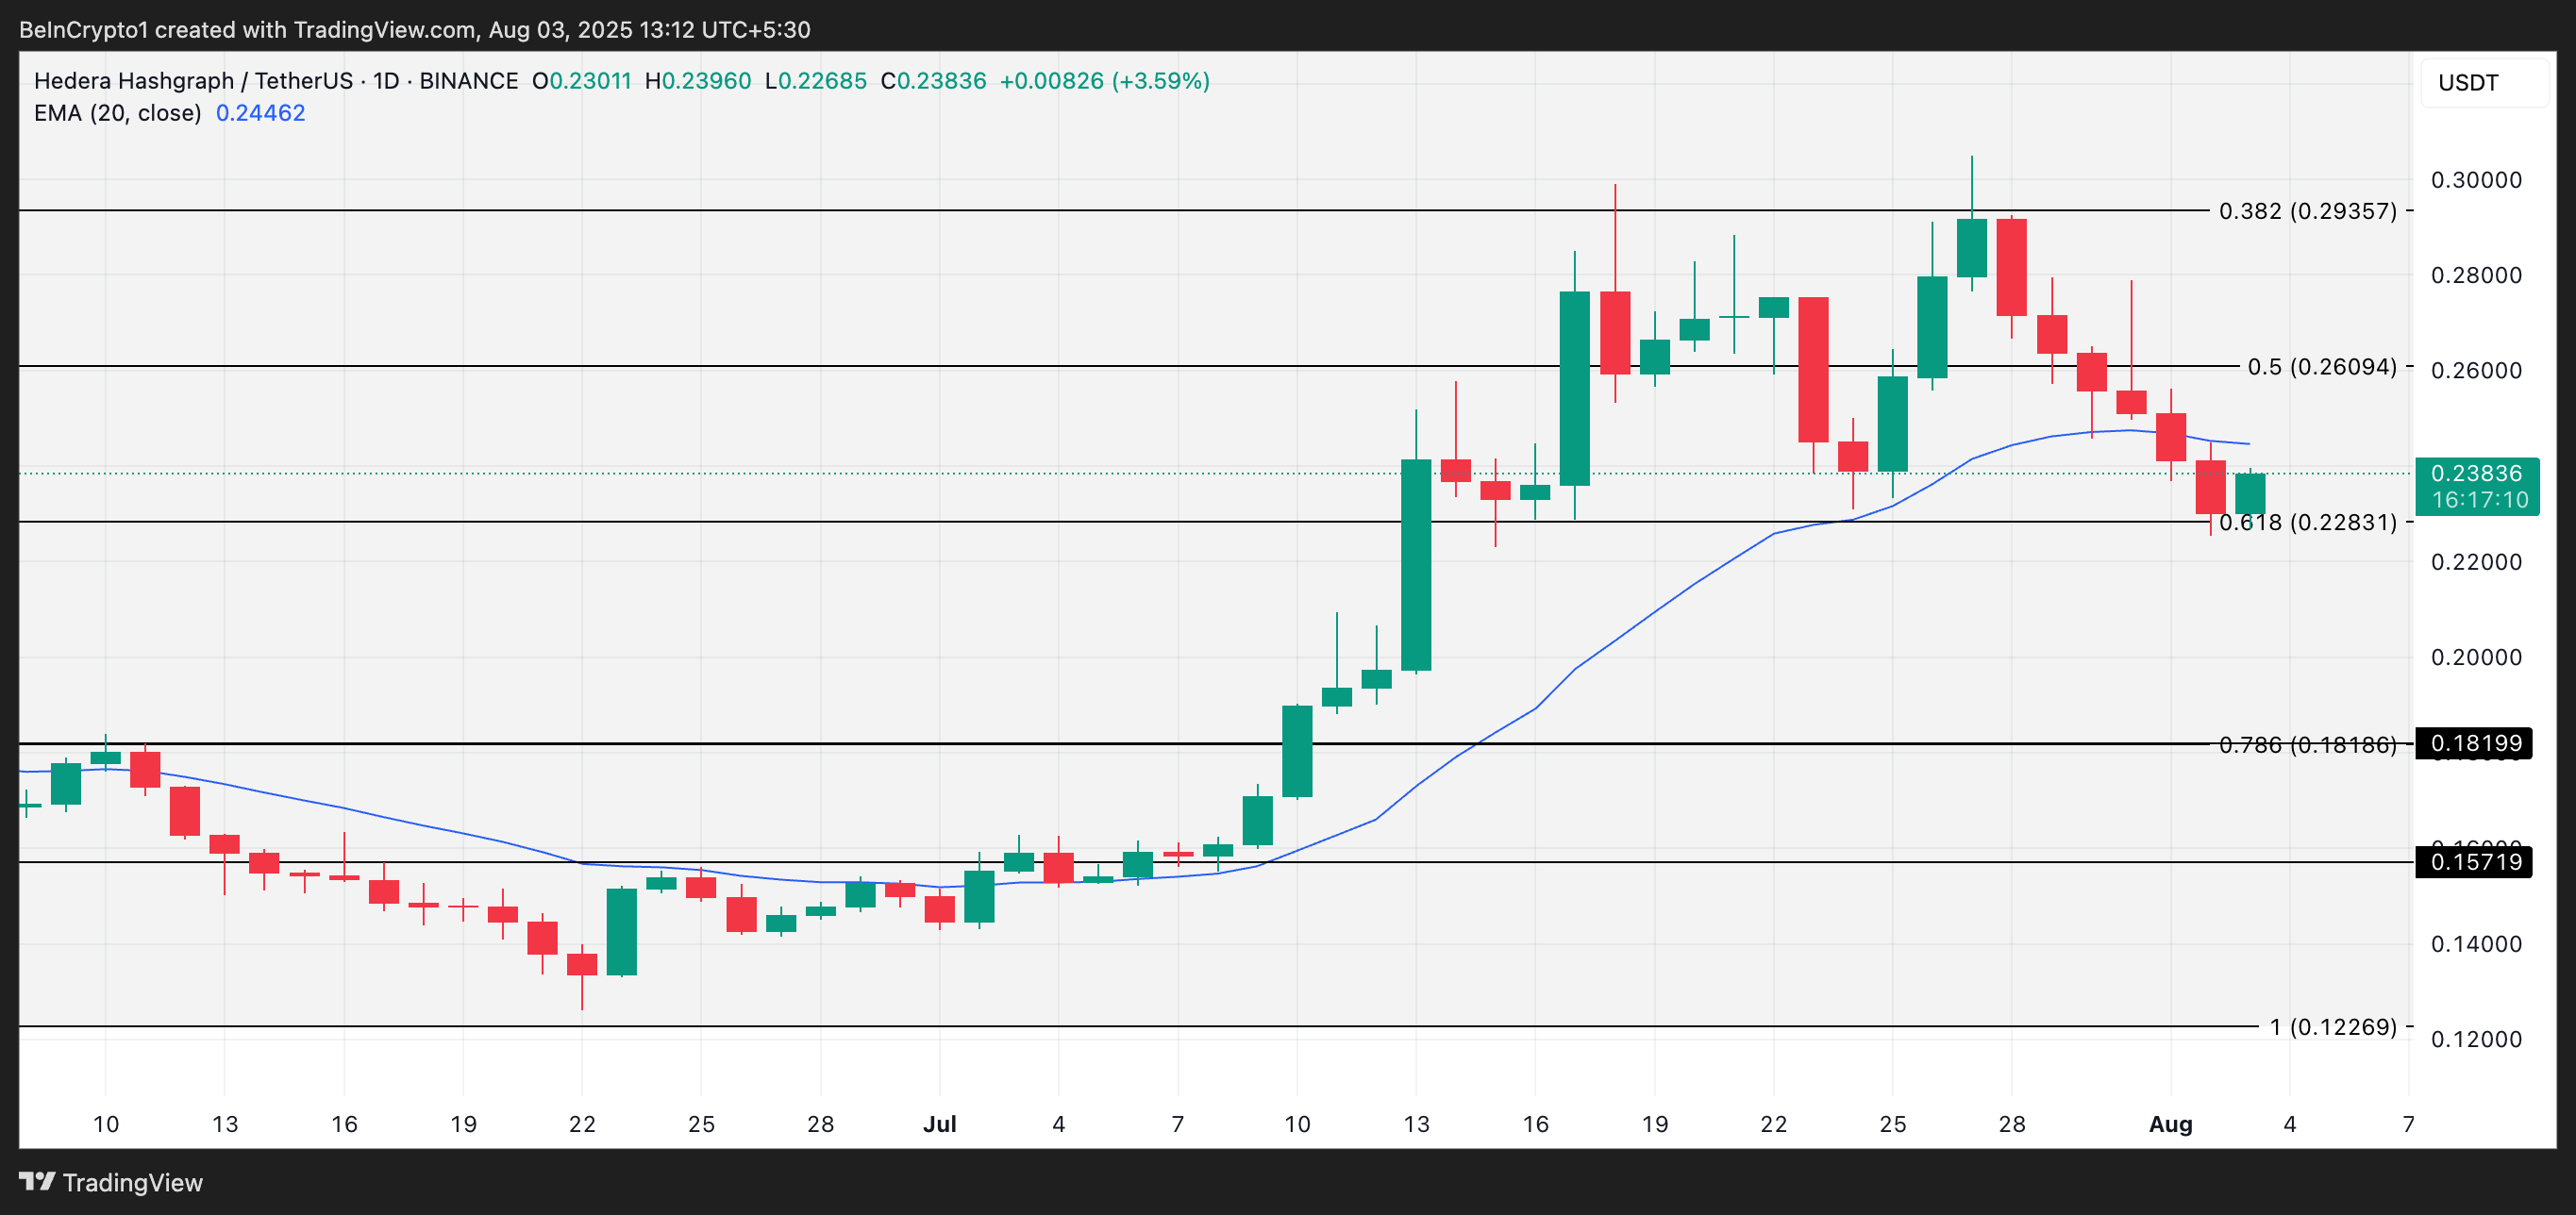
However, if sentiment shifts and a strong support base forms, it could drive the token’s price past the 20-day EMA and toward $0.2609.
