Ethereum (ETH) Exchange Reserves Hit Pre-Rally Levels—Is $4,500 the Next Stop?

Ethereum's exchange reserves just flashed a familiar signal—one that last appeared before its historic bull run. Traders are now eyeing $4,500 as the next logical target.
Exchange reserves drying up? Check. Whale accumulation patterns matching previous cycles? Double-check. The only thing missing is Wall Street 'discovering' crypto again—just in time to FOMO in at the top.
Key drivers: Spot ETF inflows keep stacking, Layer-2 activity soars, and the Merge's deflationary mechanics finally show teeth. Meanwhile, ETH staking yields quietly outperform half the S&P 500.
Risks remain—macro headwinds, regulatory sabre-rattling, and that pesky 20% correction ETH loves to throw before major breakouts. But with network upgrades like Dencun slashing gas fees, retail's return seems inevitable.
One hedge fund manager quipped: 'We'll know we're at the top when Jamie Dimon starts calling Ethereum 'innovative'. Until then? The charts say buy.
Exchange Reserves and Netflows Show Similar Setup to Last Major Rally
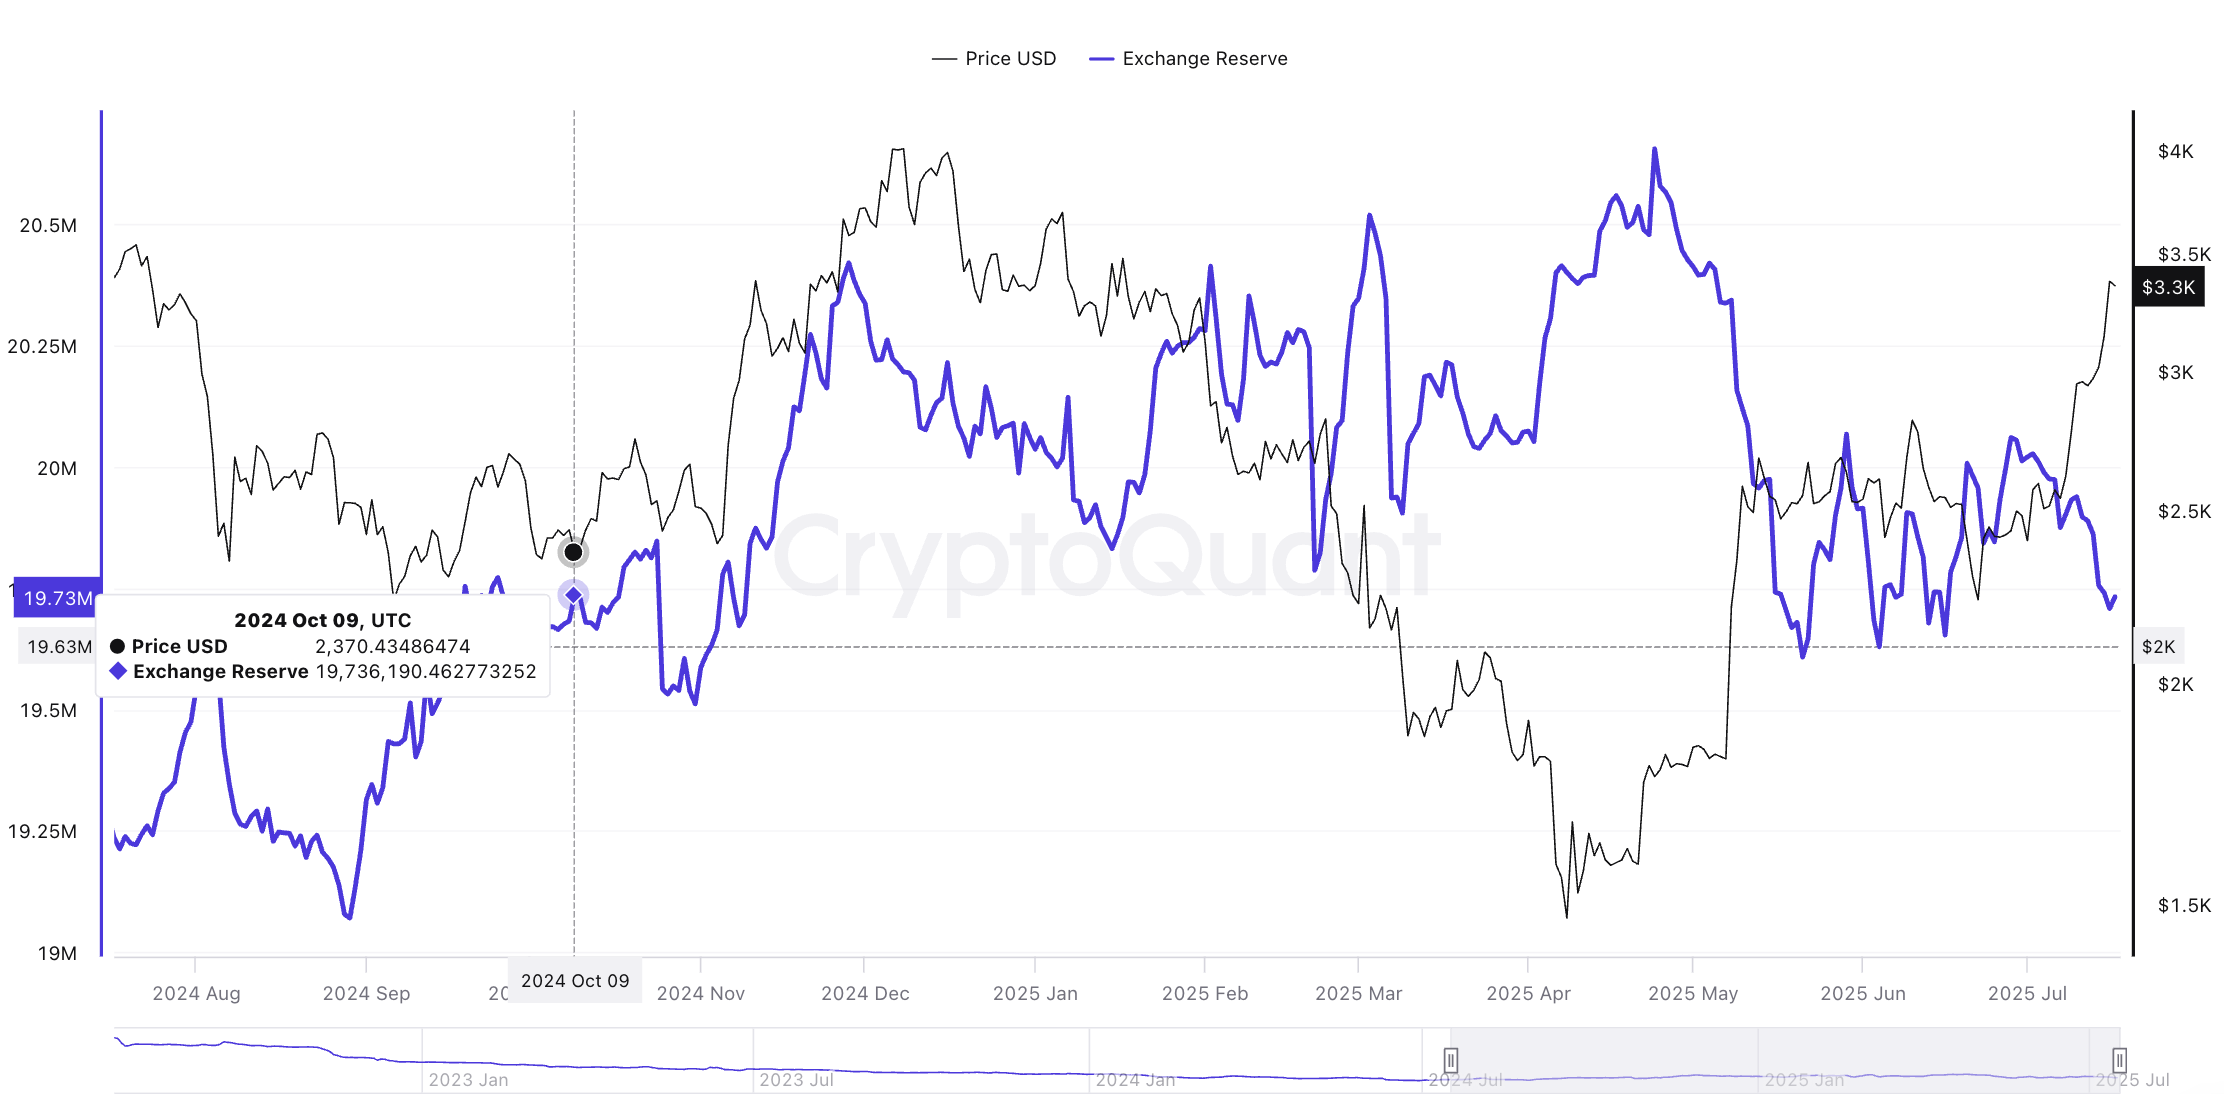
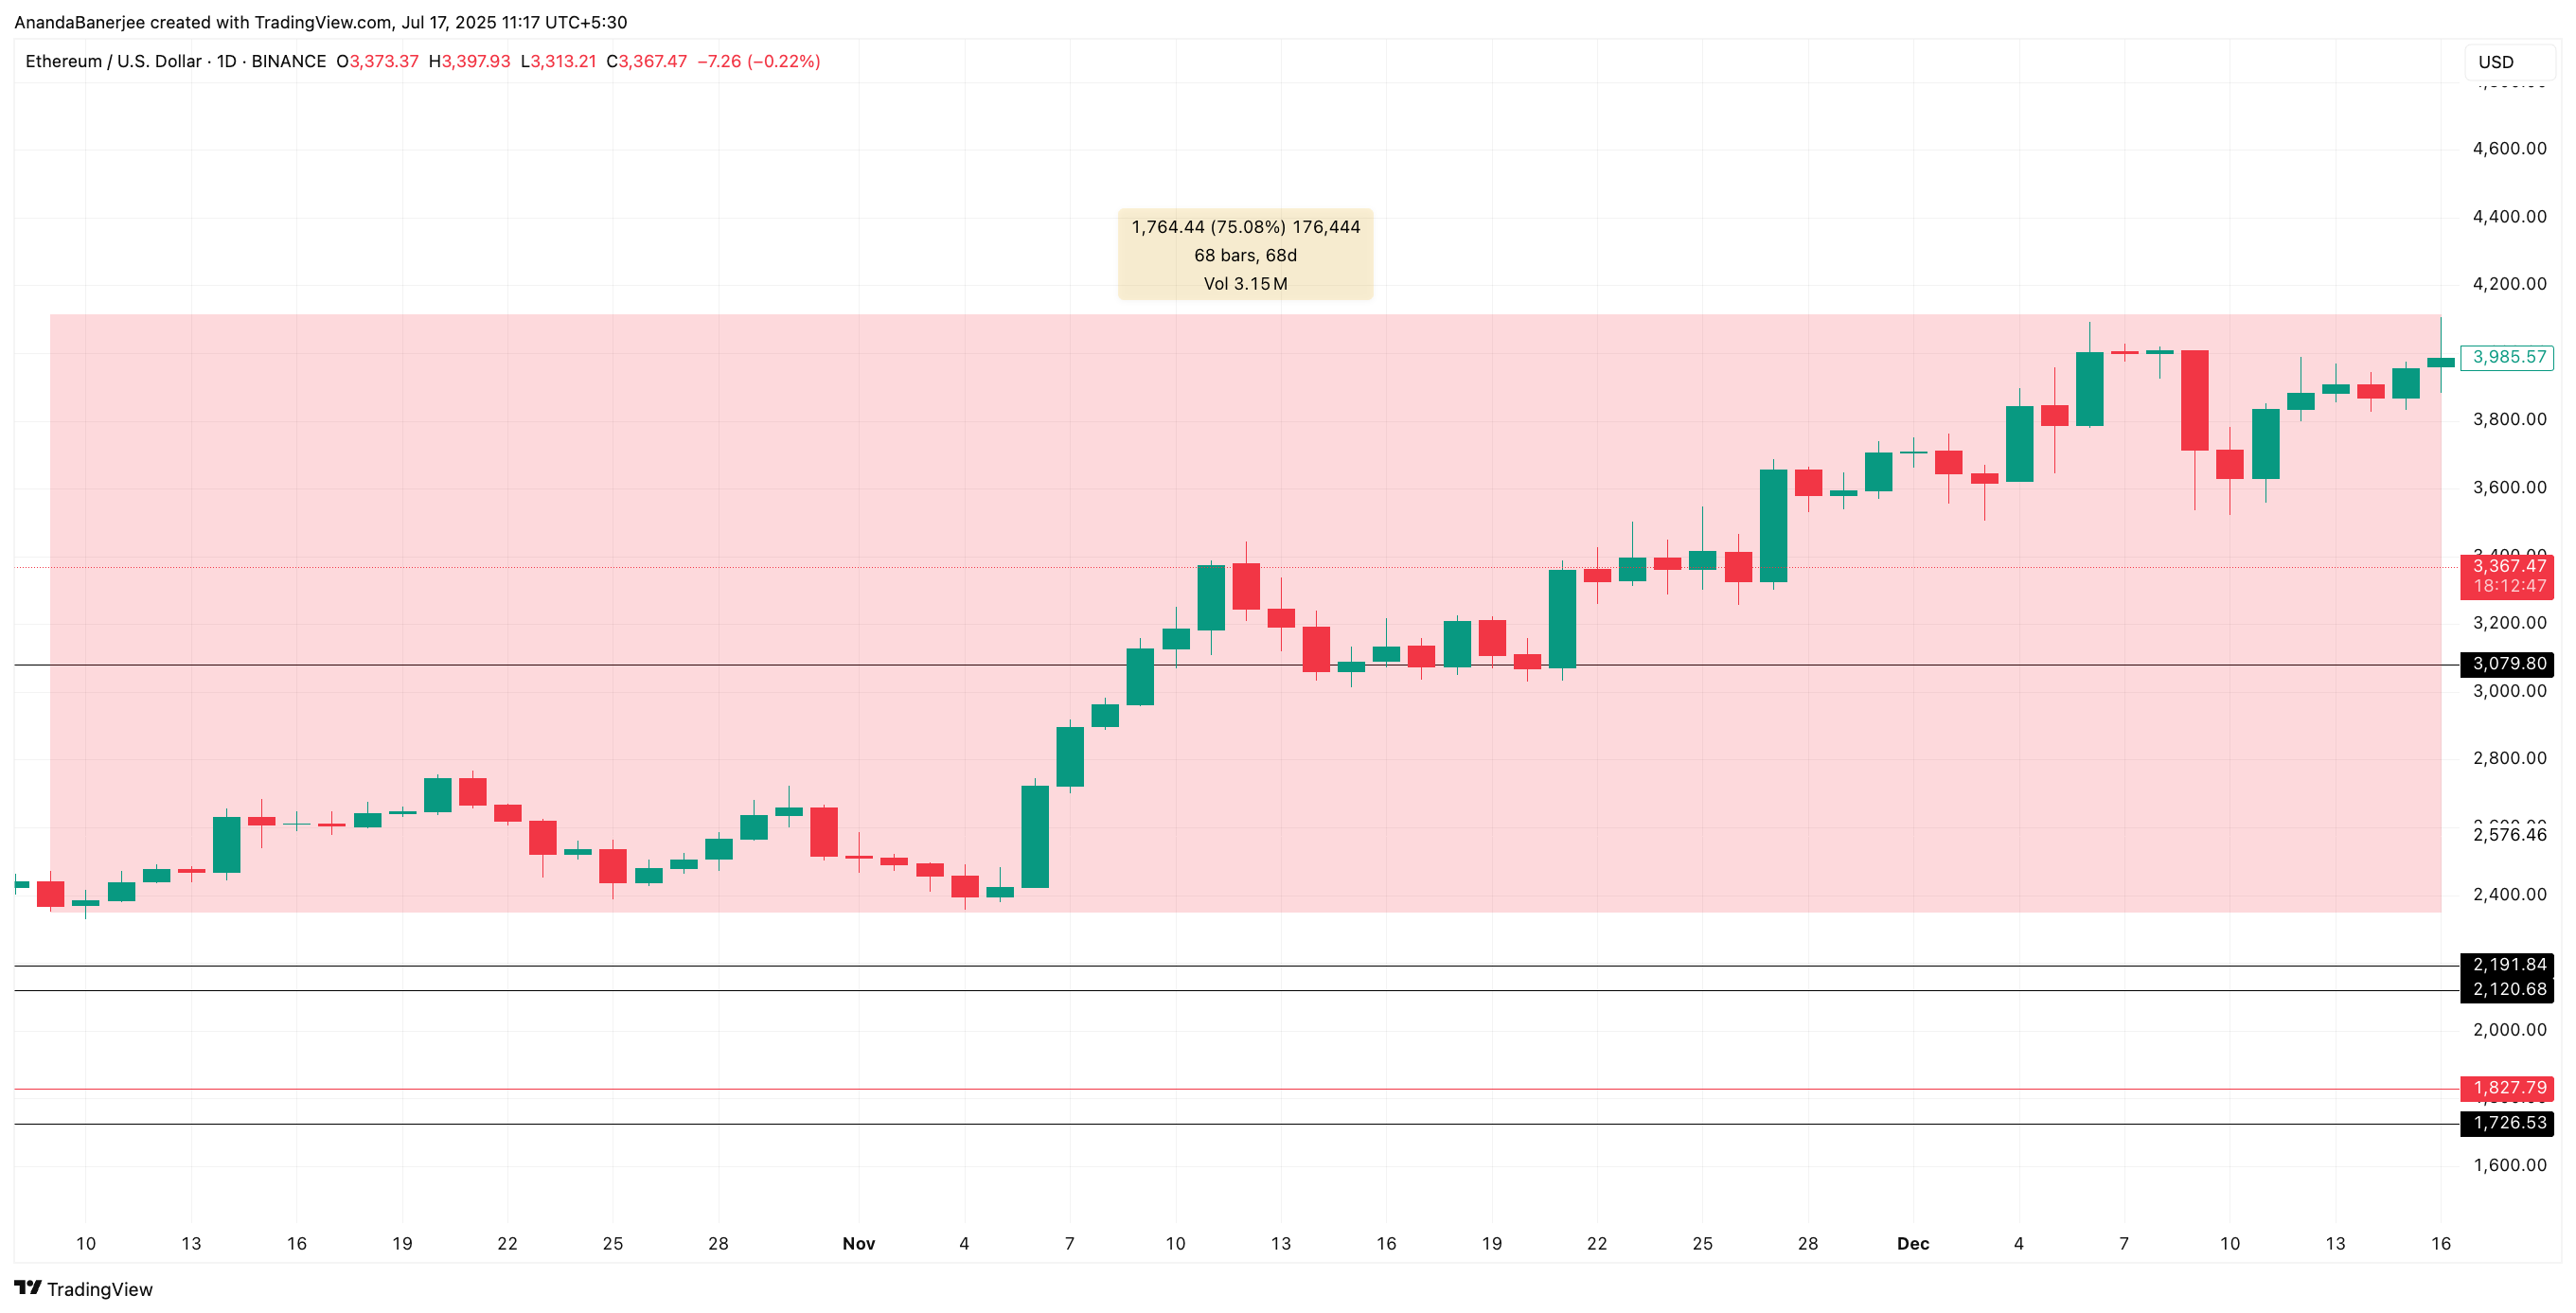
On July 16, Ethereum’s total exchange reserves stood at 19.7 million ETH. This level was almost identical to what was seen on October 9, 2024, right before Ethereum surged 75% over the next two months. That rally began with a similar reserve base and unfolded during a period of consistent outflows.
While similar exchange reserve levels appeared earlier as well, the July-October correlation makes sense, as prices were trending upward during both periods.
: Want more token insights like this? Sign up for Editor Harsh Notariya’s Daily crypto News newsletter here.
Adding to this parallel, aggregated exchange netflows remain negative. On July 16, 147,400 ETH were net withdrawn from exchanges. This signals that more users are moving their Ethereum into self-custody or cold wallets, a behavior often tied to holding rather than selling.
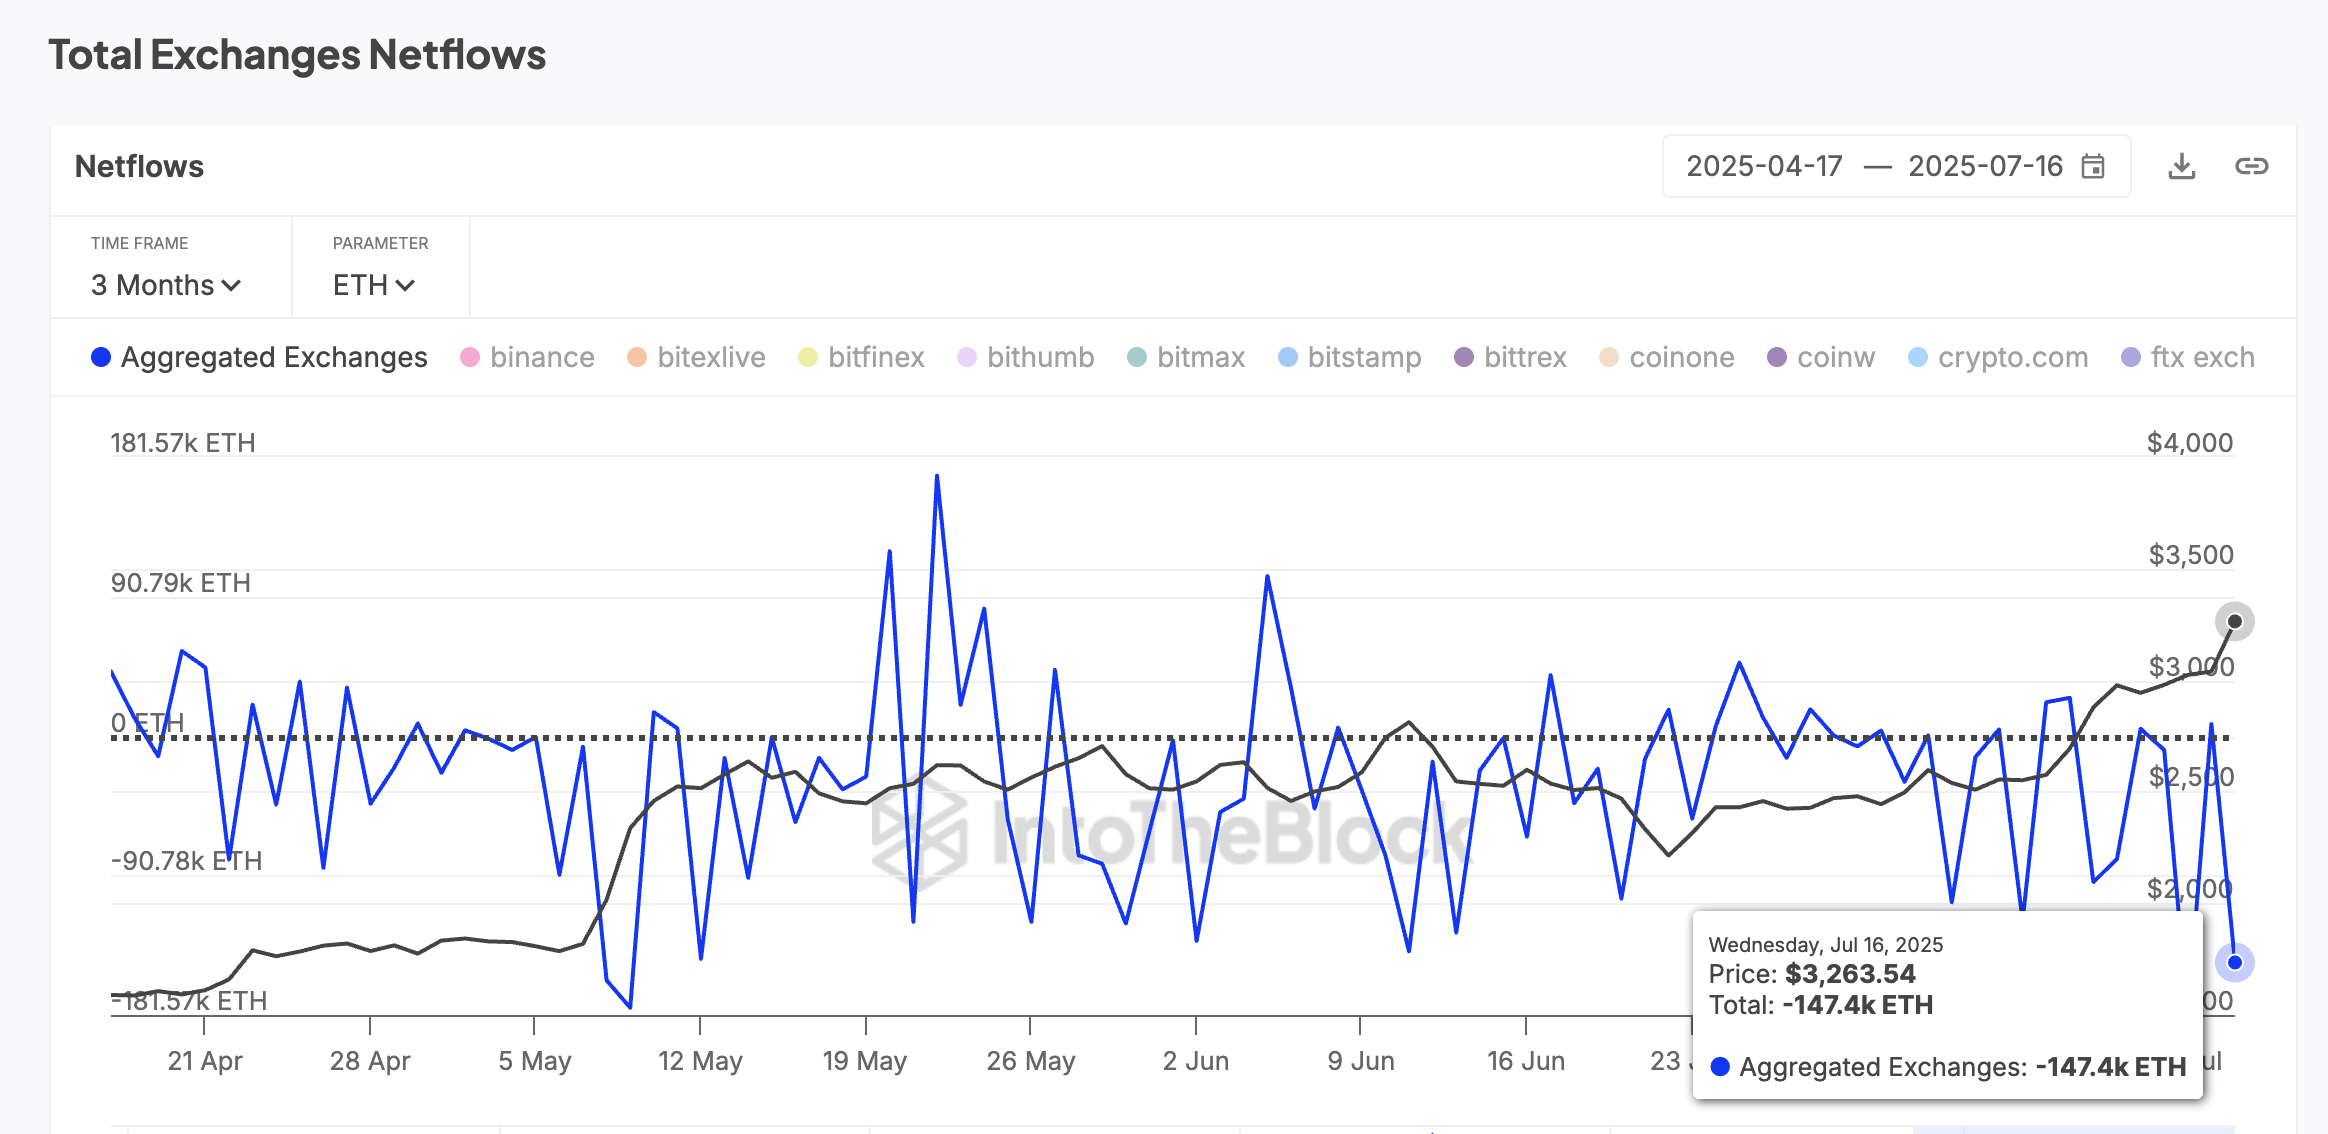
The takeaway? ethereum price is showing signs of absorbing profit-taking while still sustaining demand. Supply on exchanges remains tight, which reduces the immediate sell pressure.
Futures Market Rises, But Sentiment Remains Balanced
While spot markets are showing strength through consistent outflows and tight supply, the derivatives market is quietly echoing that optimism, but without excess. Over the past 24 hours, Ethereum’s futures trading volume surged 27.13%, and open interest climbed 4.18%, signaling new positions are being opened as traders begin to lean into the rally.
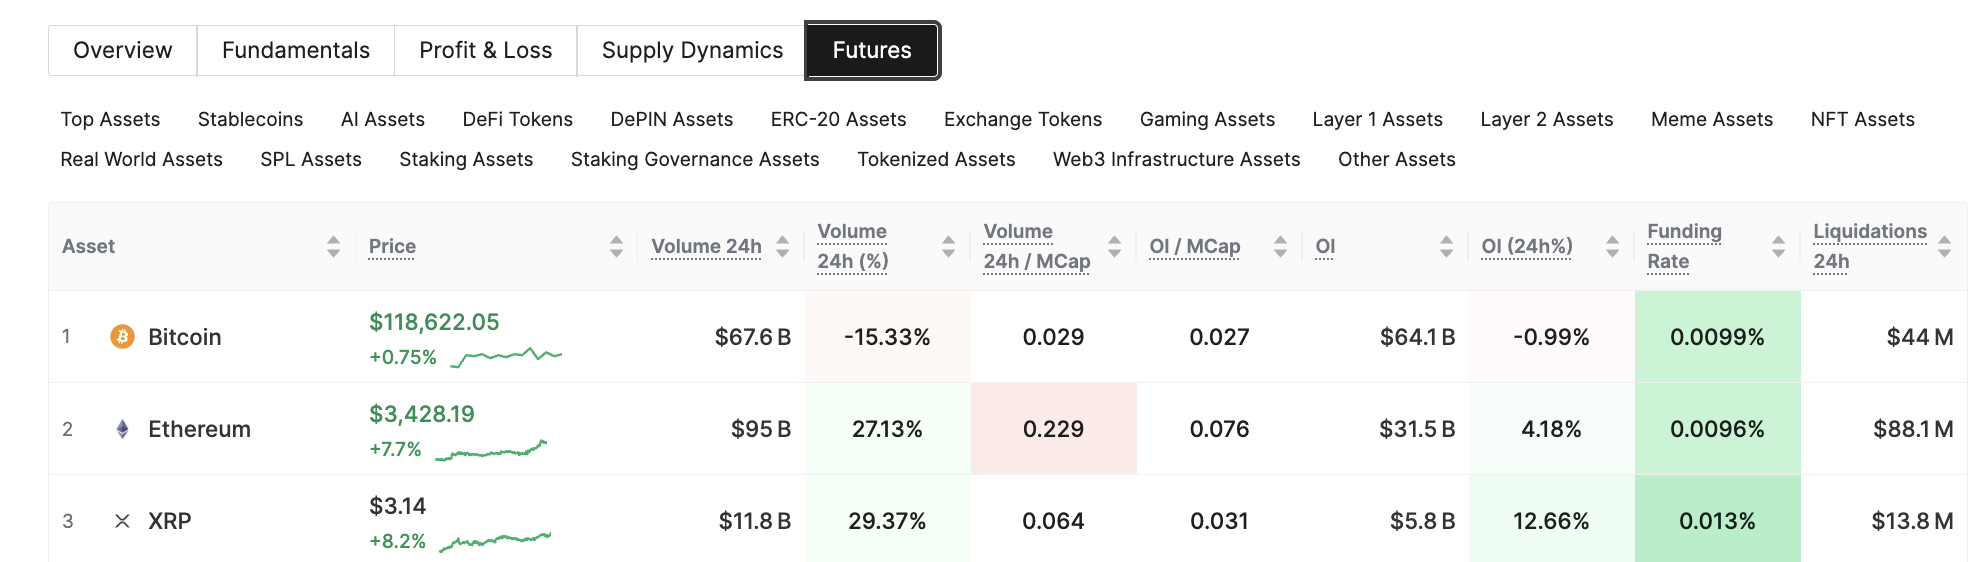
But here’s where it gets interesting; despite the growing exposure, the funding rate remains flat at 0.0096%, suggesting that the market isn’t overly biased toward longs. Funding rate refers to the periodic payments between long and short traders.
When it remains NEAR neutral, it signals that both sides are in check. This pattern makes any rally sustainable without the fear of short or long squeezes.
ETH Price Clears Key Resistance; $4,541 Target in Sight
The drop in exchange reserves, persistent outflows, and neutral funding conditions are starting to reflect directly on Ethereum’s price. ETH has broken above the $3,298 resistance, which aligns closely with the 0.786 Fibonacci extension level. This breach suggests strength in the spot market and confirms alignment between on-chain activity and price momentum.
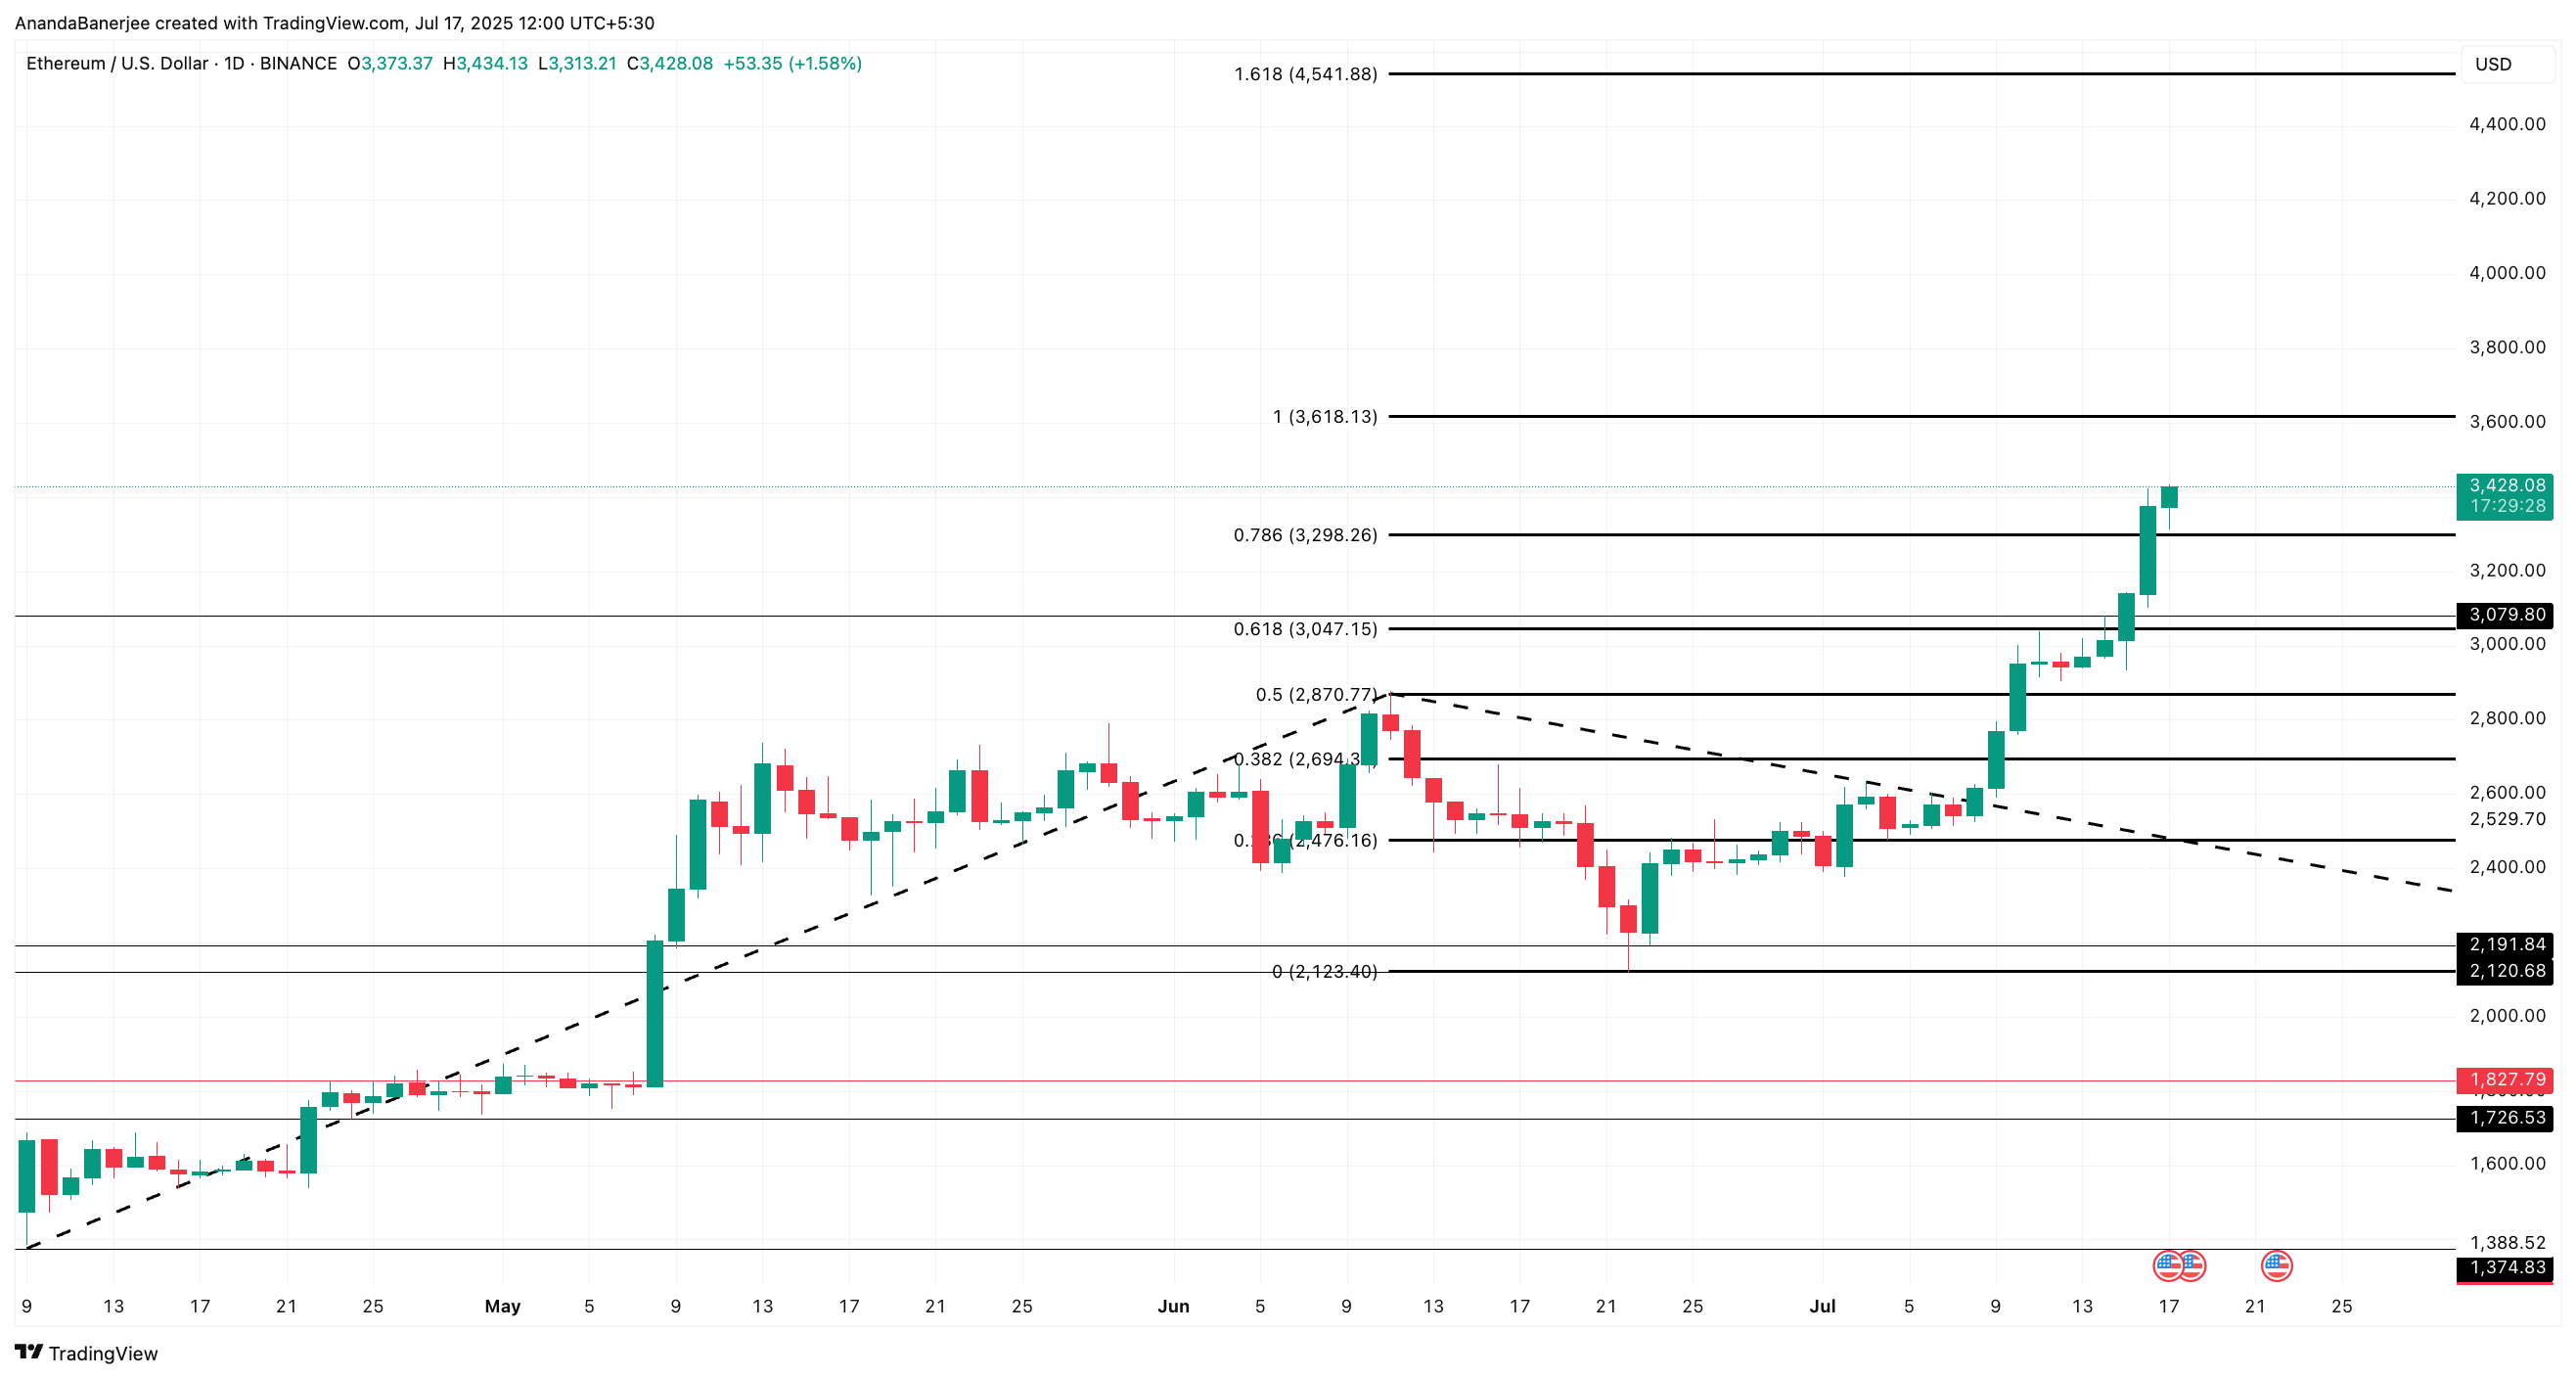
This current Trend-based Fibonacci setup starts approximately at $1,388 levels (low made in early April) and moves to the previous swing high of almost $2,870 and gets retraced to the next swing low of almost $2,130. This bullish projection-specific setup charts the next possible lead for the ETH price.
The current rally mirrors the conditions seen in October 2024, when ETH also traded at similar reserve levels and went on to rally more than 75%. If history rhymes, Ethereum’s next target sits at $4,541.88, marked by the 1.618 Fib level; a potential 32% upside from current levels. Once that happens, even a march towards the 75% level and a new all-time high could be possible.
But the bullish thesis holds only if the ETH price sustains above $3,047. This level has served as a strong support over the past week.
A breakdown below $2,870; the 0.5 Fibonacci level WOULD invalidate the bullish setup. More so if that dip coincides with rising inflows or a reversal in exchange reserve trends. All that would signal renewed sell pressure and potentially cap upside momentum.
