Shiba Inu (SHIB) Primed for 38% Surge as Bullish Crossover Signals Explosive Move

Shiba Inu’s price action just flashed a bullish signal that could send the meme coin soaring—if traders can stomach the volatility.
Technical Breakthrough
A golden crossover on SHIB’s chart hints at momentum shifting in favor of the bulls. The last time this pattern appeared, retail FOMO pumped the asset double-digits within days.
Market Psychology at Play
With Bitcoin dominance wavering, altcoins like SHIB are catching bids from speculators chasing the next parabolic move. Never mind that most lack utility beyond Twitter hype cycles.
38% or Bust
The measured move target aligns with a key resistance zone—where bagholders from the 2021 mania are still waiting to break even. Will history repeat, or is this just another dead cat bounce? Only the charts know for sure.
Shiba Inu Exchange Reserves Hit 12-Month Low
Shiba Inu’s on-chain exchange reserves have fallen to 83,803,217,156,857 tokens; their lowest point in over a year, according to CryptoQuant. Based on the current SHIB price of $0.00001358, the total value of SHIB tokens currently held on exchanges (83.8 trillion tokens) is approximately $1.14 billion.
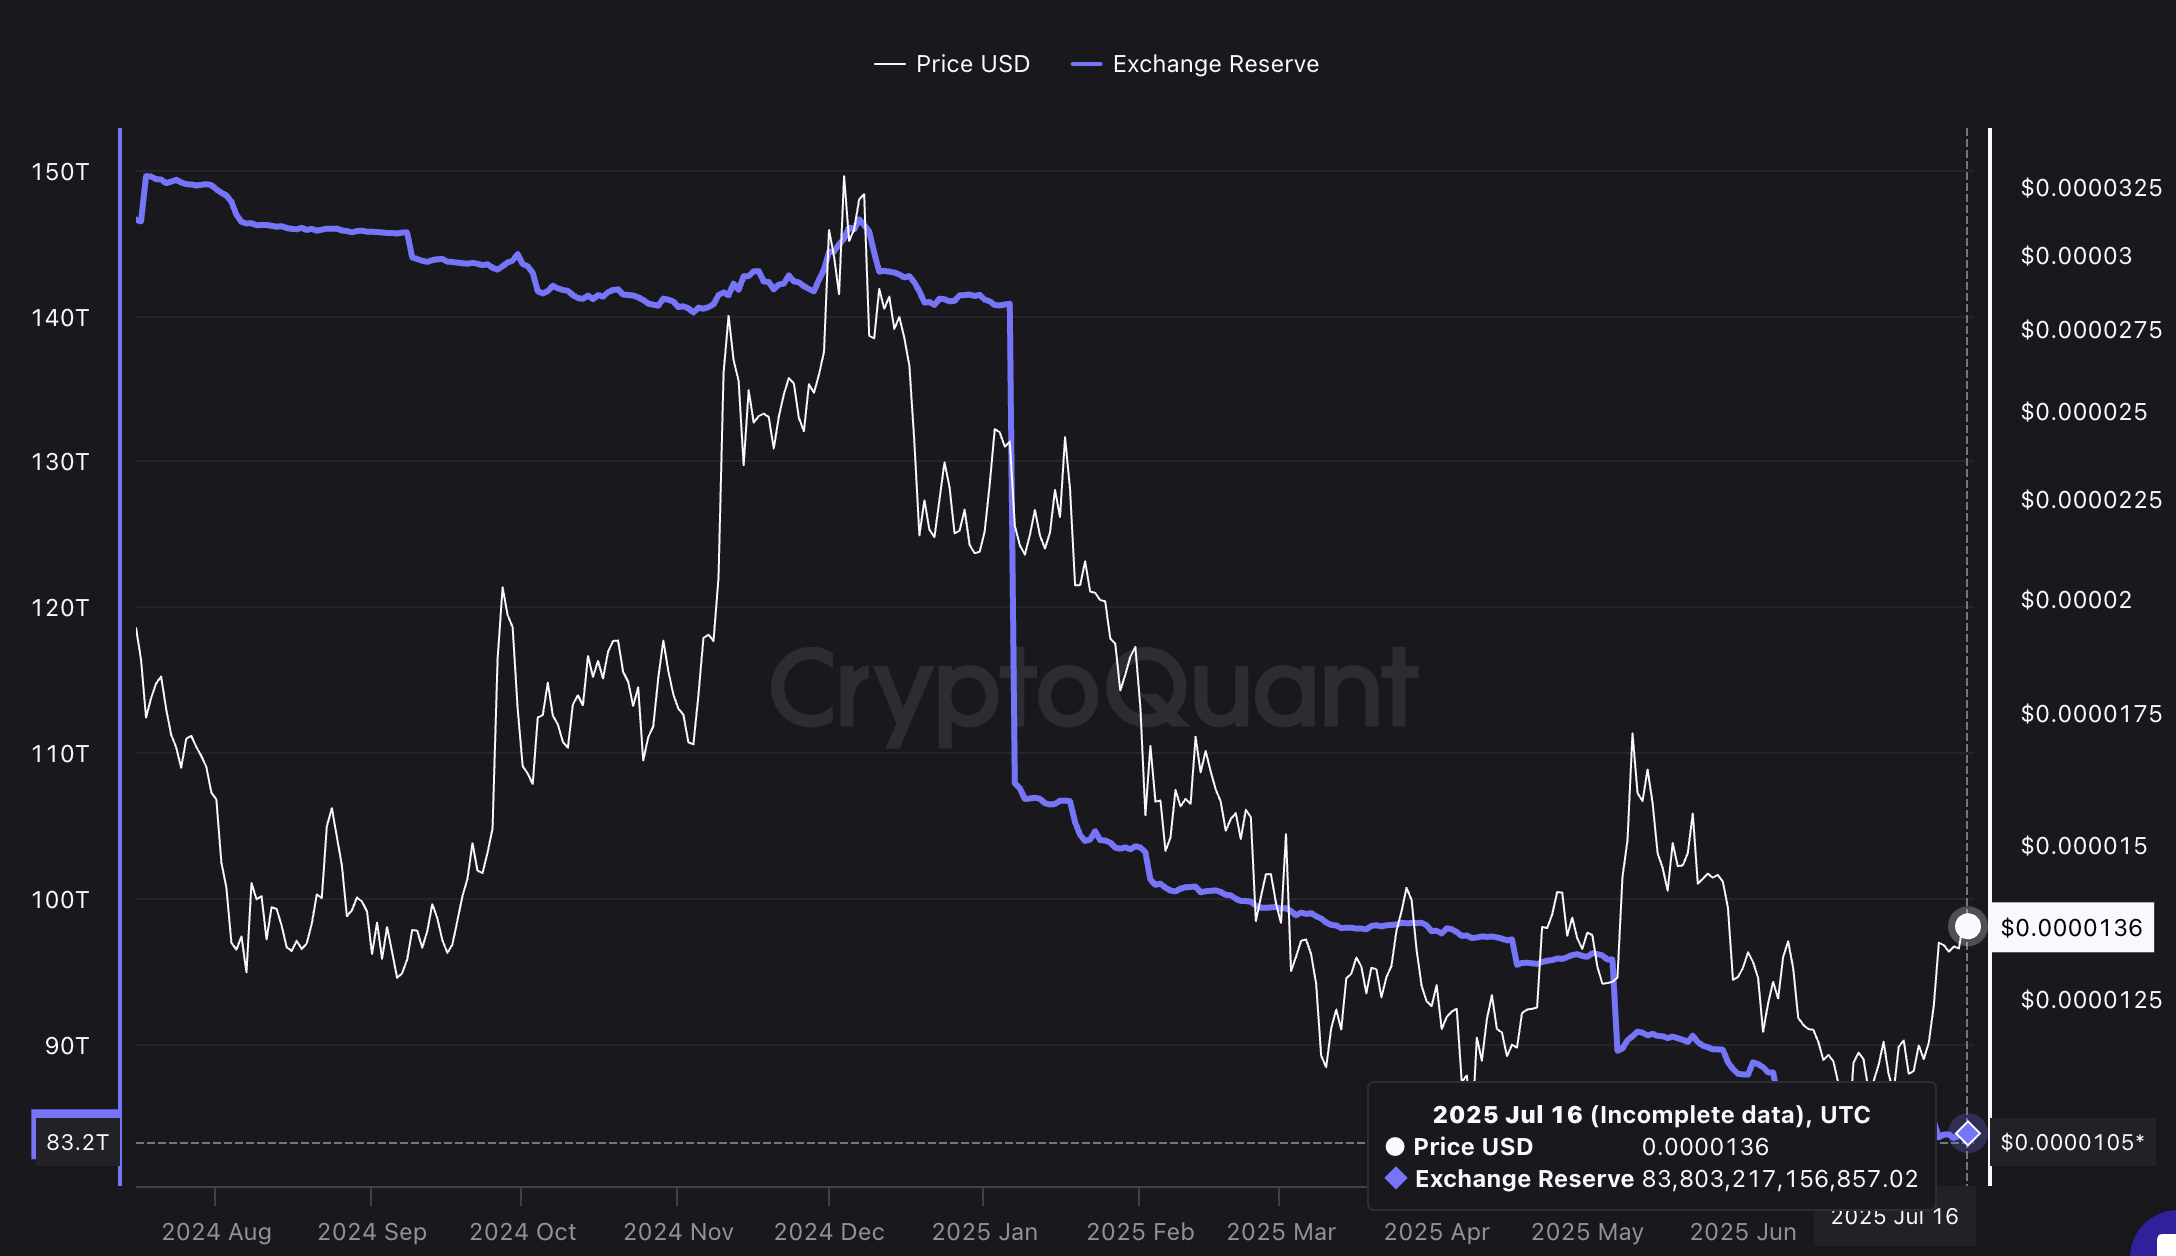
This marks a significant decline from the 150 trillion-plus held on exchanges in 2024, suggesting that selling pressure has dried up.
Less supply on exchanges means tighter liquidity and higher potential for price expansion, particularly relevant as SHIB currently trades at $0.00001358.
Golden Crossover Flashes “Again”
A fresh bullish crossover has just occurred on the shiba inu chart. The 20-day EMA (exponential moving average) has crossed above the 50-day EMA; a signal known as the “golden crossover.”
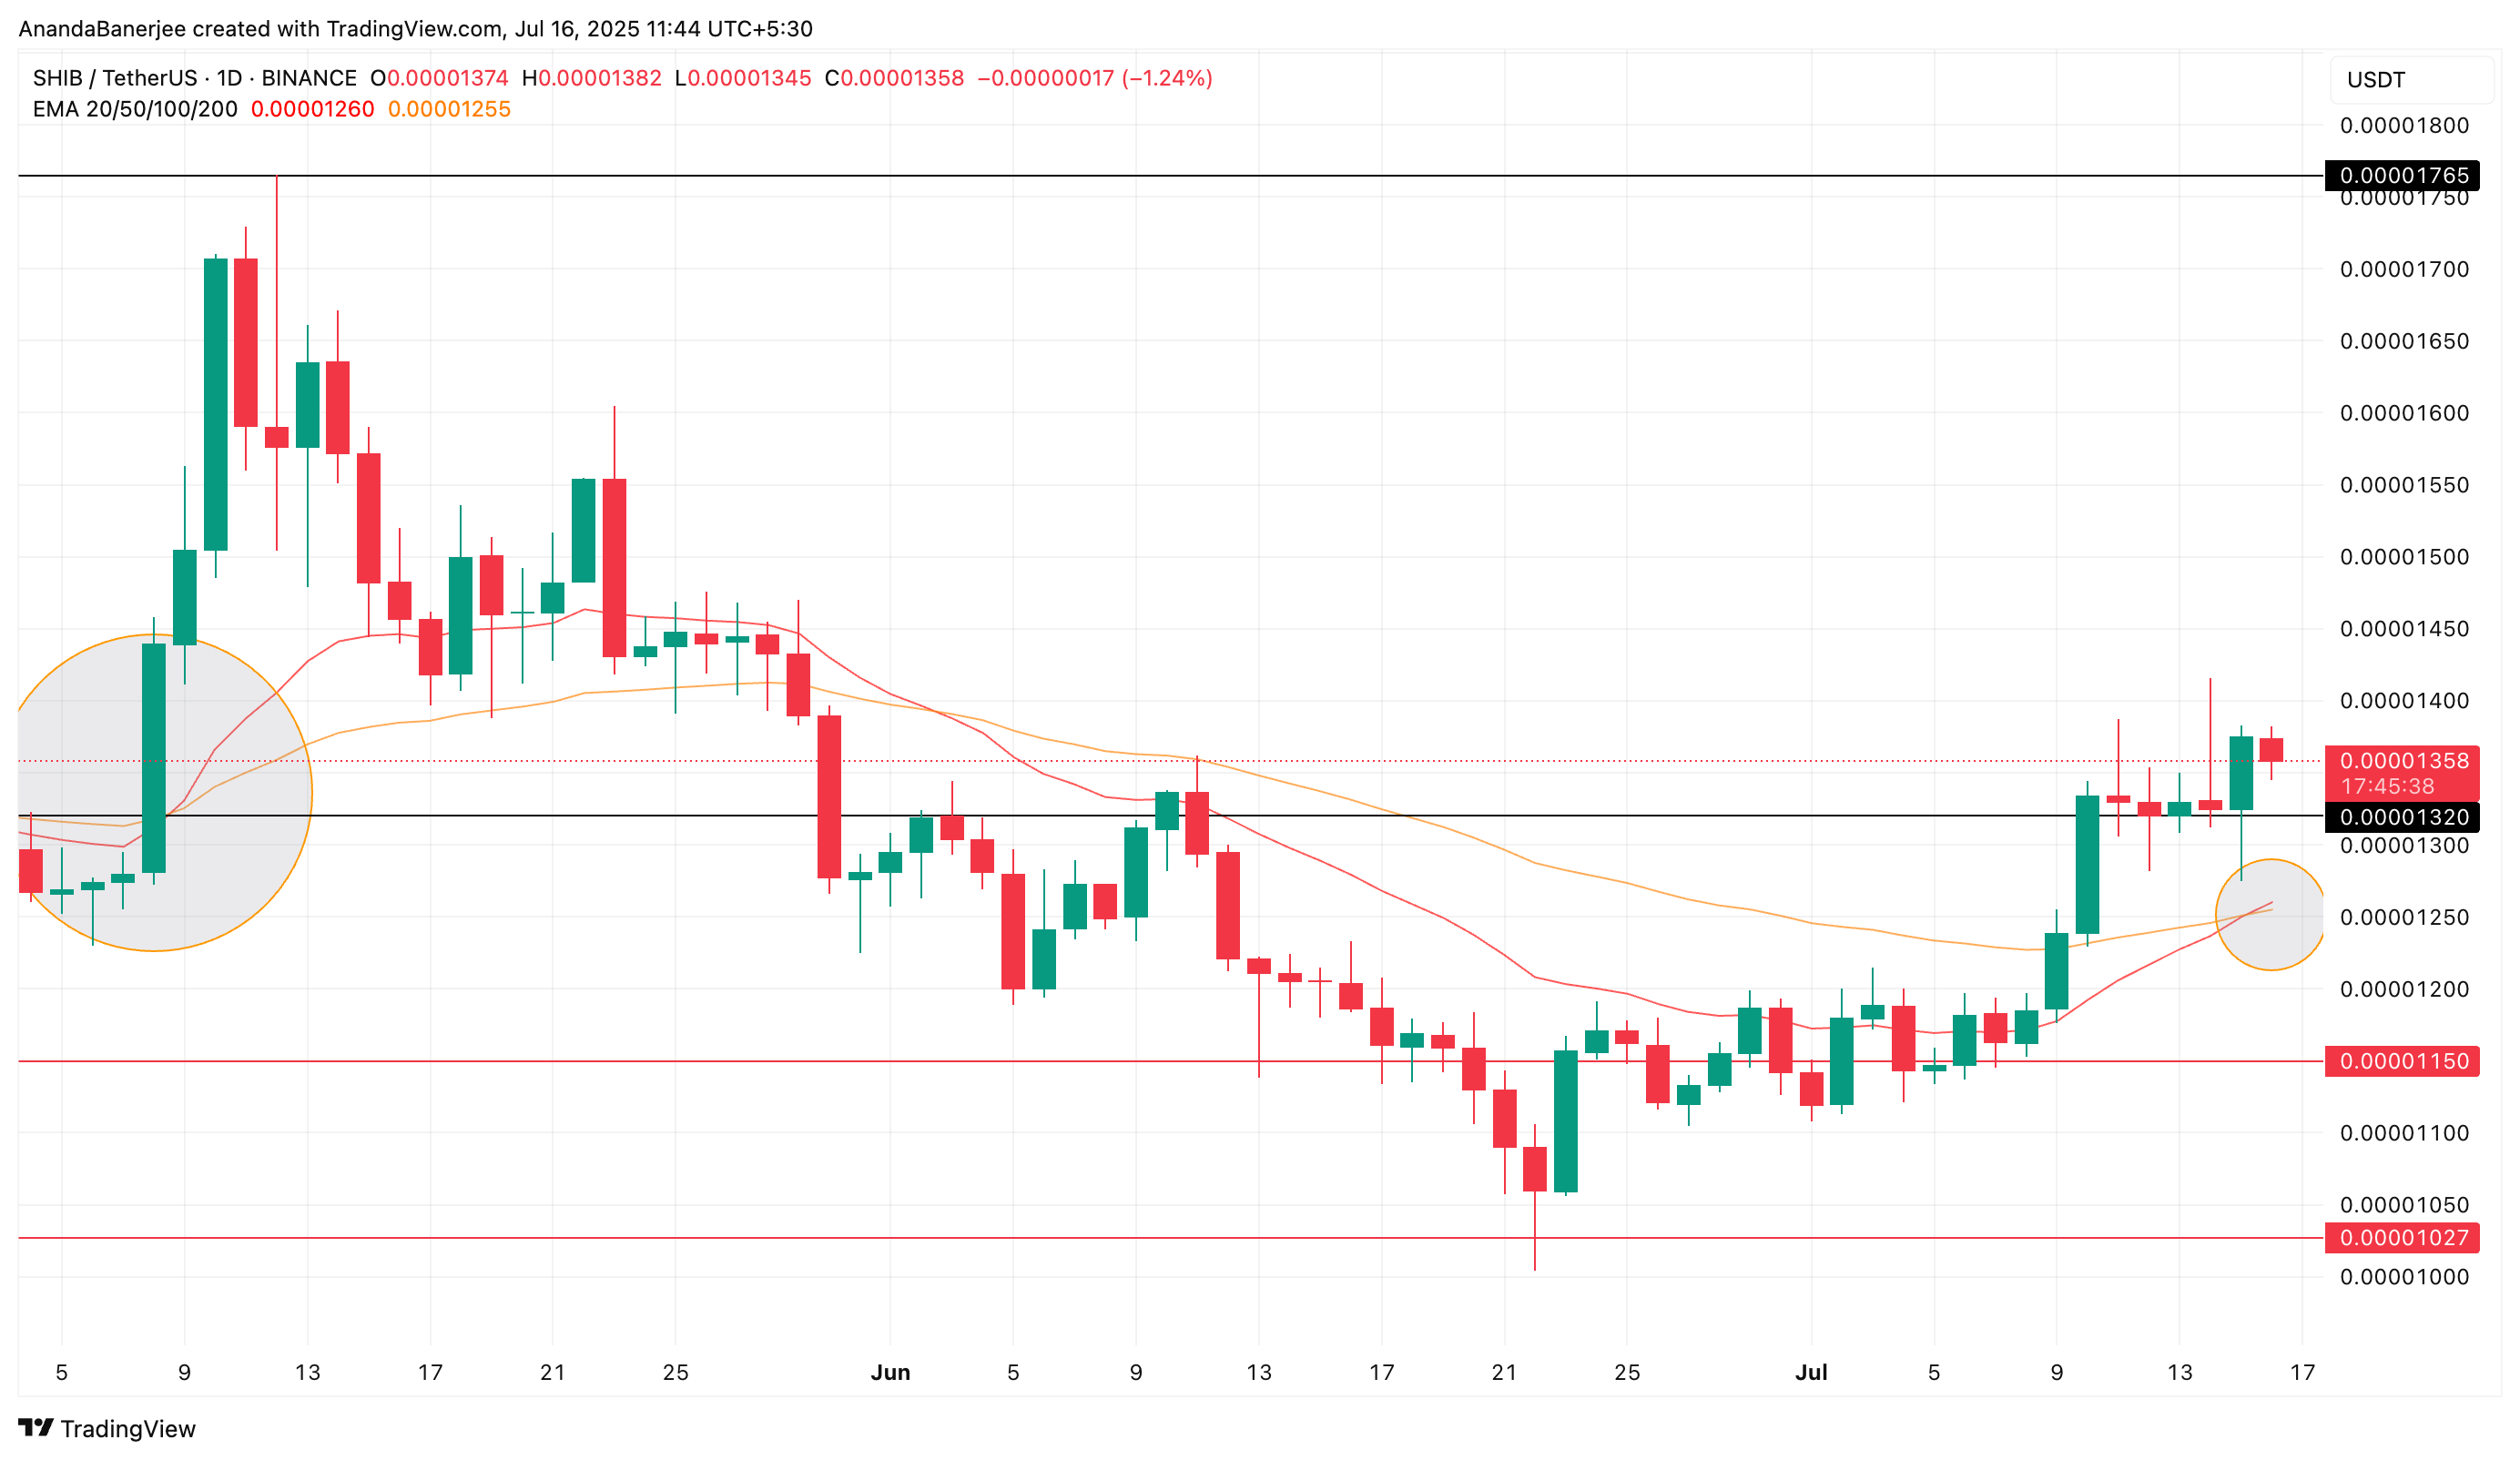
This exact pattern played out in May 2025, right around the $0.00001320 mark. Back then, SHIB jumped nearly 34%, reaching a high of $0.00001765. Interestingly, the current crossover has emerged at a nearly identical level; $0.00001358, raising the odds of history repeating itself.
The golden crossover is a bullish technical indicator that suggests momentum is shifting in favor of buyers. When the short-term EMA moves above the long-term EMA, it often means an uptrend could be starting.
SHIB Price Action Points to a 38% Rally if Resistance Breaks
Shiba Inu (SHIB) price is currently pressing against a minor resistance level NEAR $0.00001421, which it failed to touch a while back. Beyond that, the chart shows key supply zones at $0.00001468, $0.00001577, and $0.00001765.
If bulls reclaim those levels, the road opens toward $0.00001809 and $0.00001867 (low resistance zones), a potential 33% – 38% surge from current levels, similar to the one experienced in May.
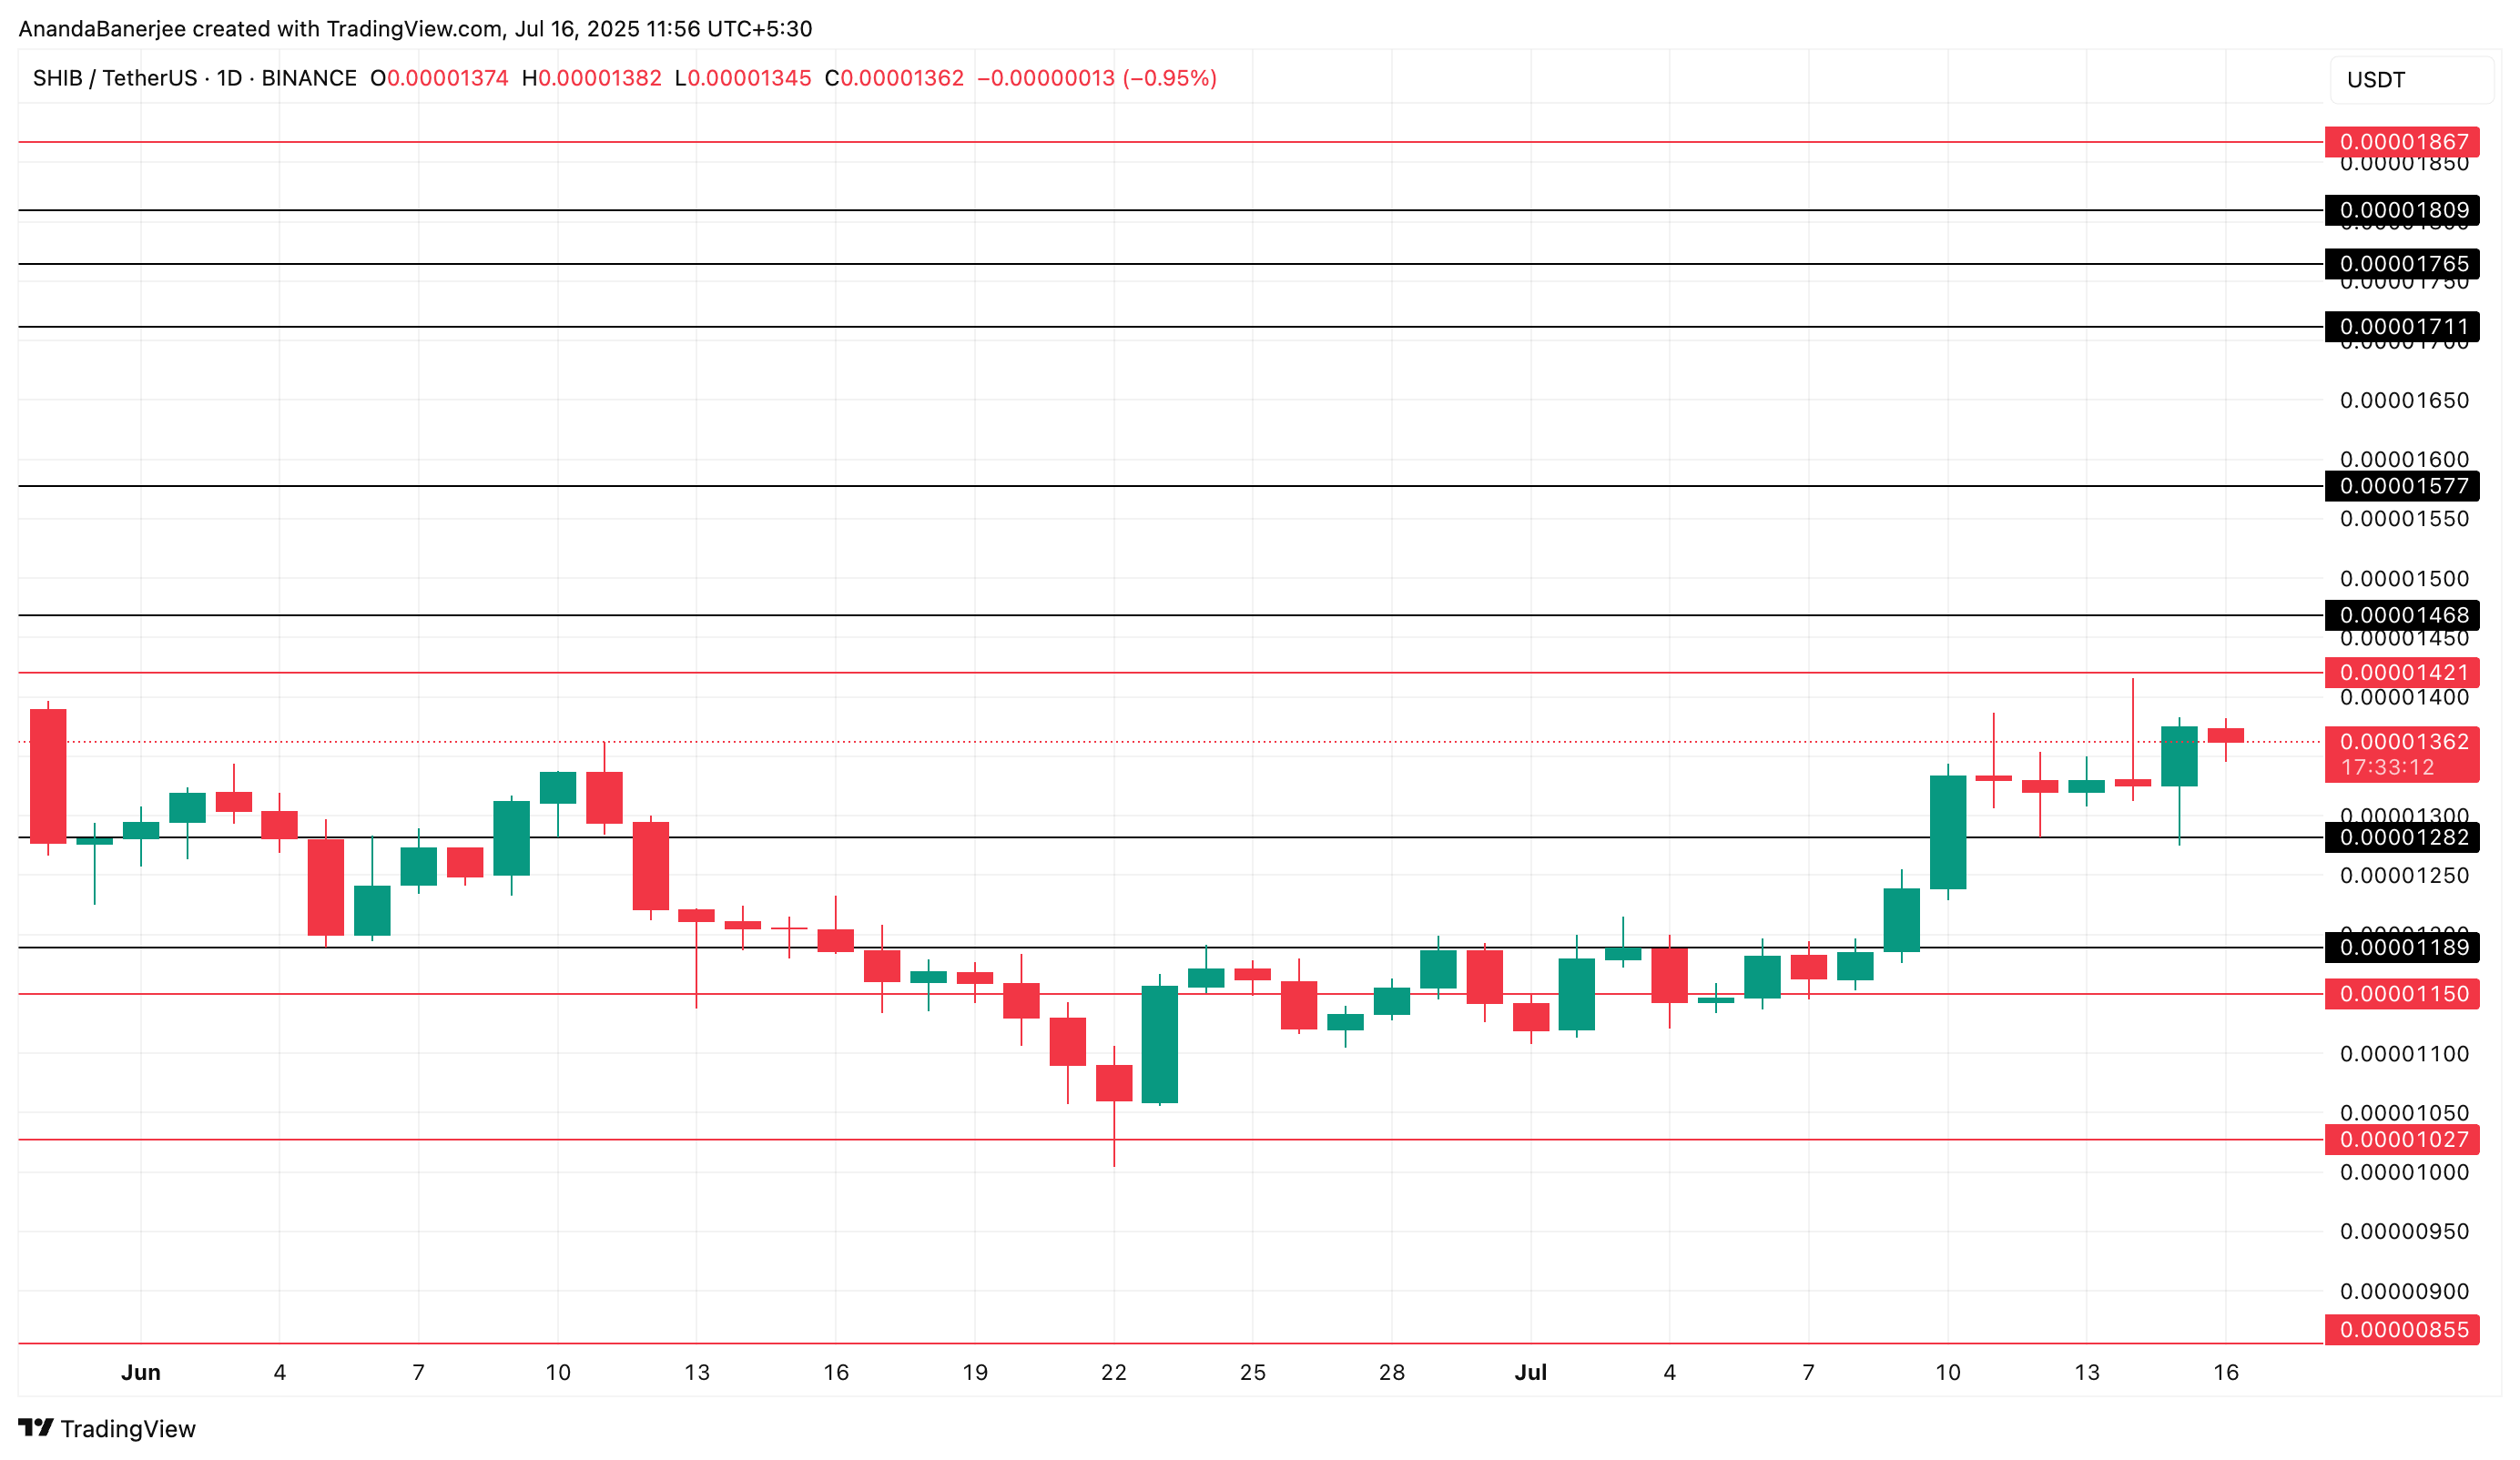
On the downside, immediate support sits at $0.00001320. It is the same price zone where the golden crossover flashed, followed by a stronger floor at $0.00001150.
However, if shiba inu price slips below the $0.00001282 support and then the key support levels of $0.00001189 and $0.00001150, the bullish direction would get invalidated. These levels could open the doors to a deeper correction.
