Ethereum (ETH) at Crossroads: 88% of Supply in Profit Sparks Sell-Off Fears

Ethereum's bulls are dancing on a tightrope—88% of circulating ETH now sits in profitable territory. That's the kind of stat that makes traders sweat through their Lamborghini-driving gloves.
The green wave
Nearly nine out of ten ETH coins are now worth more than their purchase price. Textbook profit-taking territory—if you ignore the fact that crypto traders treat 'textbook' like a dirty word.
Pressure points
Every percentage point above 85% profit supply historically precedes corrections. But since when has Ethereum followed historical patterns? The network that reinvented finance still plays by its own rules.
Wall Street's watching
Traditional finance vultures are circling, waiting to see if retail investors will panic-sell like they're dumping meme stocks again. Spoiler: they probably will—just maybe not today.
The bottom line? Ethereum's fundamentals haven't changed. Only the weak hands have. And in crypto, weak hands make strong traders rich.
Over 88% of ETH in Profit Could Signal Local Top
According to Glassnode, 88.57% of the ETH supply was in profit as of July 14, with price hovering NEAR $3,013. According to the one-month chart, whenever the ETH holders’ profit percentage surges, short-term corrections tend to follow.
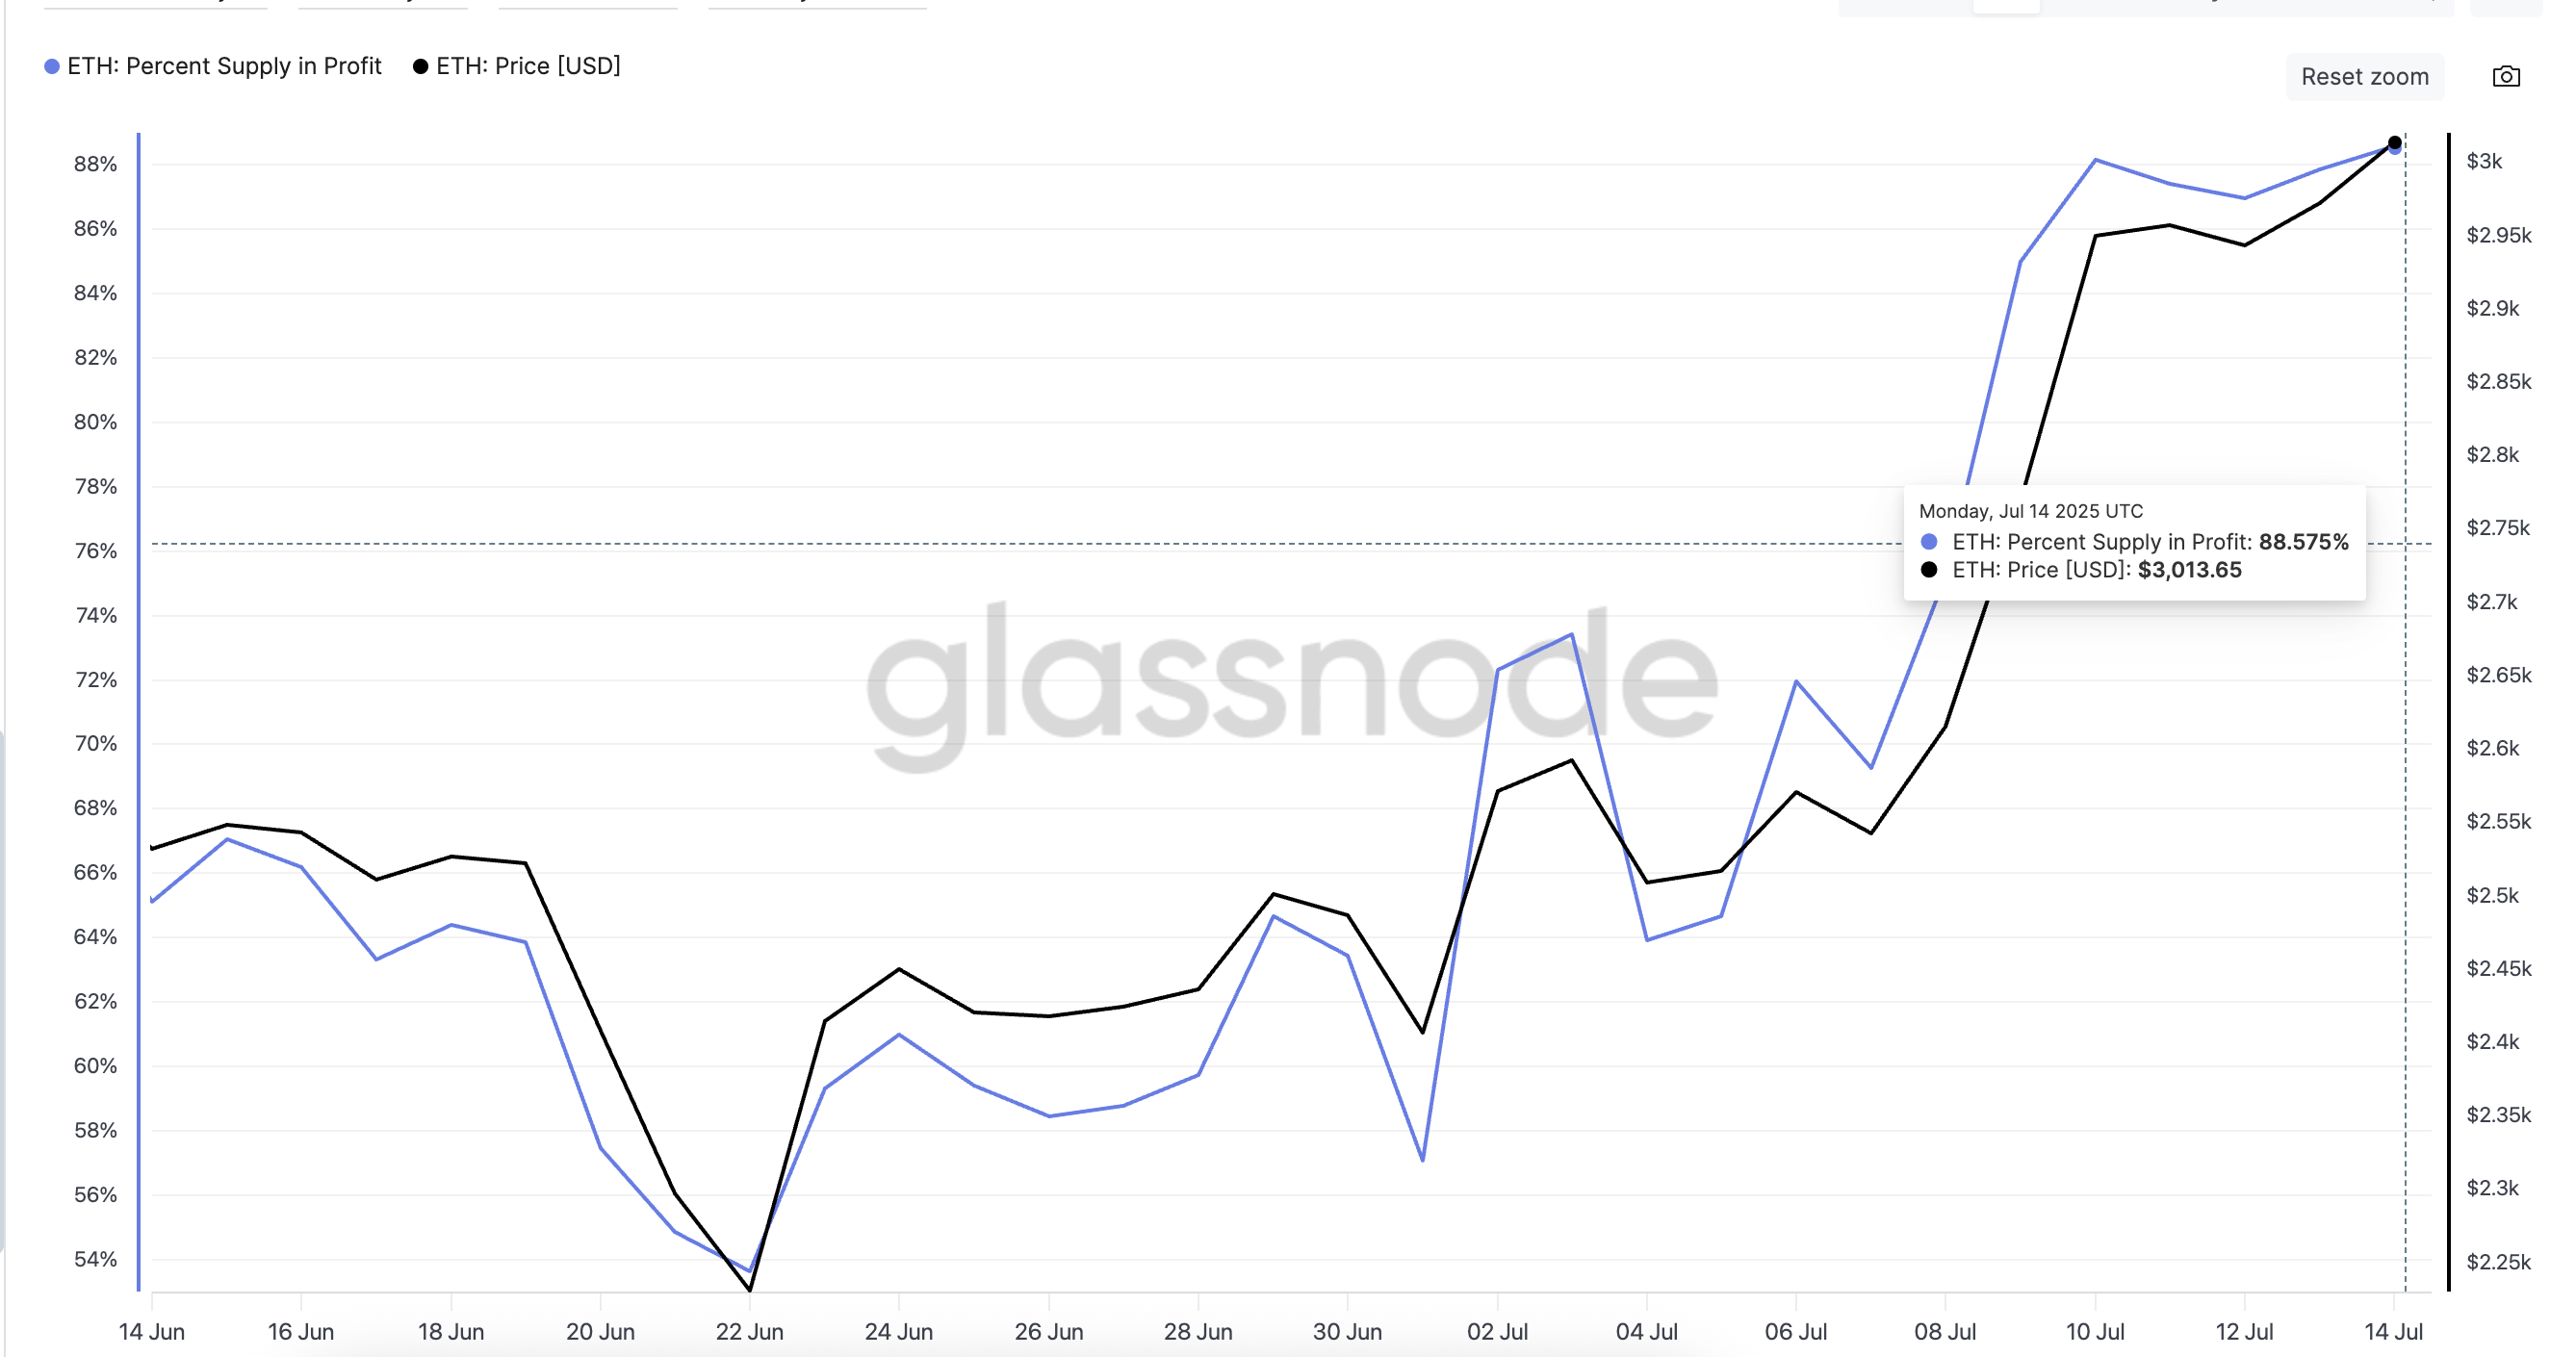
The Percent Supply in Profit metric tracks the proportion of circulating ETH whose acquisition cost is below the current market price. Spikes in this indicator often correspond to overheated rallies or post-rally exhaustion zones, something ETH is currently grappling with.
OBV Divergence Undermines Price Strength
While Ethereum price continued climbing from June 11 to July 14, On-Balance Volume (OBV) formed a lower high, confirming a bearish divergence. This means fewer traders are participating in the current leg up, a red flag for sustainability. The OBV risk was flagged here, hinting at a price correction.
Despite the correction happening, OBV hasn’t risen back and still poses another correction threat in the short term.
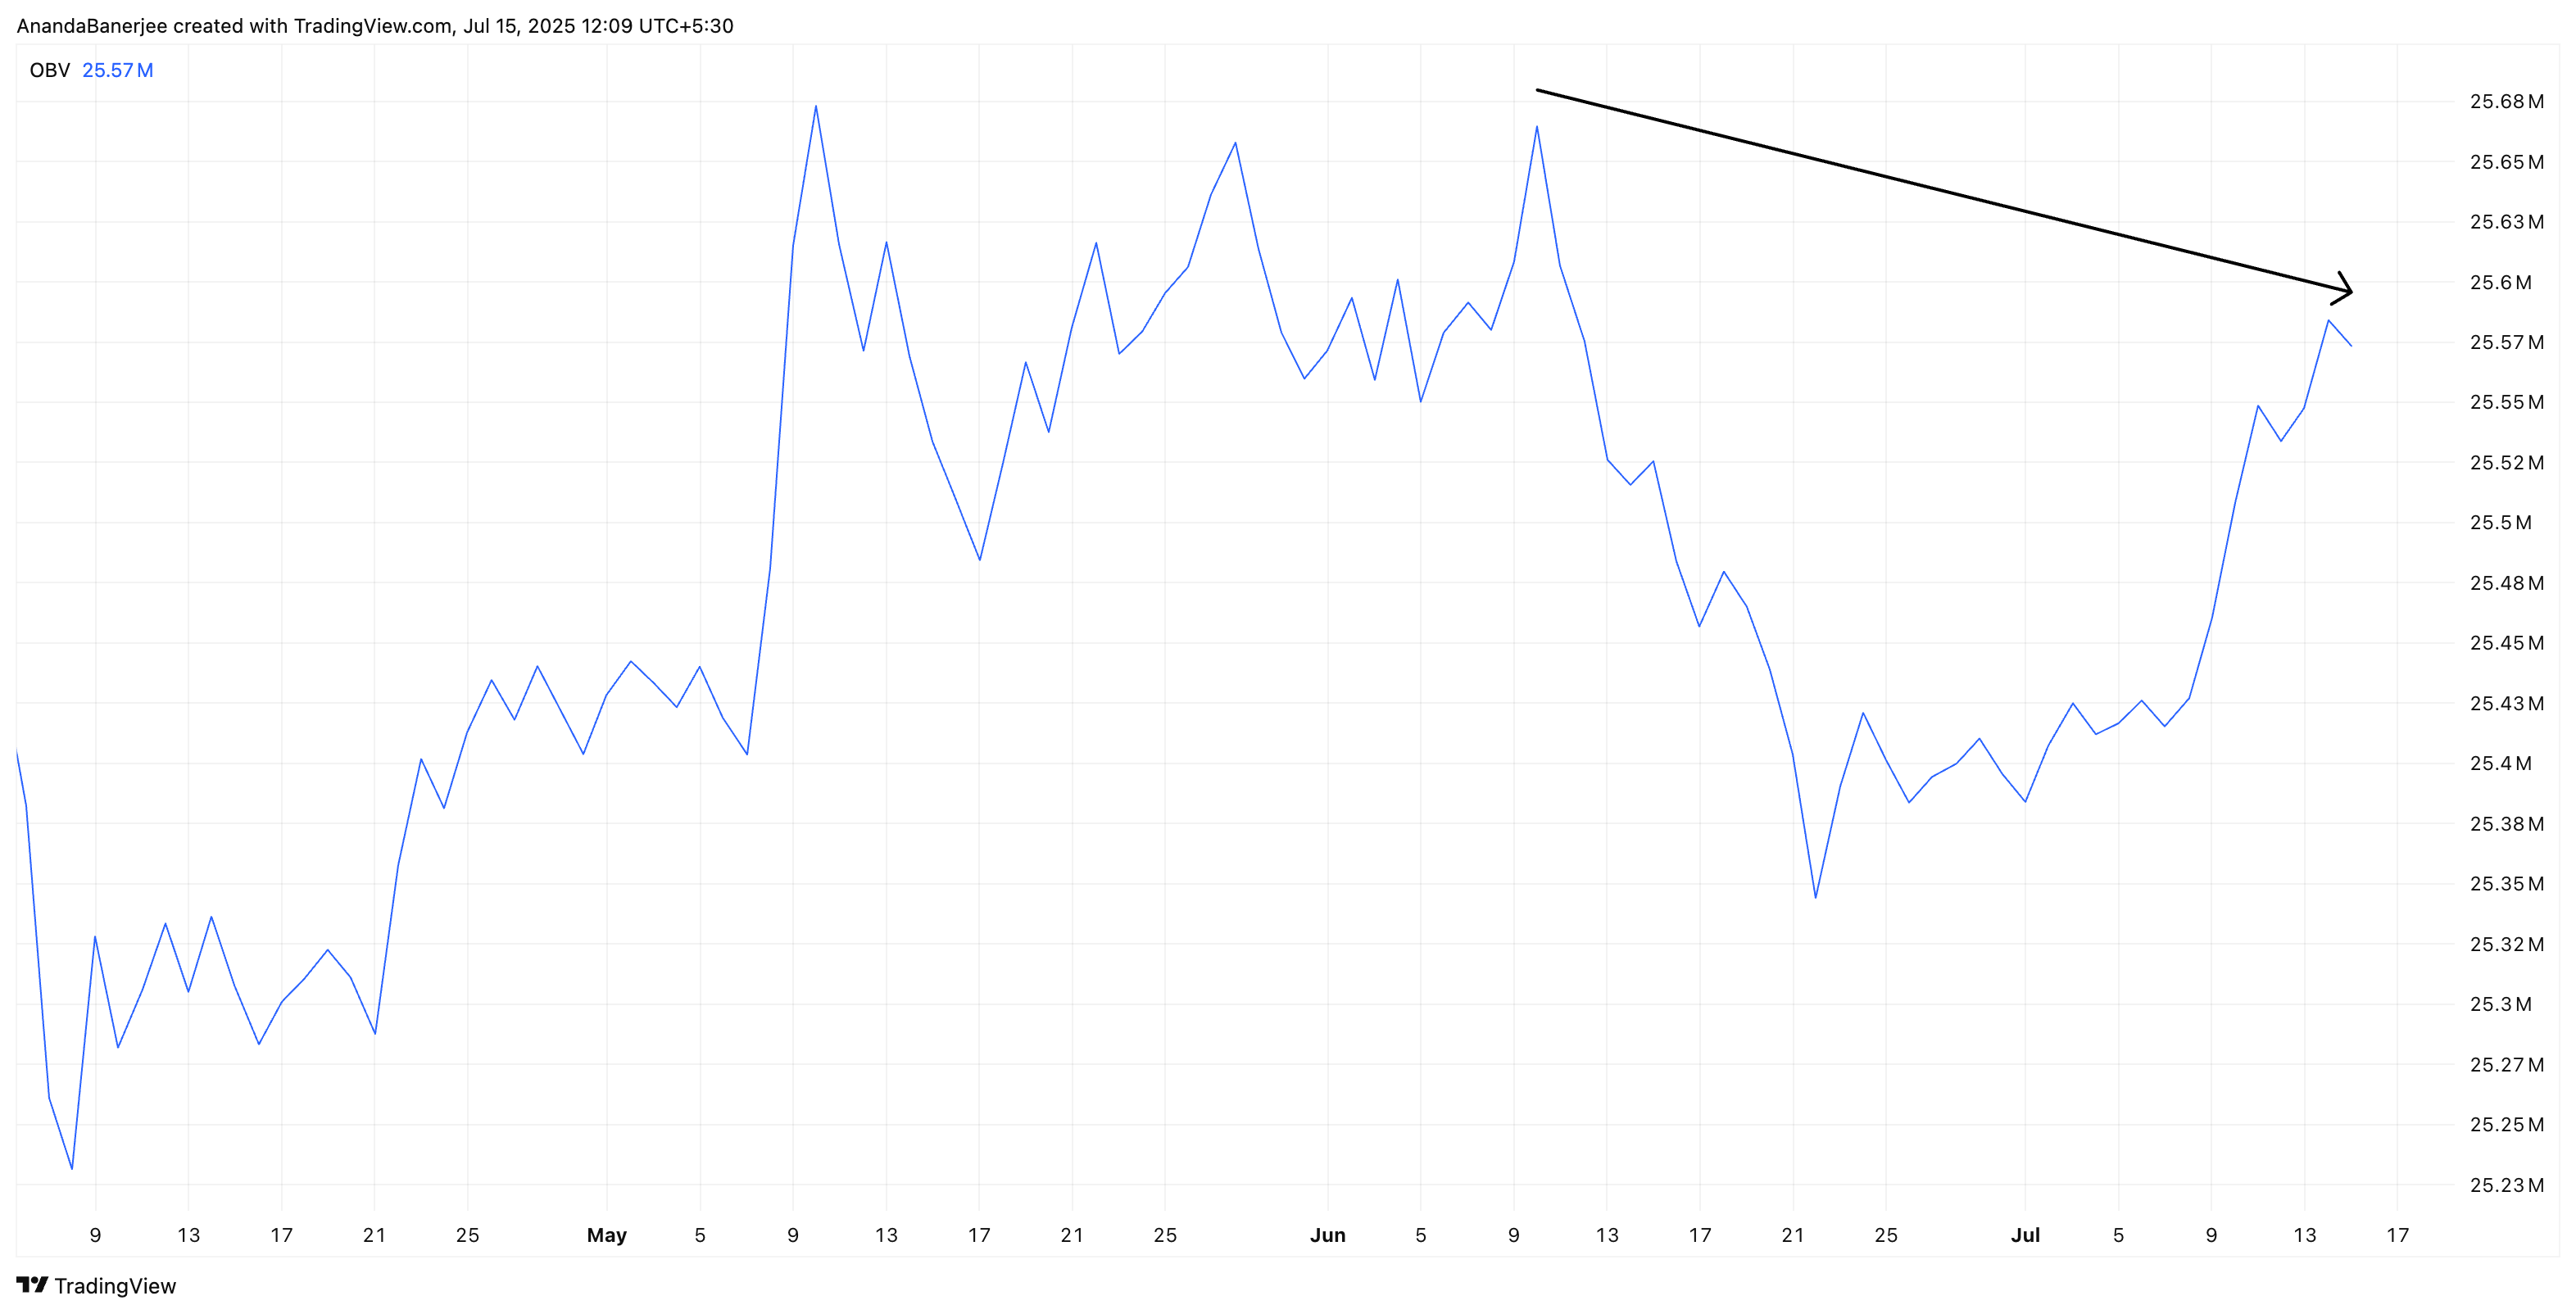
OBV measures volume FLOW by adding volume on up days and subtracting it on down days. When OBV fails to keep up with price, it suggests weakening accumulation or growing seller strength behind the scenes.
Fibonacci Levels Offer Key ETH Price Support
ETH price hit resistance at $3,079. After being rejected at this zone, the price is now consolidating around $2,981.
Immediate retracement support for ETH lies at:
- 0.236 level: $2,853
- 0.382 level: $2,713
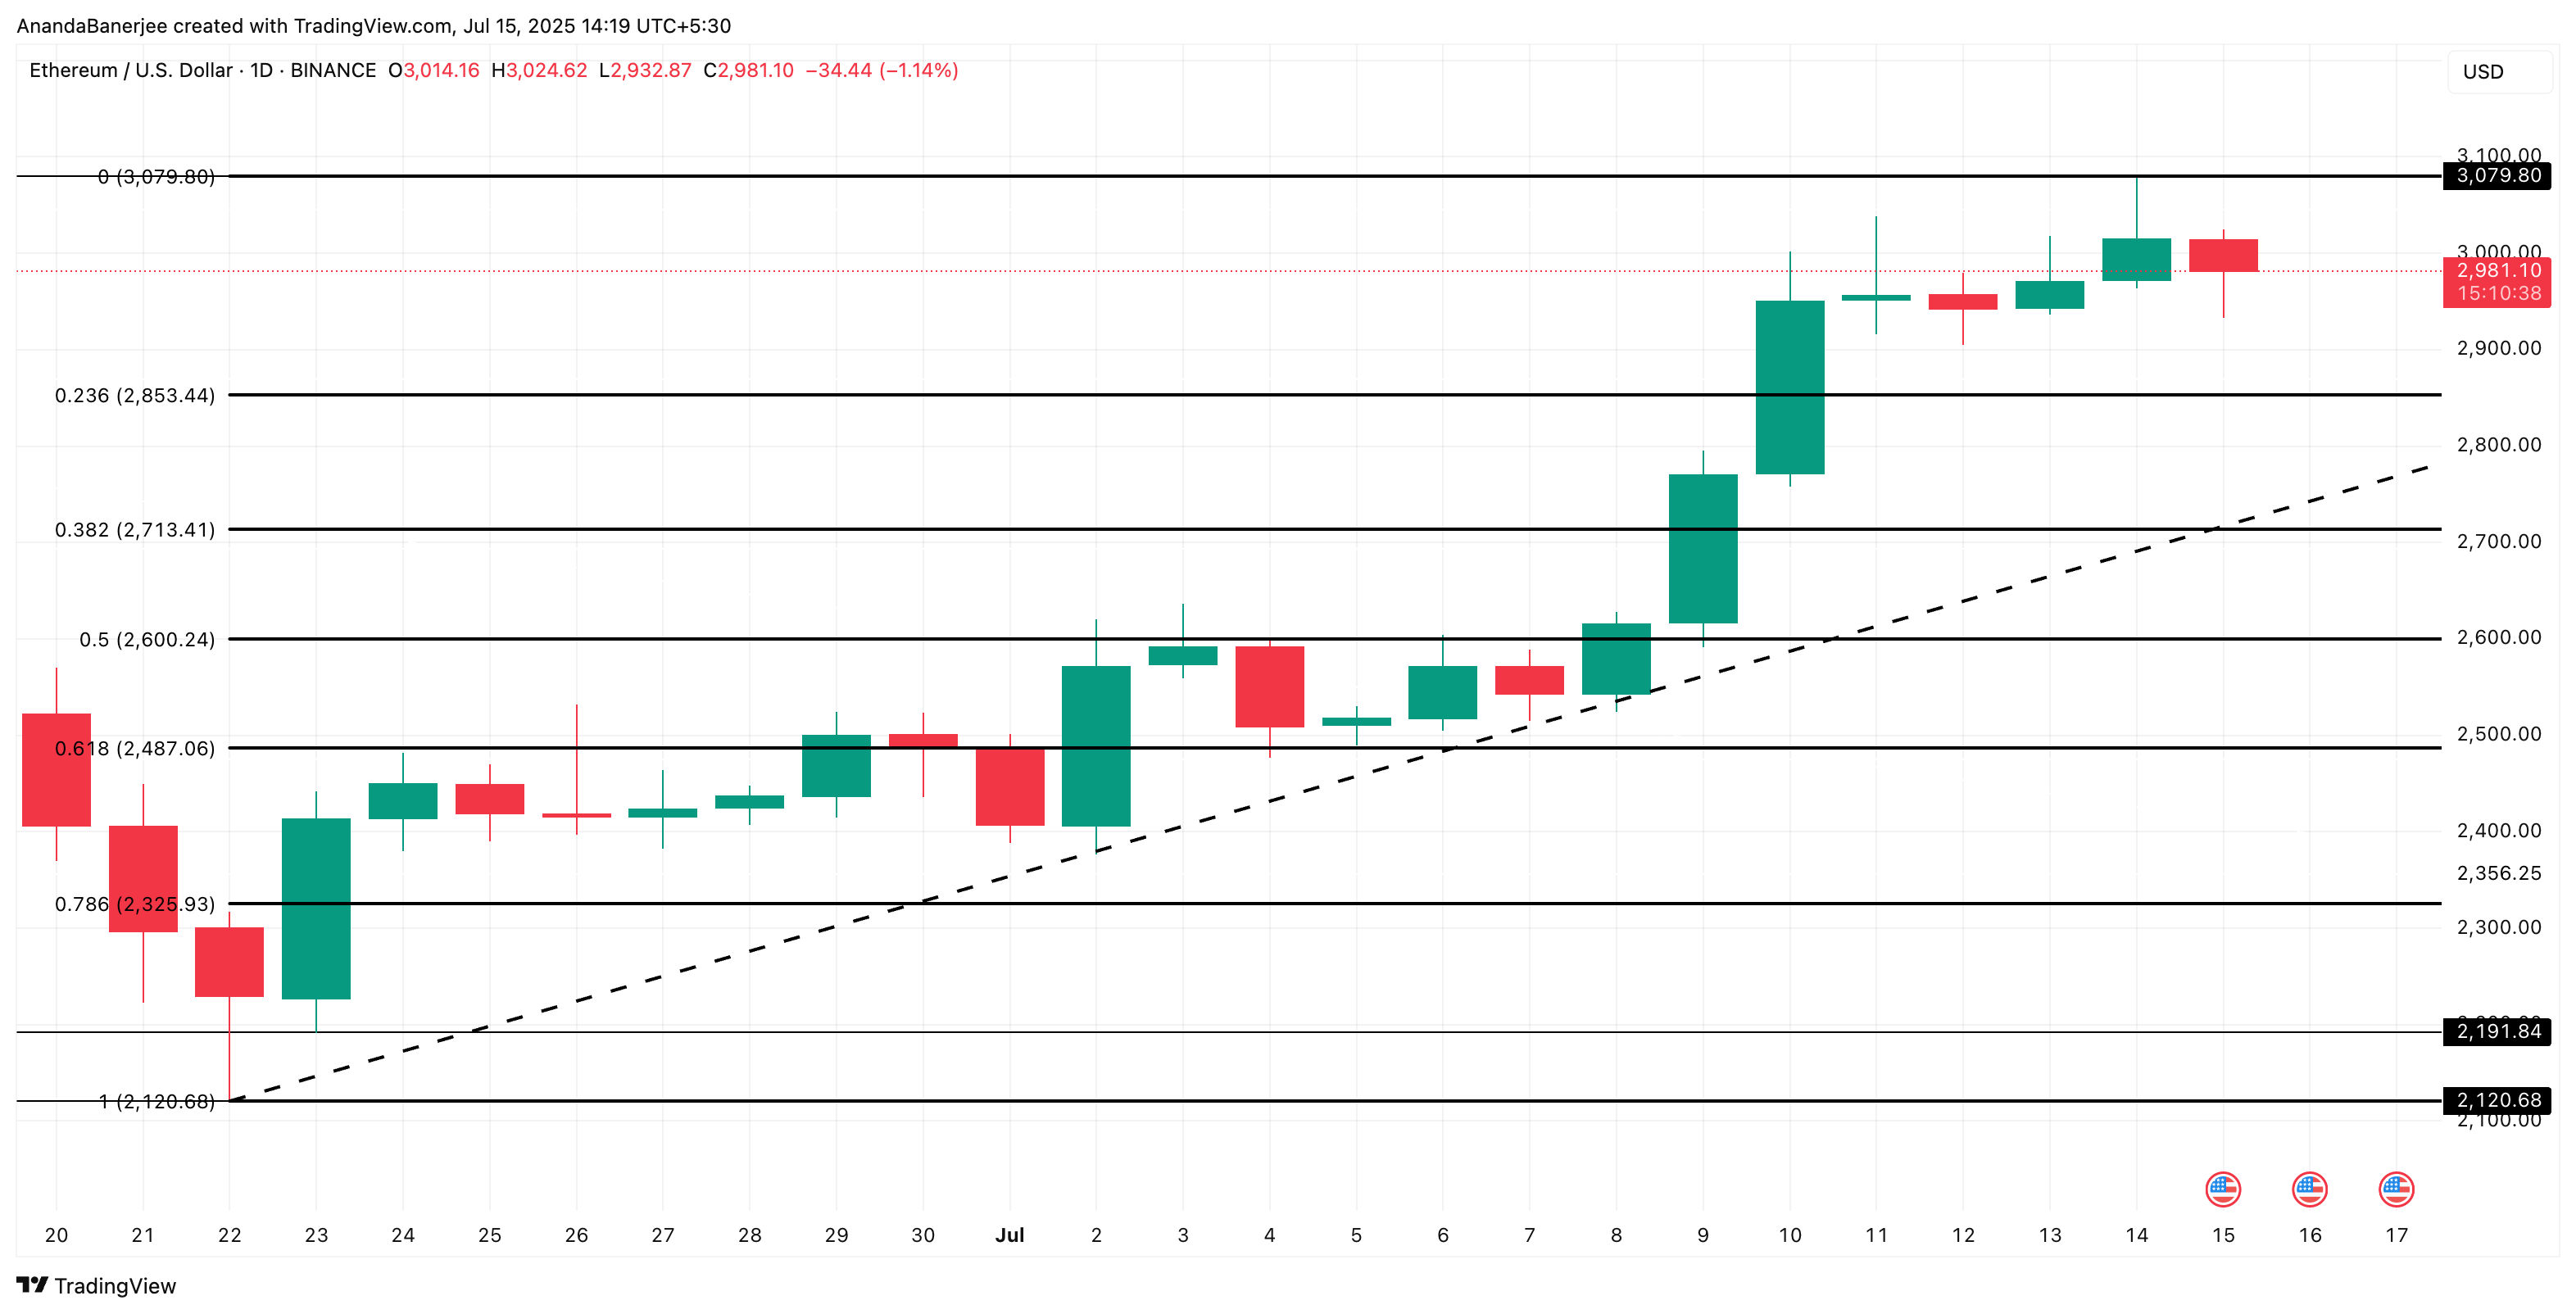
However, the ETH price chart suggests that $2,600 (0.5 Fib level) and $2,487 (0.618 Fib level) are the most critical support zones. These need to be breached for the overall structure to turn bearish.
The broader bullish structure still holds as long as ethereum stays above $2,713, as it coincides with a key breakout candle.
If Ethereum breaks and closes above $3,079 (its recent swing high), and OBV begins trending upward, the short-term bearish hypothesis will be invalidated. This would signal renewed buying conviction and potentially open the path to higher levels.
Until then, profit-taking and volume divergence suggest caution, especially as ETH hovers at a historically saturated profit level.
