Pi Coin’s First Bullish Divergence in Weeks Signals Potential Price Rally – Time to Buy?

After weeks of stagnation, Pi Coin flashes its first bullish divergence—traders are scrambling to decode the signal.
Is this the breakout moment or another false dawn for the mobile-mined crypto?
Technical indicators suggest momentum is building, but veteran traders know: hope isn’t a strategy (though it’s still the top asset in most retail portfolios).
Accumulation Line Reveals Steady Buyer Interest
The Accumulation/Distribution Line, which tracks the relationship between price and volume to spot buying or selling pressure, has started rising again. This happened precisely on July 9.
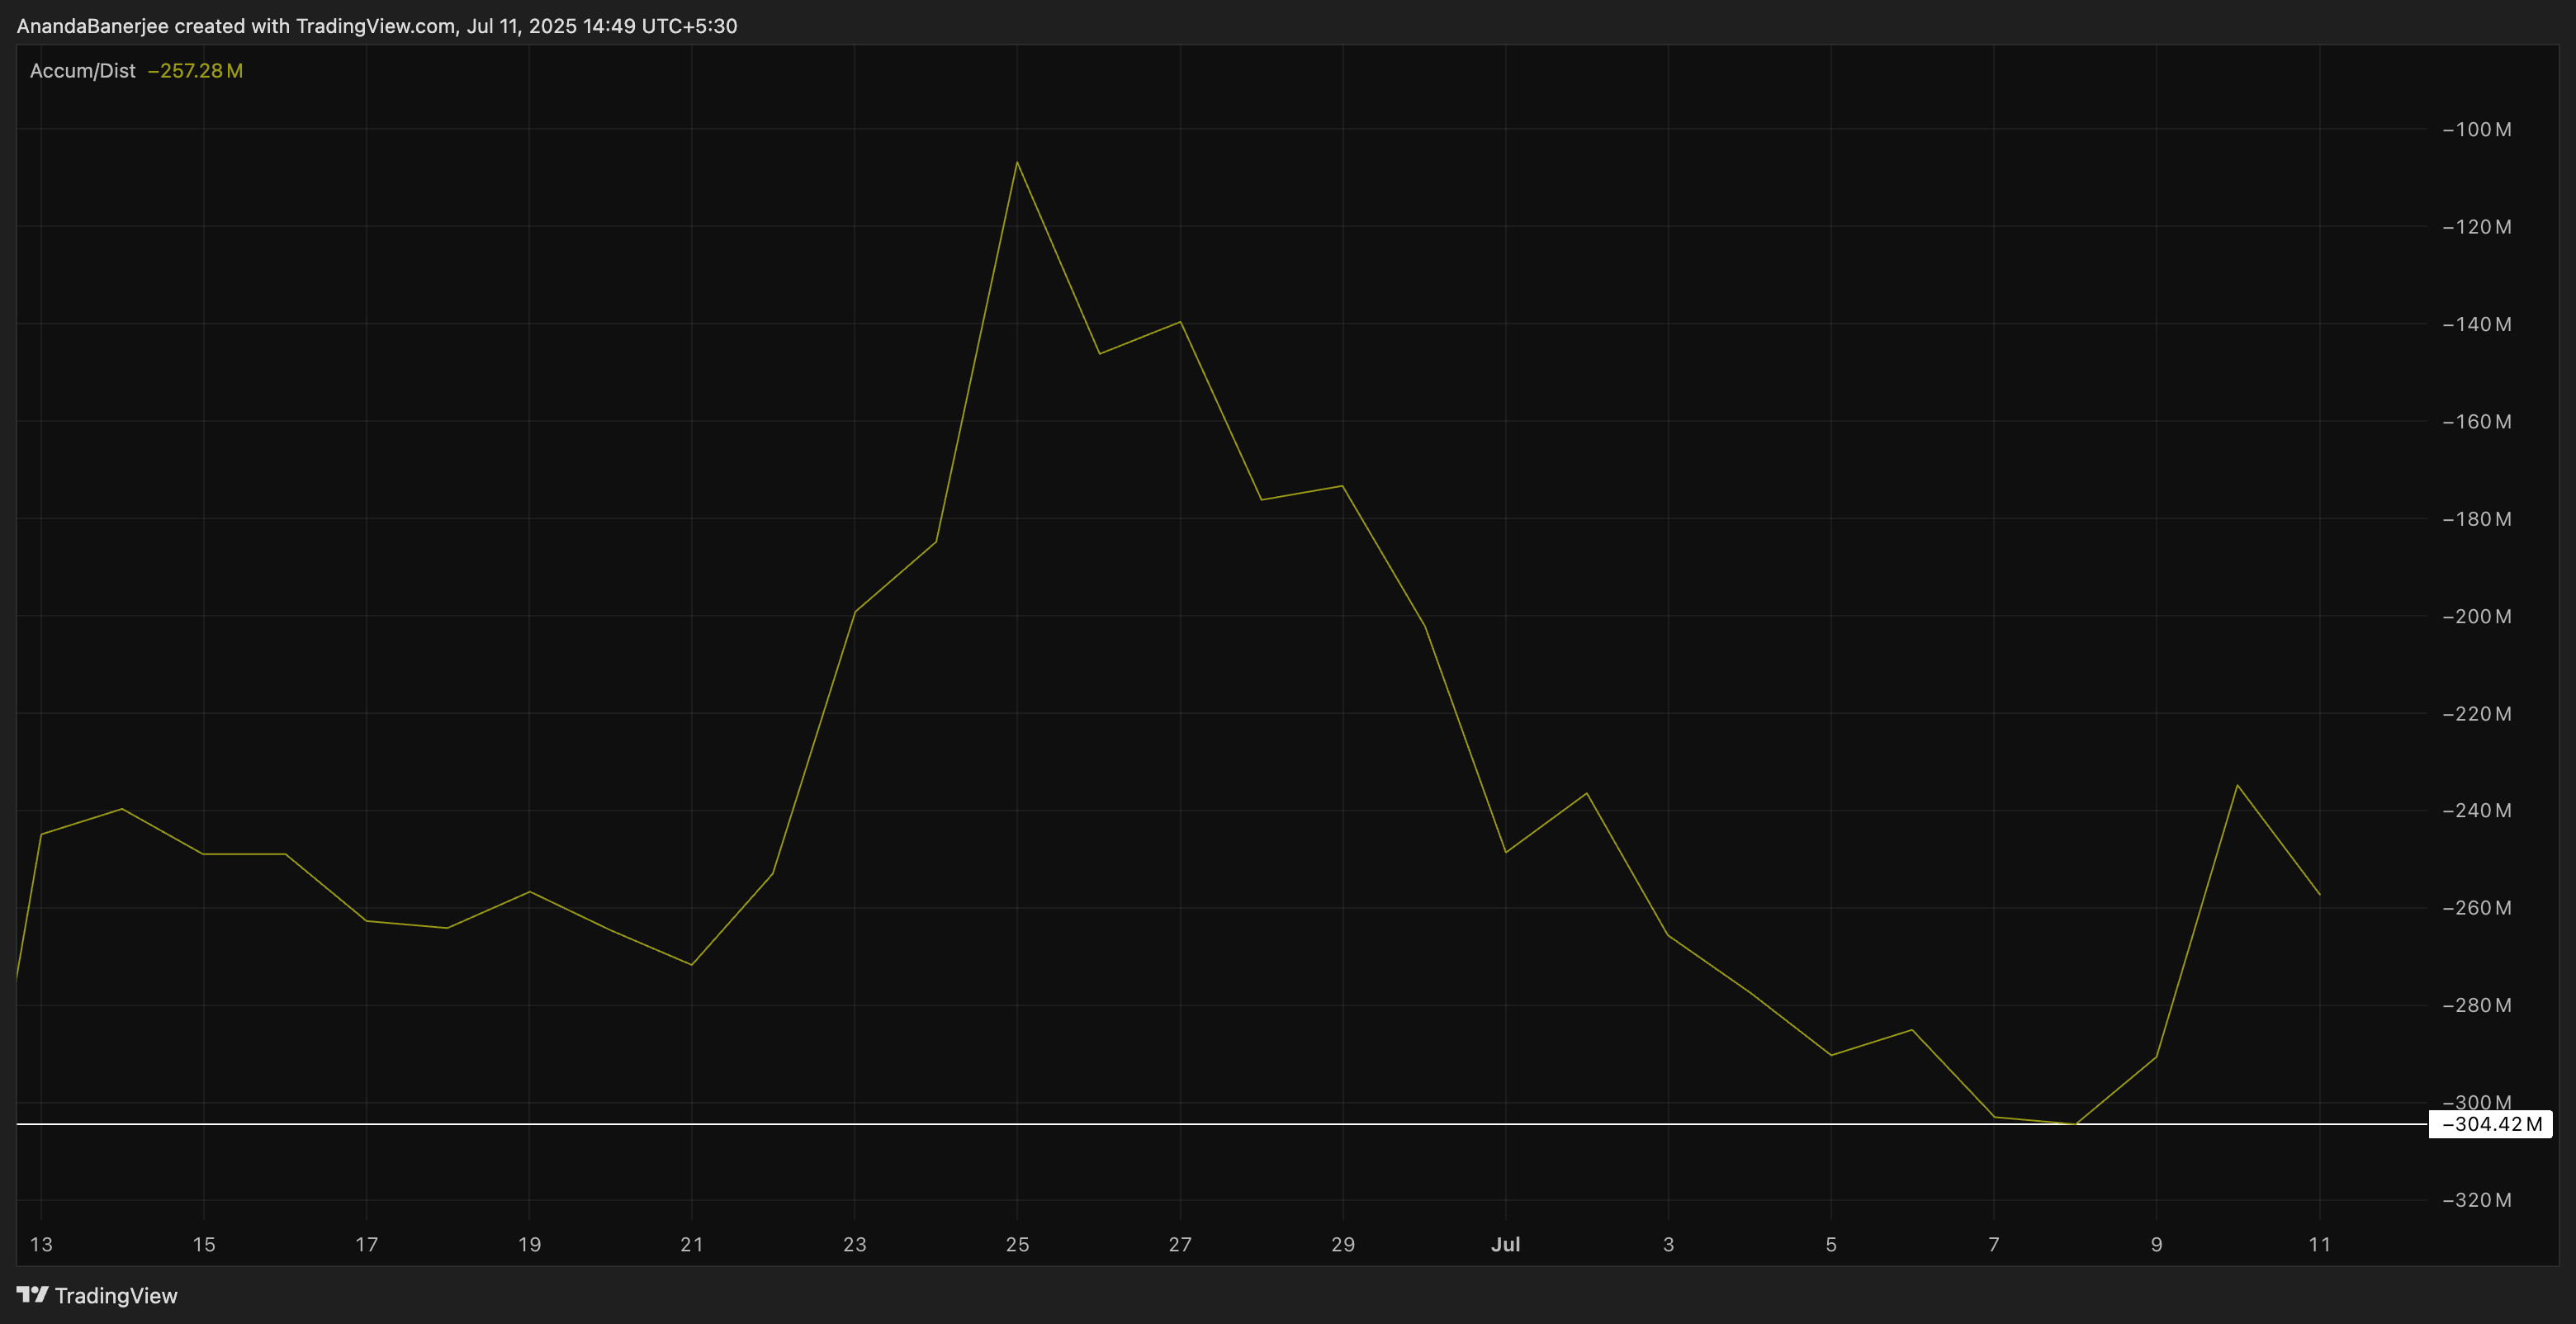
If the A/D line, despite the next-day dip, manages to stay above the July 8 low (marked by the horizontal line), the prices might end up seeing a positive impact.
This WOULD suggest that smart money may be quietly stacking Pi Coin despite the overall stagnation.
Sentiment Stays Elevated While PI Price Lags
Looking at historical trends, Pi Coin’s sentiment score (red line) tends to MOVE in lockstep with the PI price; as seen during the explosive rally in May where both lines surged together. This reflects a real-time crowd reaction rather than a predictive signal.
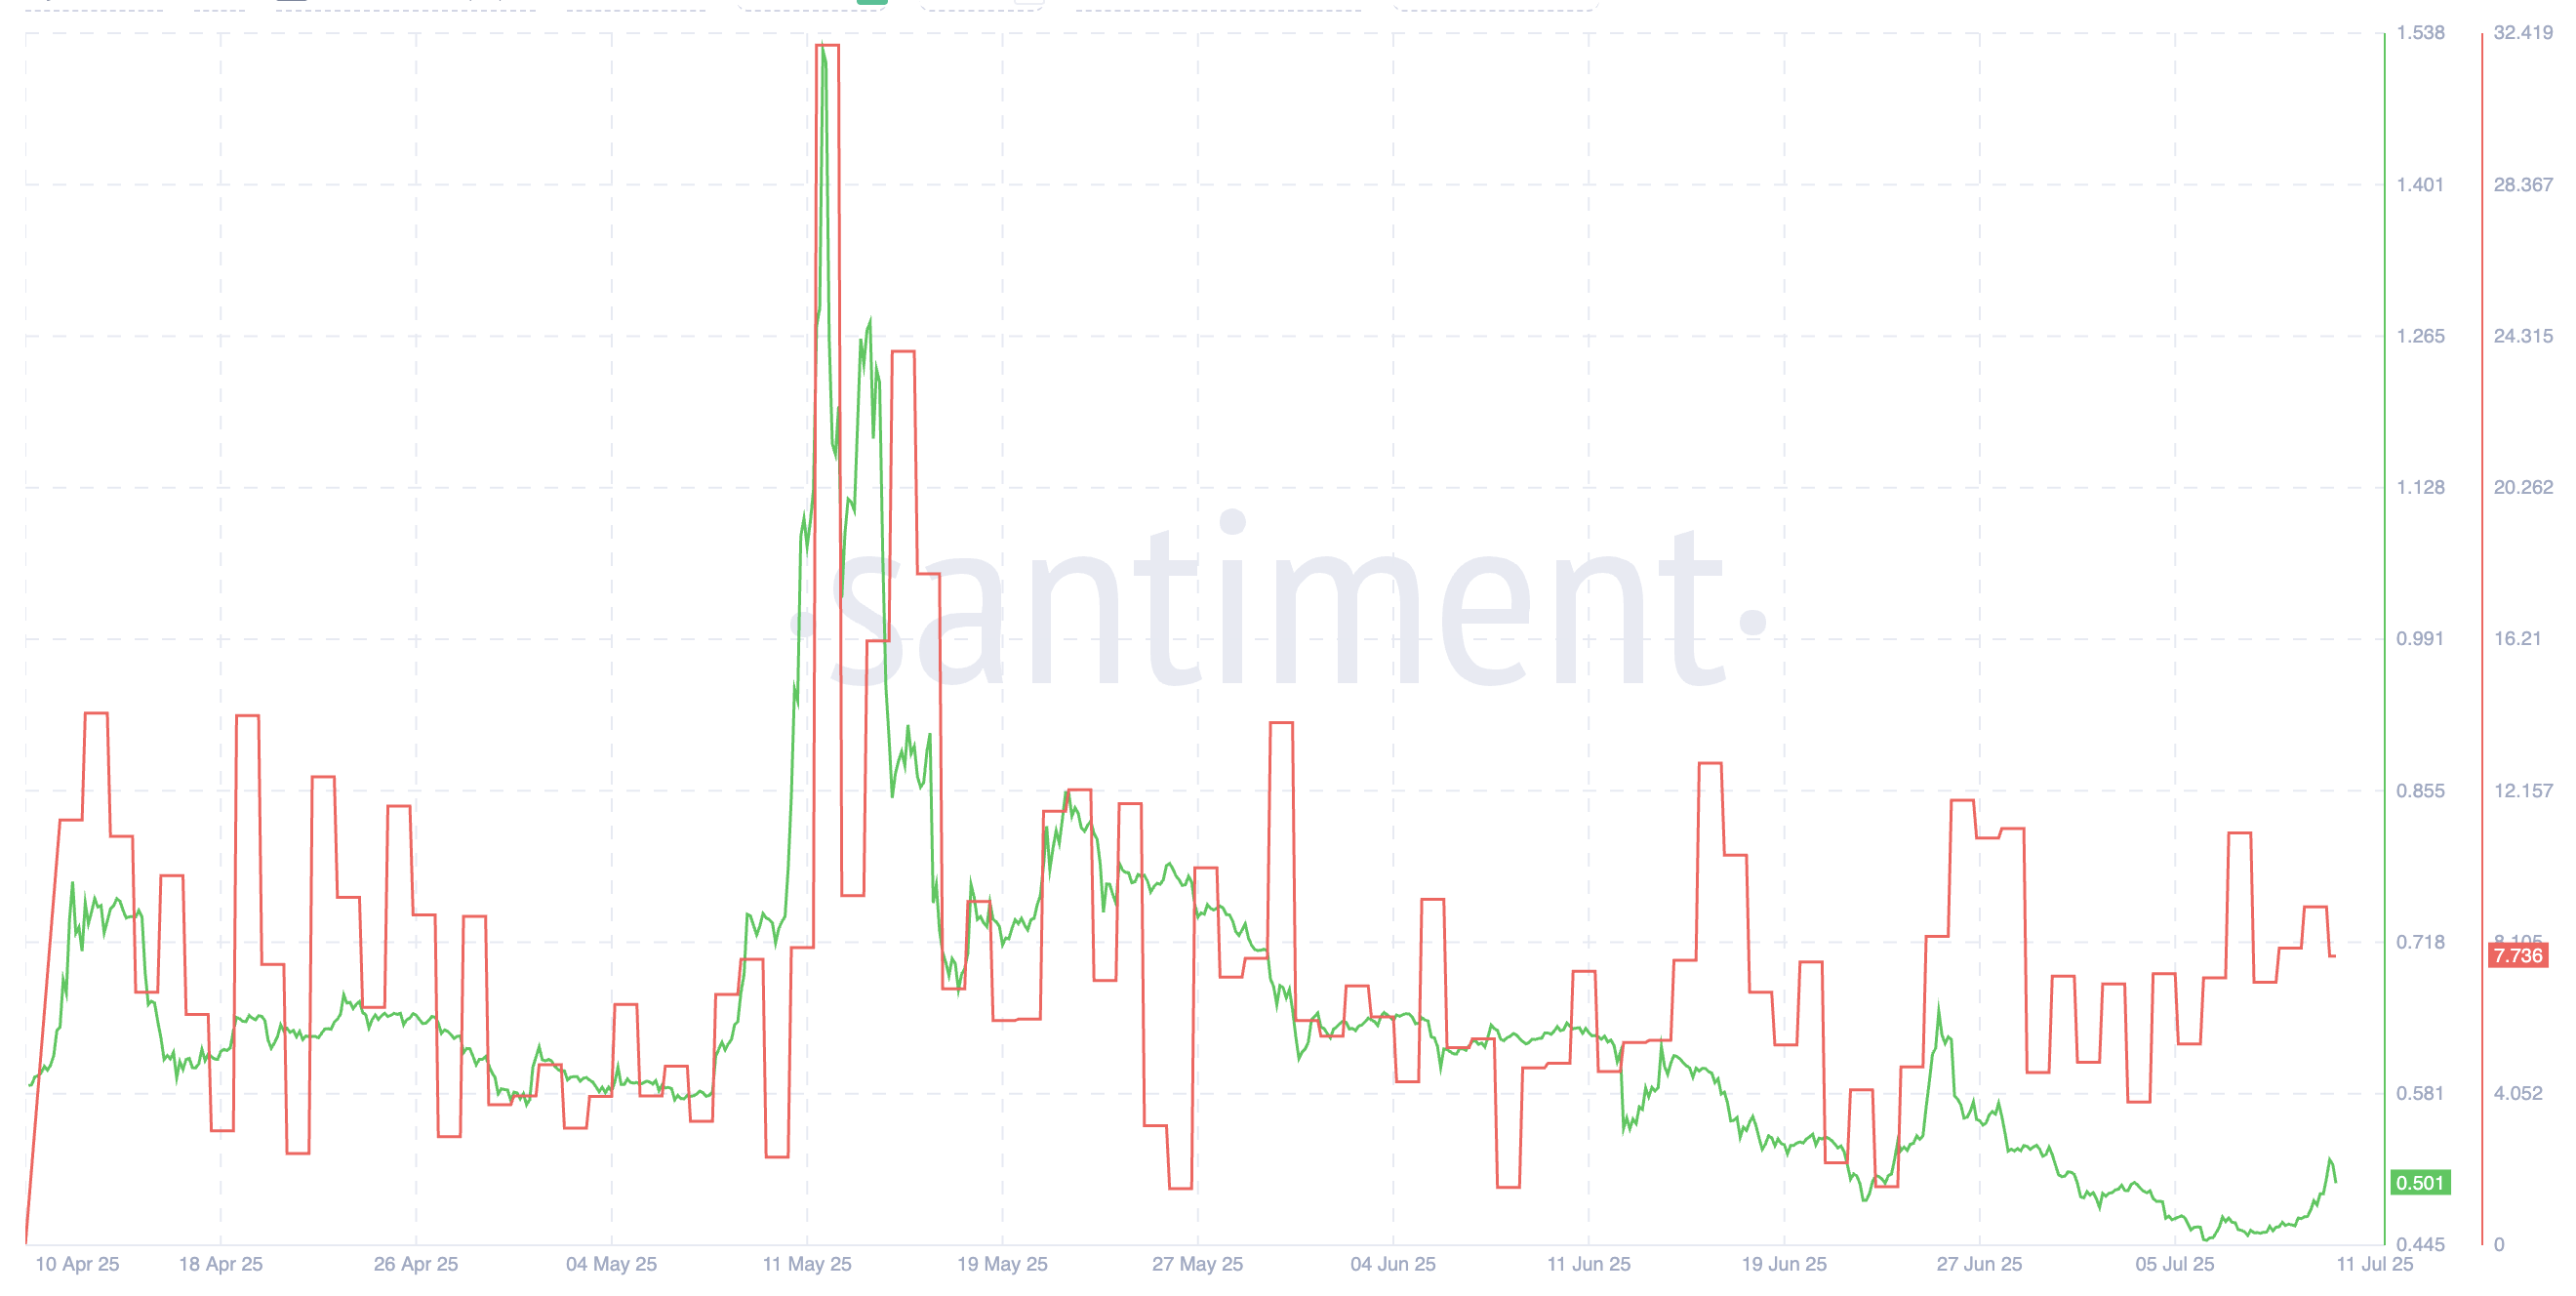
Now, sentiment has again picked up and continues to hover in the upper positive zone. It isn’t at euphoric highs like in mid-May, but it remains well above neutral, suggesting that traders still feel optimistic about Pi’s prospects.
What stands out this time is the disconnect: price hasn’t followed with equal intensity. Even though PI briefly jumped from $0.465 to $0.51 on July 10, it’s still hovering NEAR key resistance. If sentiment remains steady, as it has in past rallies, a delayed price reaction could still be on the table.
Stochastic RSI Crossover Adds Momentum Signal
Momentum confirmation came from the Stochastic RSI, a momentum oscillator that compares an asset’s RSI to its high-low range over time. The recent crossover, where the blue line moved above the orange line, signals bullish momentum building up. This kind of crossover often appears at the start of trend reversals or fresh legs up.
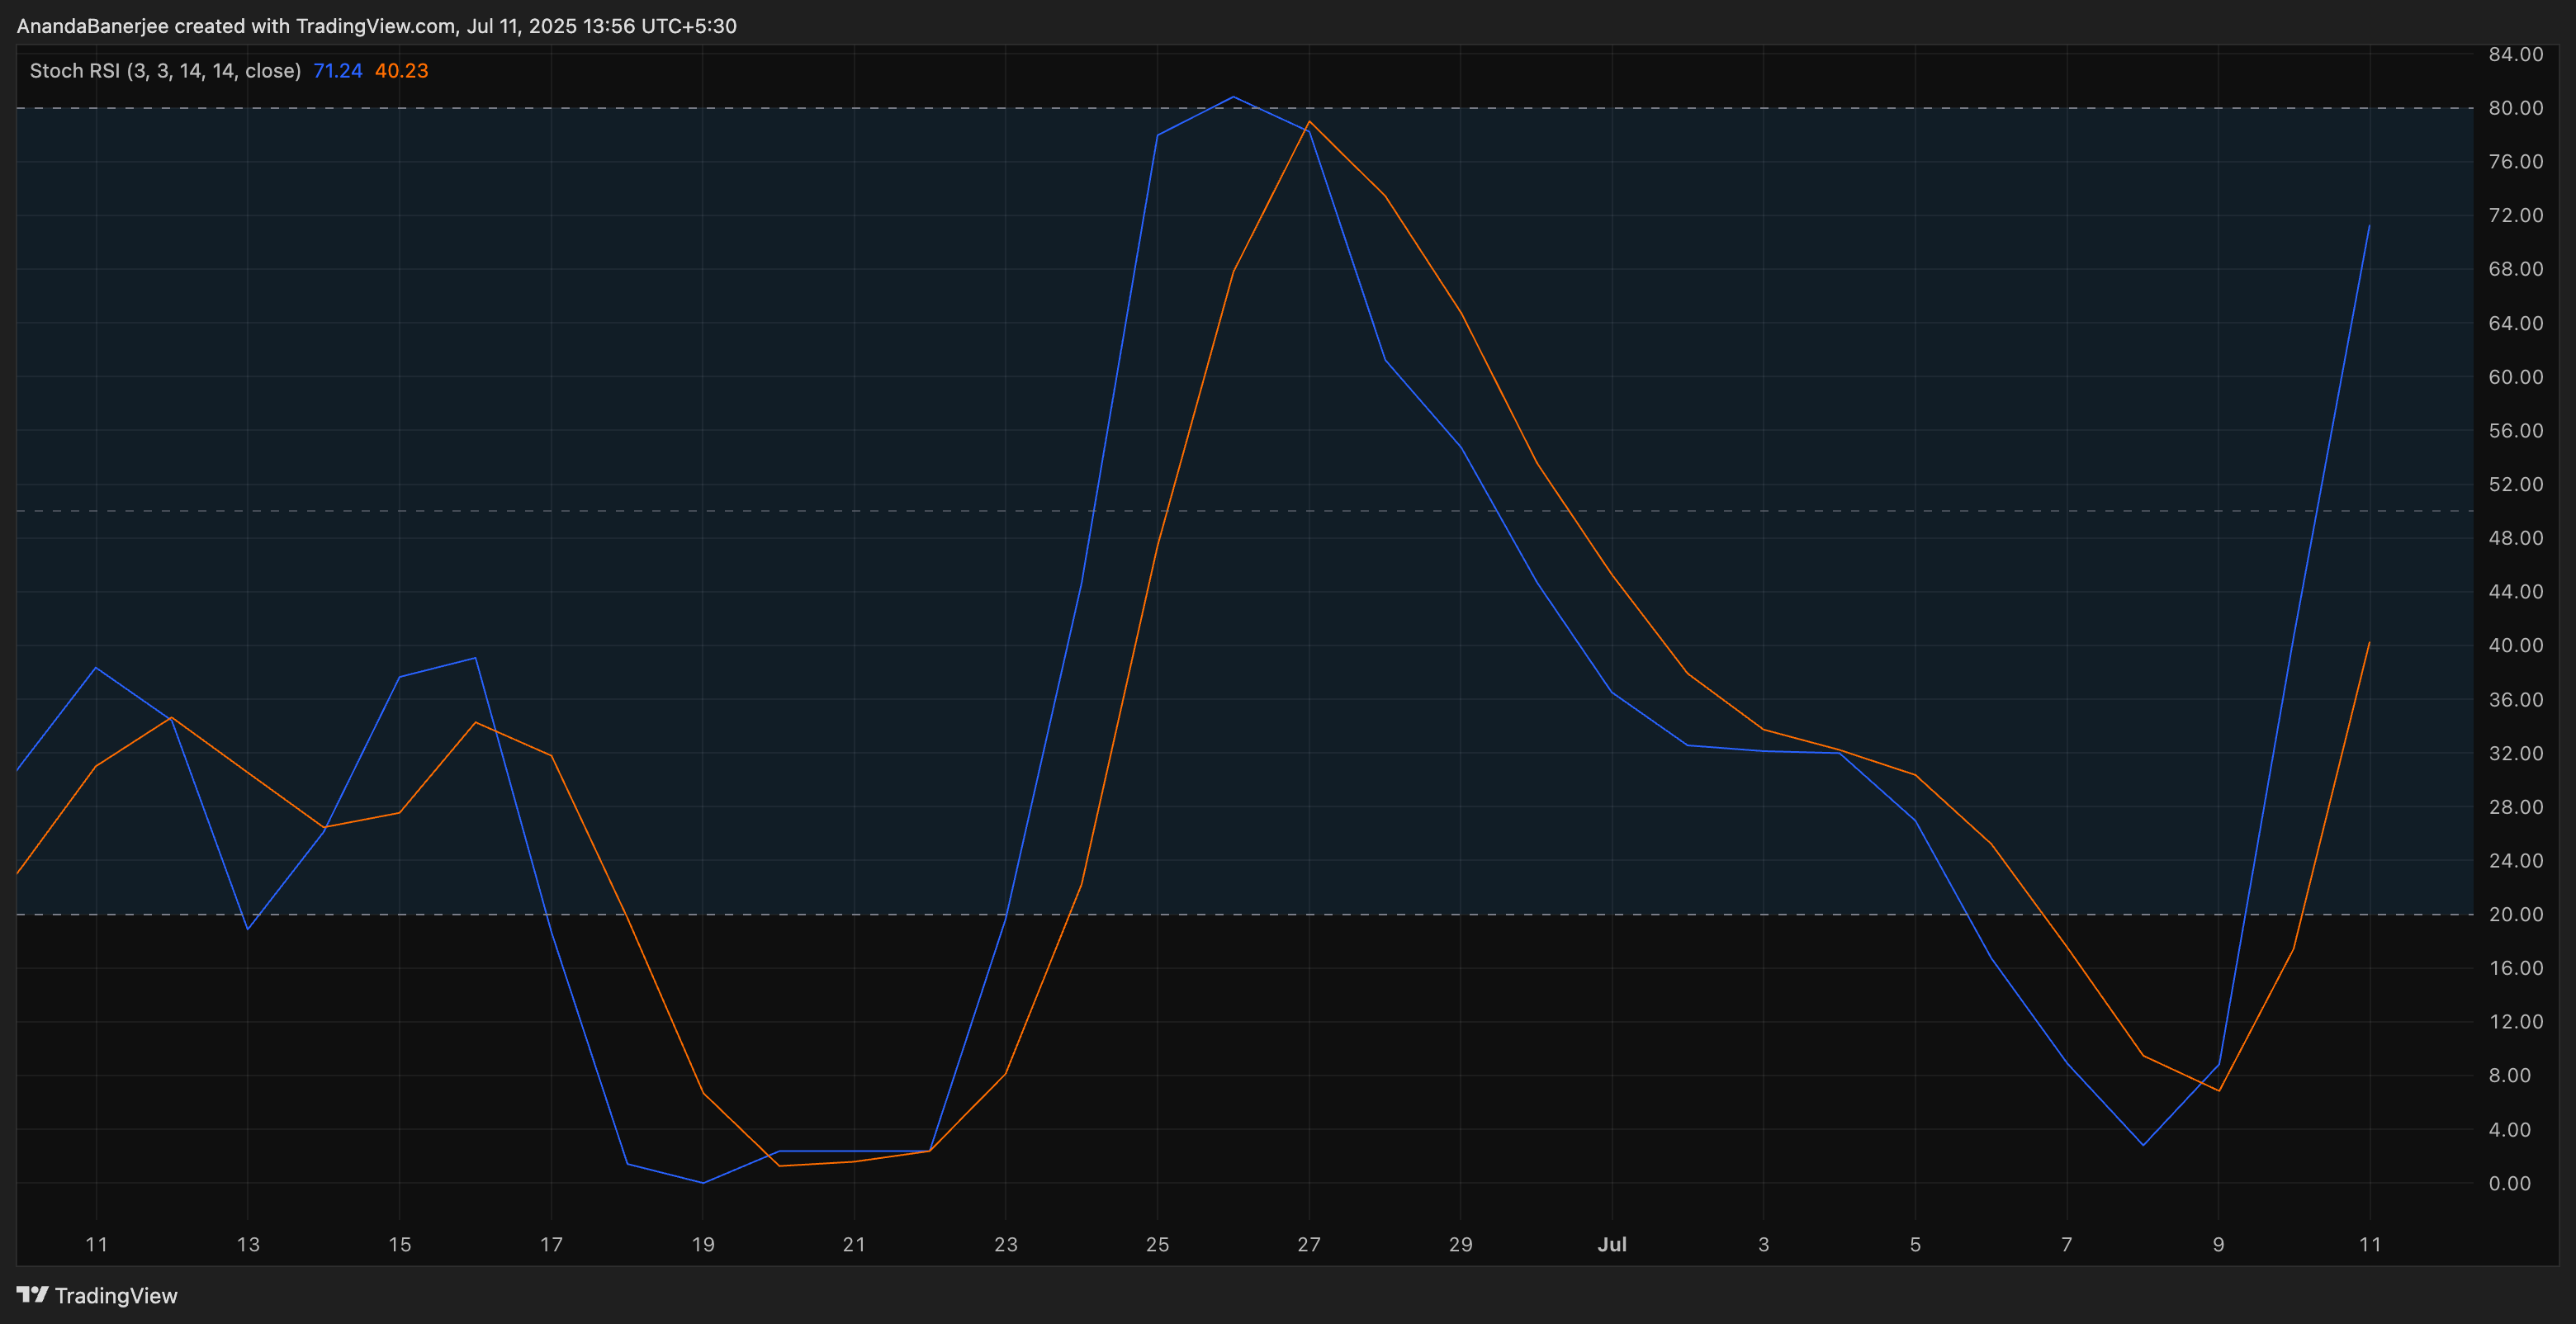
The Stochastic RSI—which shows how strong or weak an asset’s recent price movement is—currently has the blue line near 72 and the red line around 40. This widening gap suggests growing bullish momentum, as the faster-moving line is pulling away upward. For context, while RSI (Relative Strength Index) tracks how overbought or oversold a token is, Stochastic RSI goes a step deeper by measuring how fast RSI itself is changing—often used to catch early trend shifts.
PI Price Presses Into Resistance Zone
Price-wise, Pi price now flirts with a key resistance at $0.5026. This level, derived from the 0.618 Fibonacci retracement zone, has historically acted as both a cap and a trigger. If bulls manage to push cleanly past it, the next leg could eye the $0.54–$0.56 zone. However, if the price gets rejected again here, a pullback toward $0.4578 may occur.
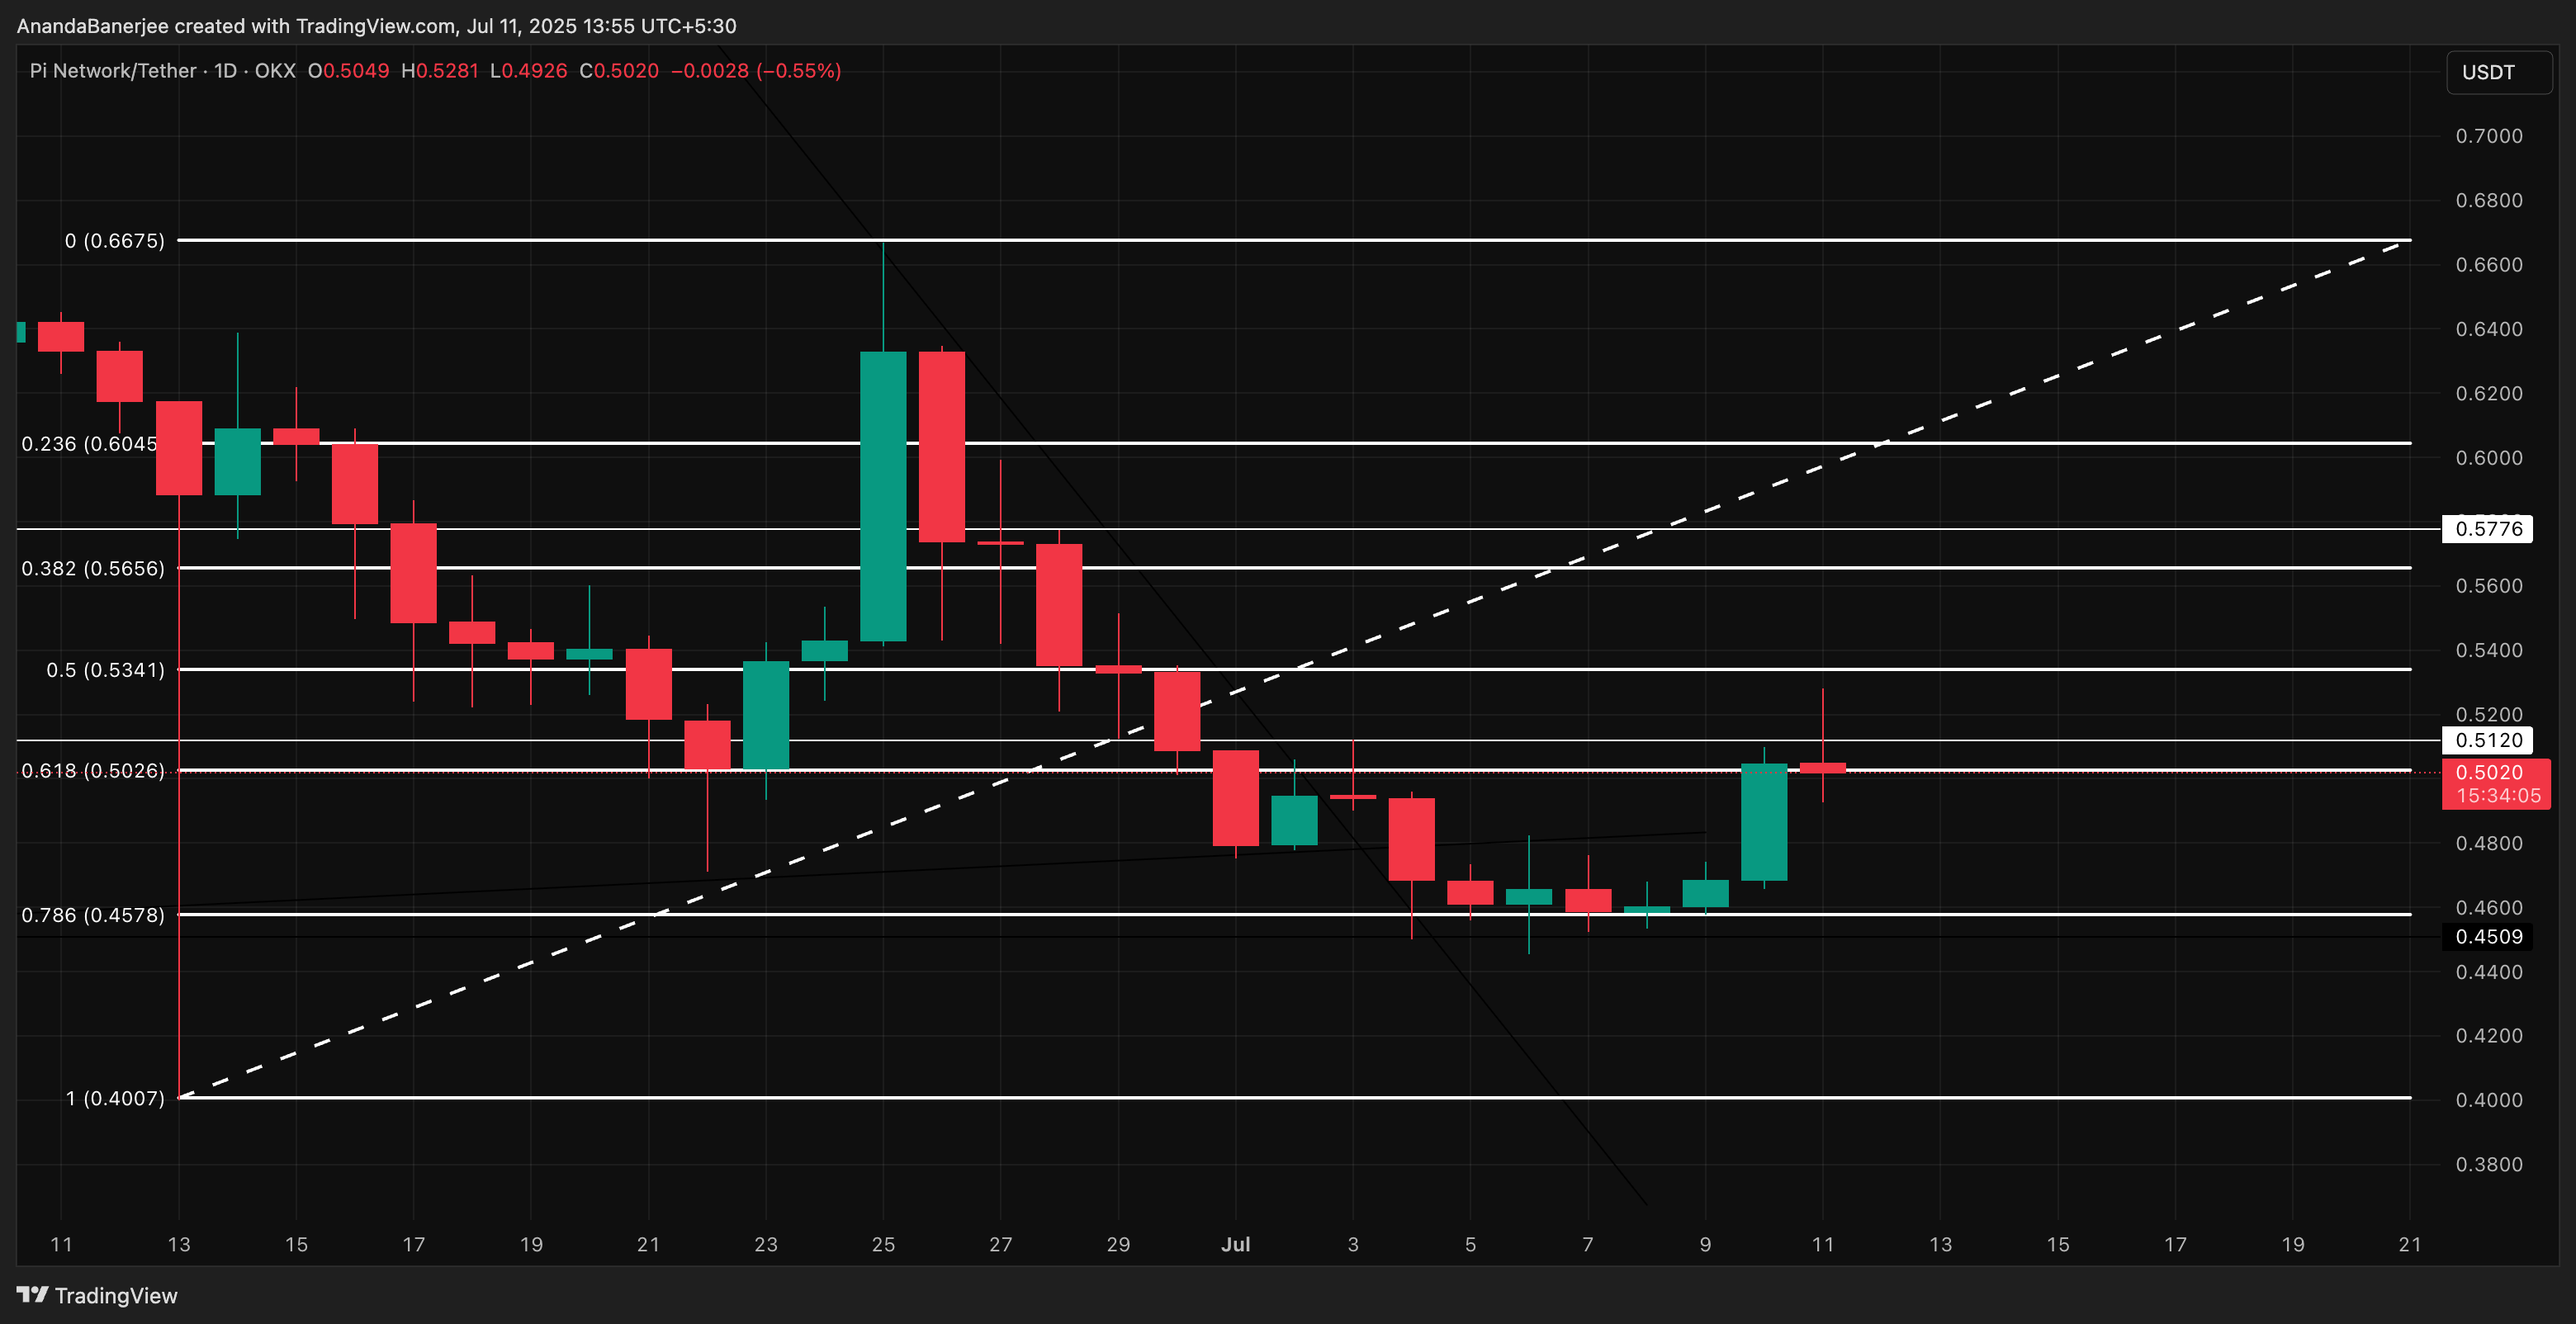
Currently, all three indicators —buying pressure, sentiment, and momentum — are pointing upward. As long as the PI price holds above $0.50 (psychological support zone), the trend appears intact. However, a failure to stay above that level could open the door back toward the $0.45-$0.40 base.
