Hedera Soars to 30-Day High — Why This Rally Could Be the Tip of the Iceberg
Hedera's native token defies market lethargy, punching through a 30-day high as institutional interest quietly stacks up. Forget 'buy the rumor'—this might be a 'buy the infrastructure' moment.
Behind the surge: whispers of enterprise adoption and a tokenomics overhaul. The network's council-based governance—often mocked as 'corporate blockchain'—suddenly looks like a stability feature when TradFi giants come knocking.
Technical breakout? Check. Fundamentals improving? Debatable. But in crypto, that's usually when the real fun starts. Just ask the hedge funds now scrambling to explain why they shorted 'the boring one.'
HBAR Volume Hits $373 Million, Long Positions Take the Lead
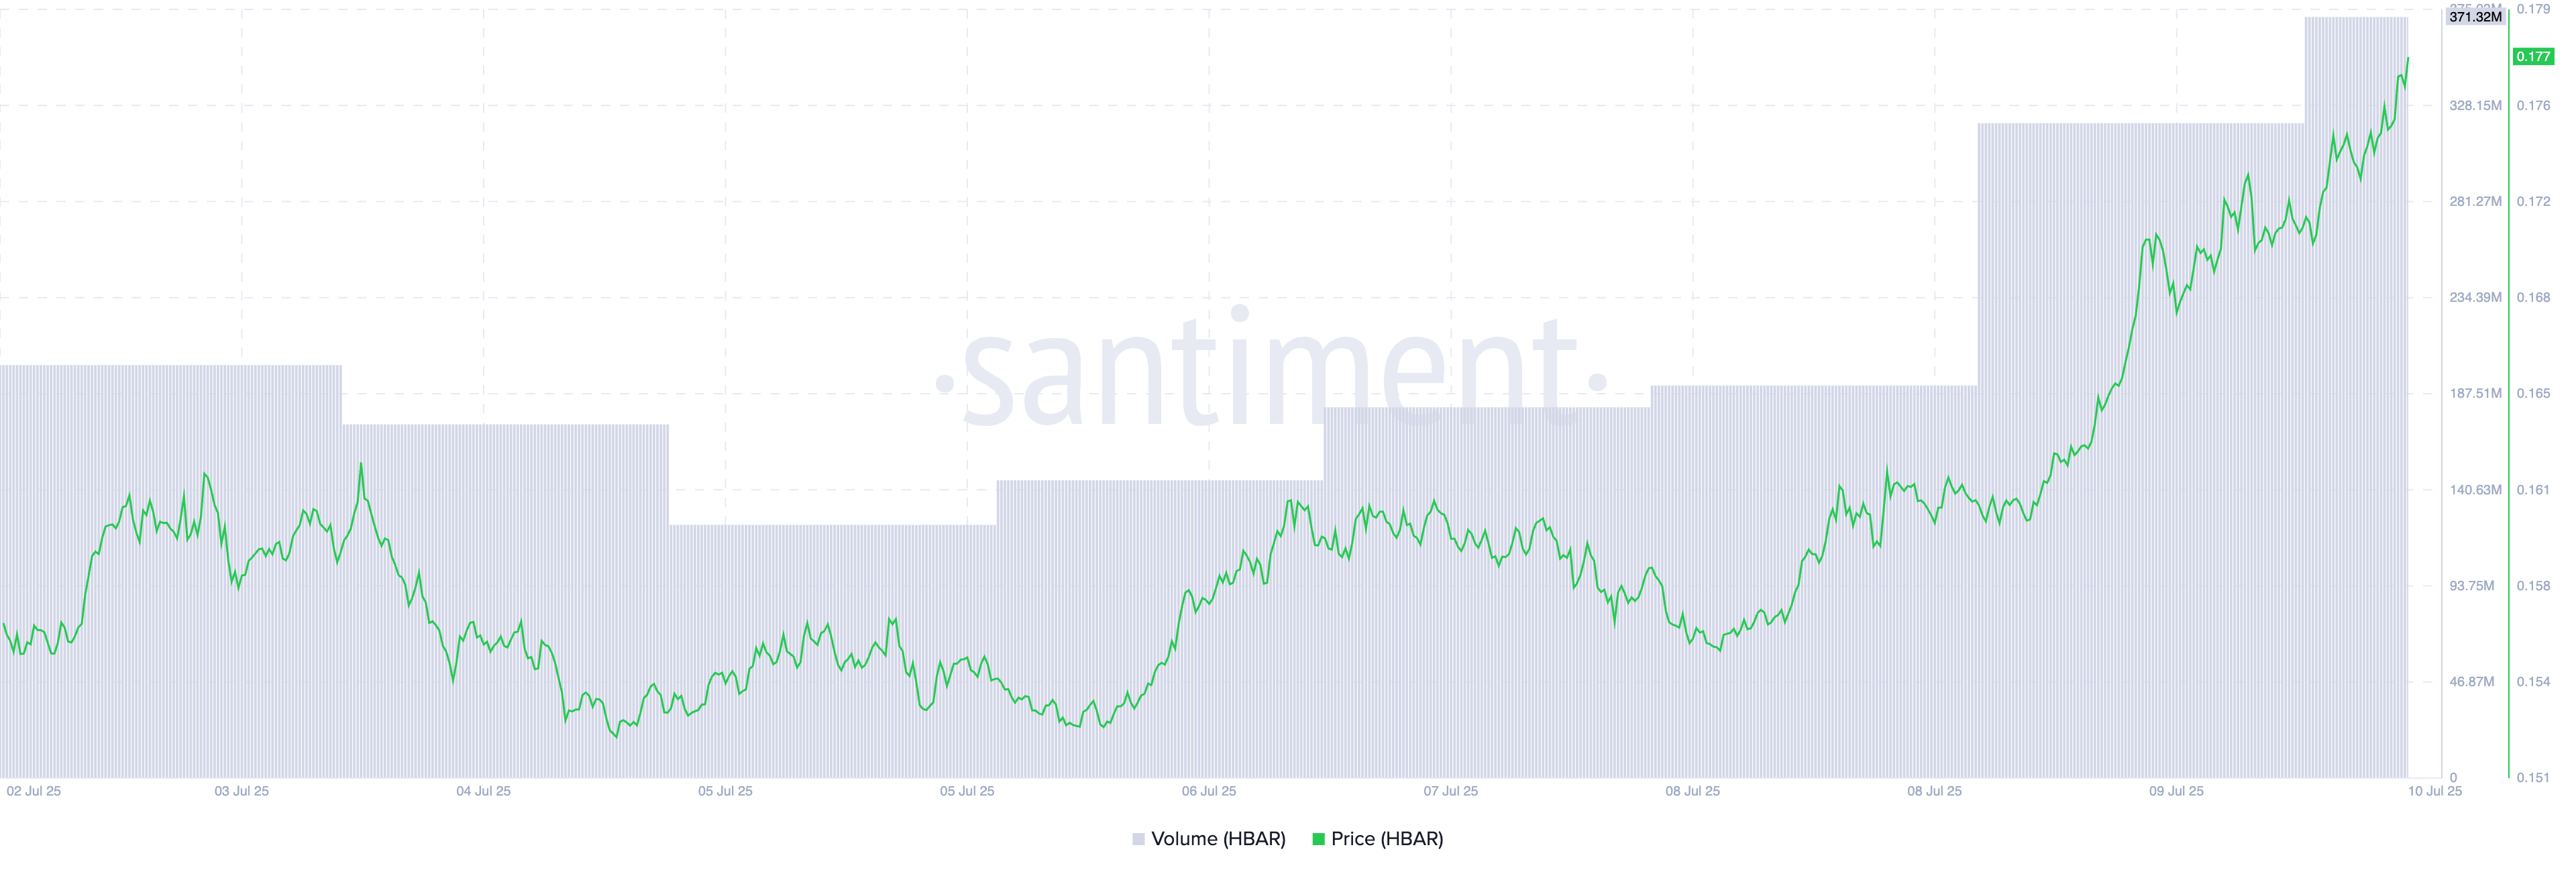
HBAR’s daily trading volume has climbed by almost 100%, reaching a 60-day high of $373 million at press time. This highlights the growing investor interest and reinforces the strength of the current uptrend.

When an asset’s price and trading volume climb simultaneously, it signals strong bullish momentum and growing investor confidence. Rising volume confirms that the price movement is backed by significant trading activity.
This, therefore, reduces the likelihood of a false breakout and suggests that buyers are actively driving the market.
For HBAR, its double-digit price surge—alongside a 60-day high in trading volume of $373 million—indicates that the recent rally is gaining traction. This convergence of price and volume strength supports the view that HBAR’s uptrend could continue in the NEAR term.
Moreover, the surge in HBAR’s price to a 30-day high has triggered a demand for long positions in its futures market. This is reflected by its long/short ratio, which sits at a 30-day high of 1.13 at press time.

This metric measures the proportion of bullish (long) positions to bearish (short) positions in an asset’s futures market. When the ratio is below one, traders are betting on a price decline rather than an increase.
It shows skepticism around the token’s short-term price outlook, as traders anticipate further downside movement.
Conversely, as with HBAR, when the ratio is above one, there are more long positions than short ones. This suggests bullish sentiment, with most traders expecting the asset’s value to rise.
Money Flow Into HBAR Surges — Price Faces Pivotal $0.189 Test
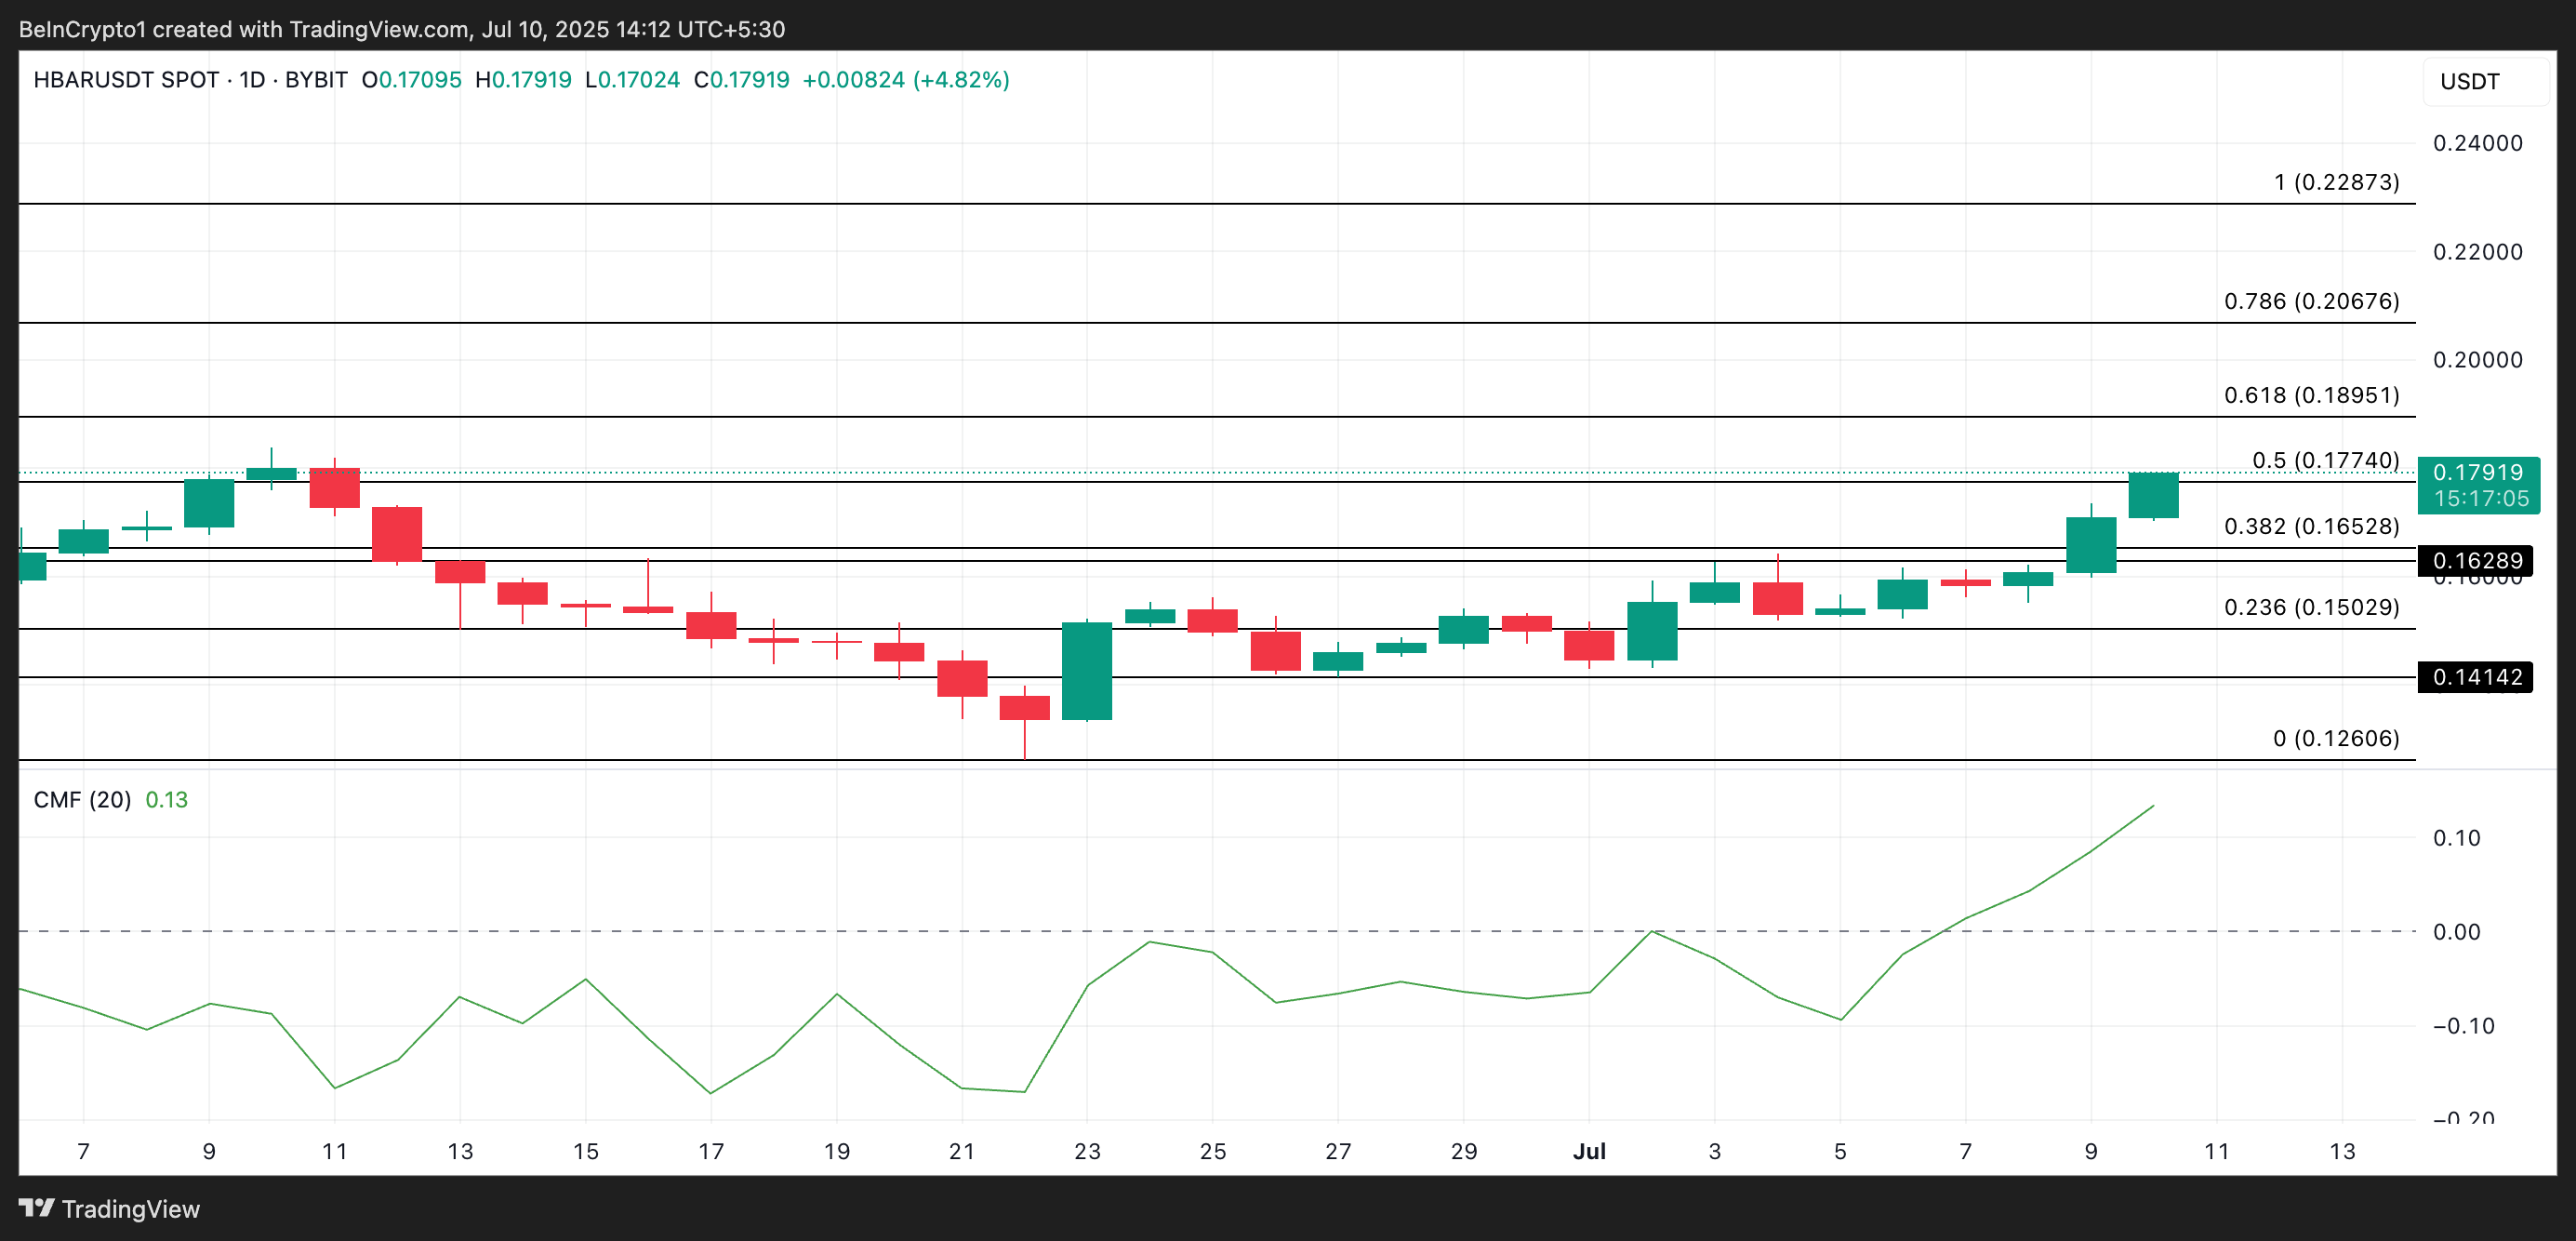
HBAR’s rising Chaikin Money FLOW (CMF) on the daily chart supports the bullish outlook above. This momentum indicator, which tracks how money flows into and out of the asset, is above the zero line at 0.13 and in an uptrend at press time.
Positive CMF readings during rally periods like this indicate that buying pressure outweighs selling pressure, with capital steadily flowing into the HBAR. This means investors are confident in its upward trend and are accumulating in the hopes of recording more gains.
If this continues, the token’s price could test resistance at $0.189. A successful breach of this price barrier could send HBAR to $0.206.

On the other hand, if the selling activity resumes, this bullish projection WOULD be invalidated. In that case, the token’s price could drop to $0.165.

