TIA Surges 20%—Will Bulls Smash Through $2 Barrier This Week?

TIA rockets to the top of the crypto leaderboard as bulls charge into a new week. The token's blistering 20% rally has traders whispering about a potential $2 breakout—but can the momentum hold?
Market Pulse: Green Dominance
While legacy markets yawn over another 0.25% Fed rate hike, TIA's vertical move proves crypto still writes the best volatility porn. The asset now flirts with its February highs, leaving bagholders from last quarter's correction suddenly interested again.
Technical Take: The $2 Litmus Test
All eyes on that psychological $2 level—a clean break could trigger algorithmic buying frenzies. Though let's be real: half the 'technical analysts' tweeting charts couldn't identify support if it slapped them with a ledger wallet.
Closing Thought: In a market where 'fundamentals' mean whatever narrative pumps your bags, TIA's price action speaks louder than any whitepaper. Just don't remind anyone what happened the last time everyone chanted 'number go up'.
Strong Spot Demand Sends TIA Soaring
With today’s trading session already underway, TIA’s Elder-Ray Index has posted a green histogram bar, indicating mounting buying pressure in the market. As of this writing, this indicator, which tracks the strength of buyers and sellers, is at 0.150, its highest value since May 14.
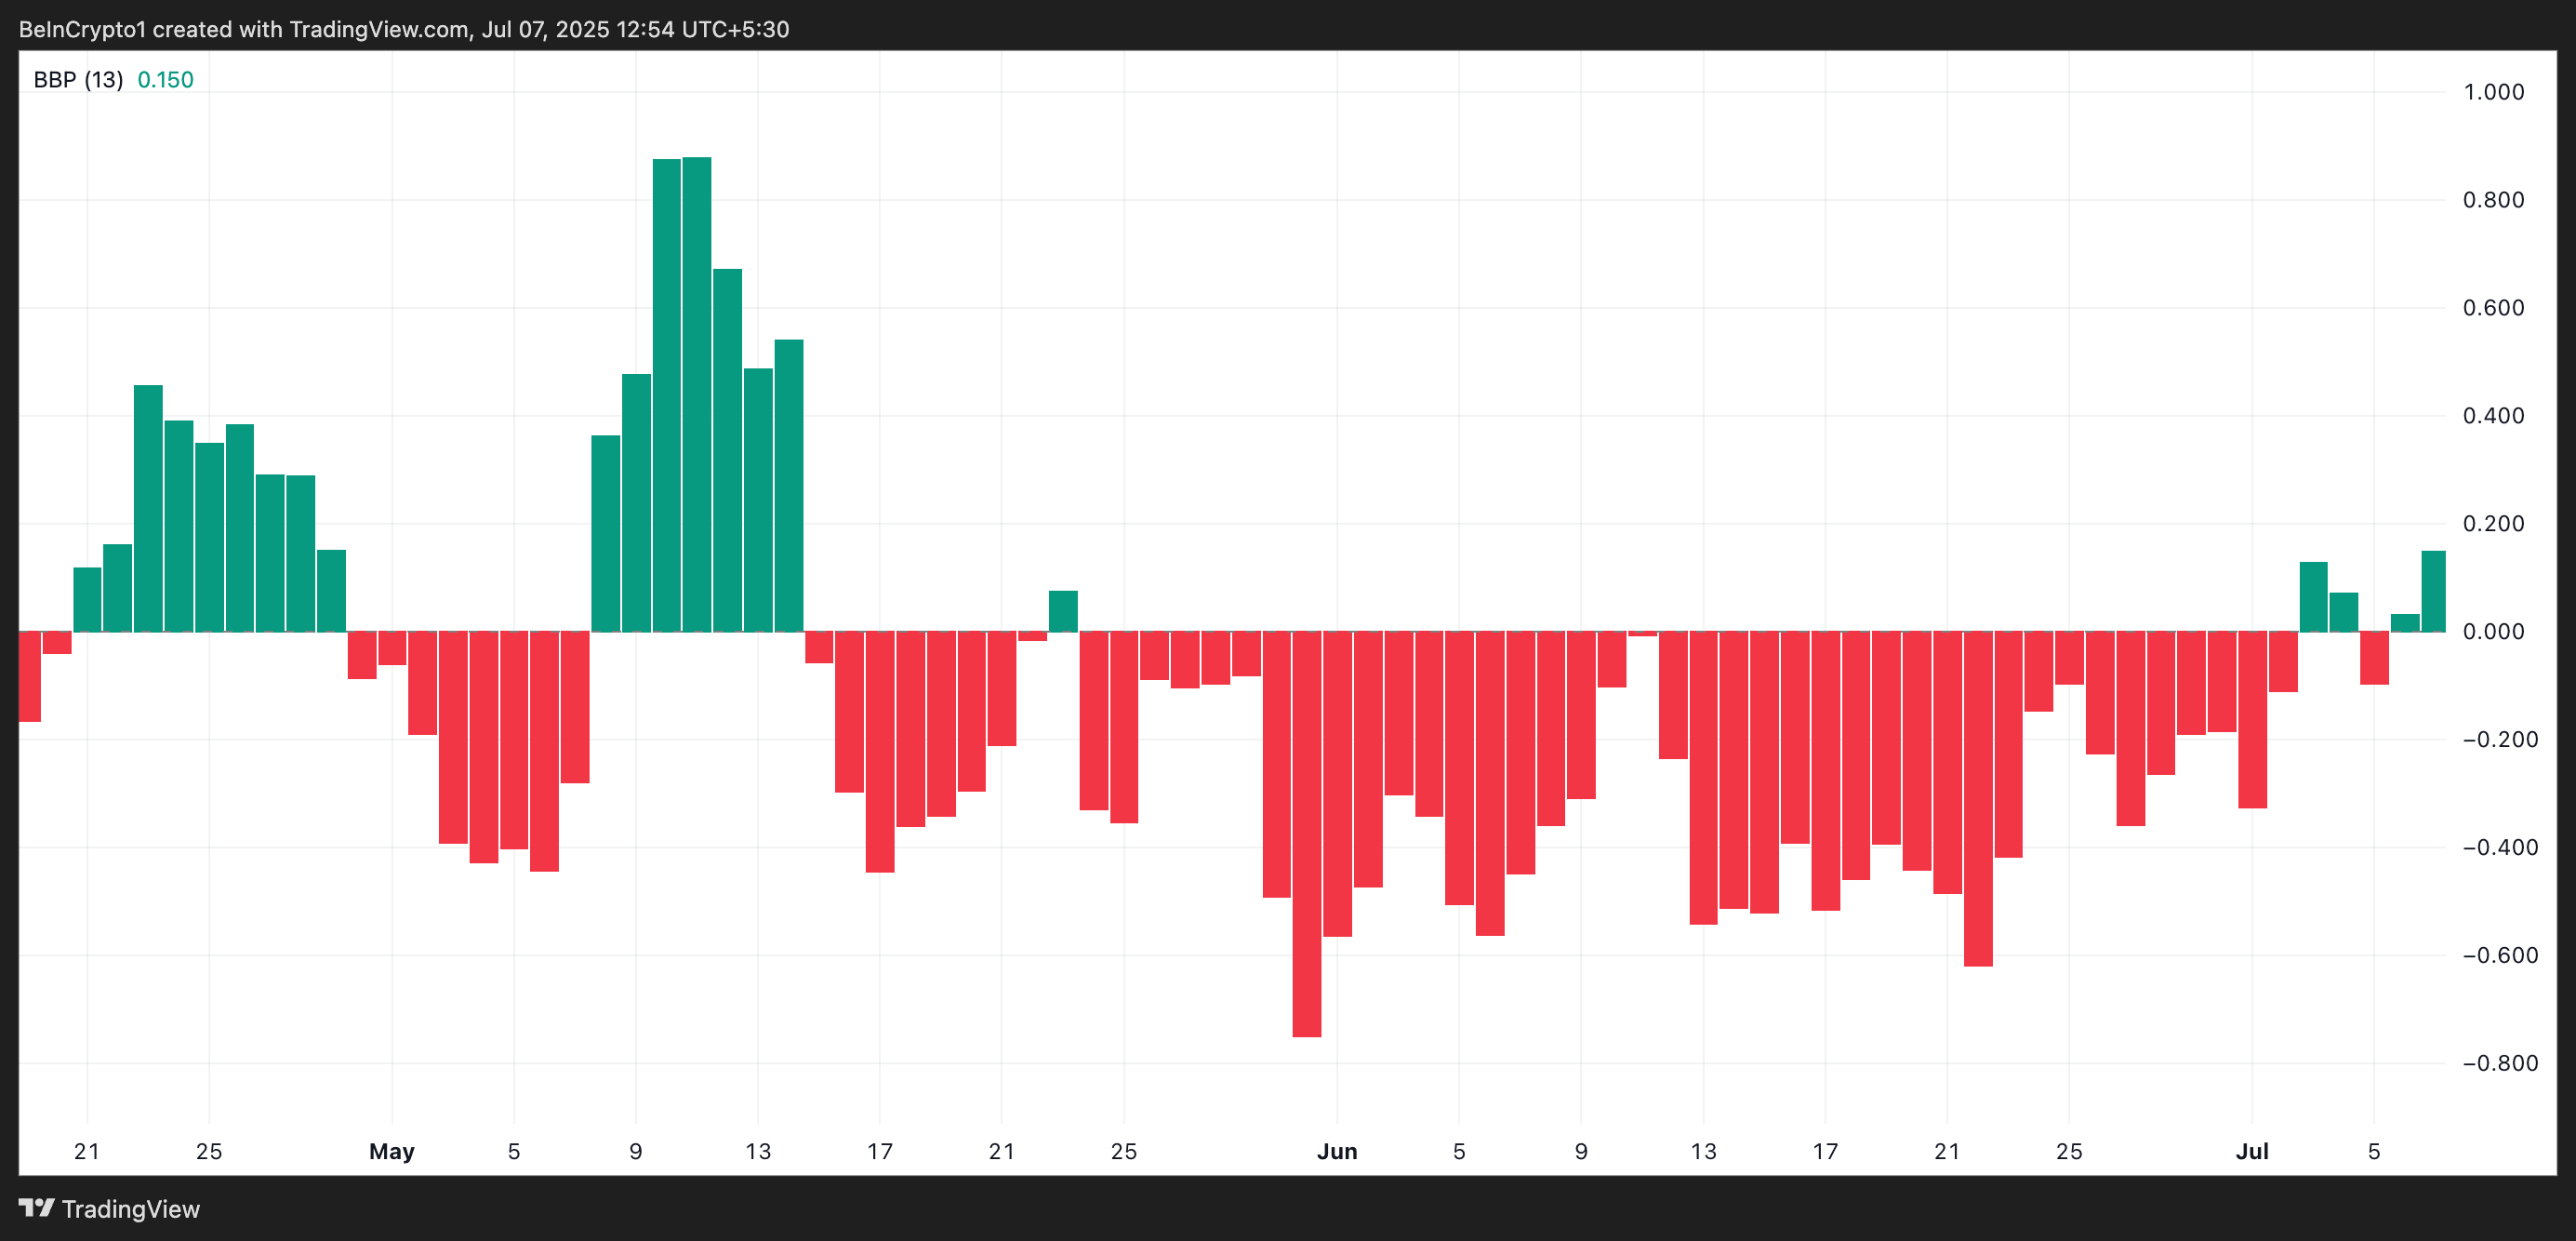
The Elder-Ray Index measures the strength of buyers and sellers by comparing current prices with an exponential moving average (EMA). When its value is positive, bulls (buyers) dominate the market, and there’s upward pressure on the asset’s price.
Traders view this as a bullish signal and could prompt them to accumulate more TIA coins, increasing the upward pressure on its price.
Further, readings from TIA’s Parabolic Stop and Reverse (SAR) indicator show that it has now formed dynamic support below the coin’s current price level. While TIA trades at $1.64, the indicator forms a support floor for its price at $1.42, indicating sustained interest from buyers.
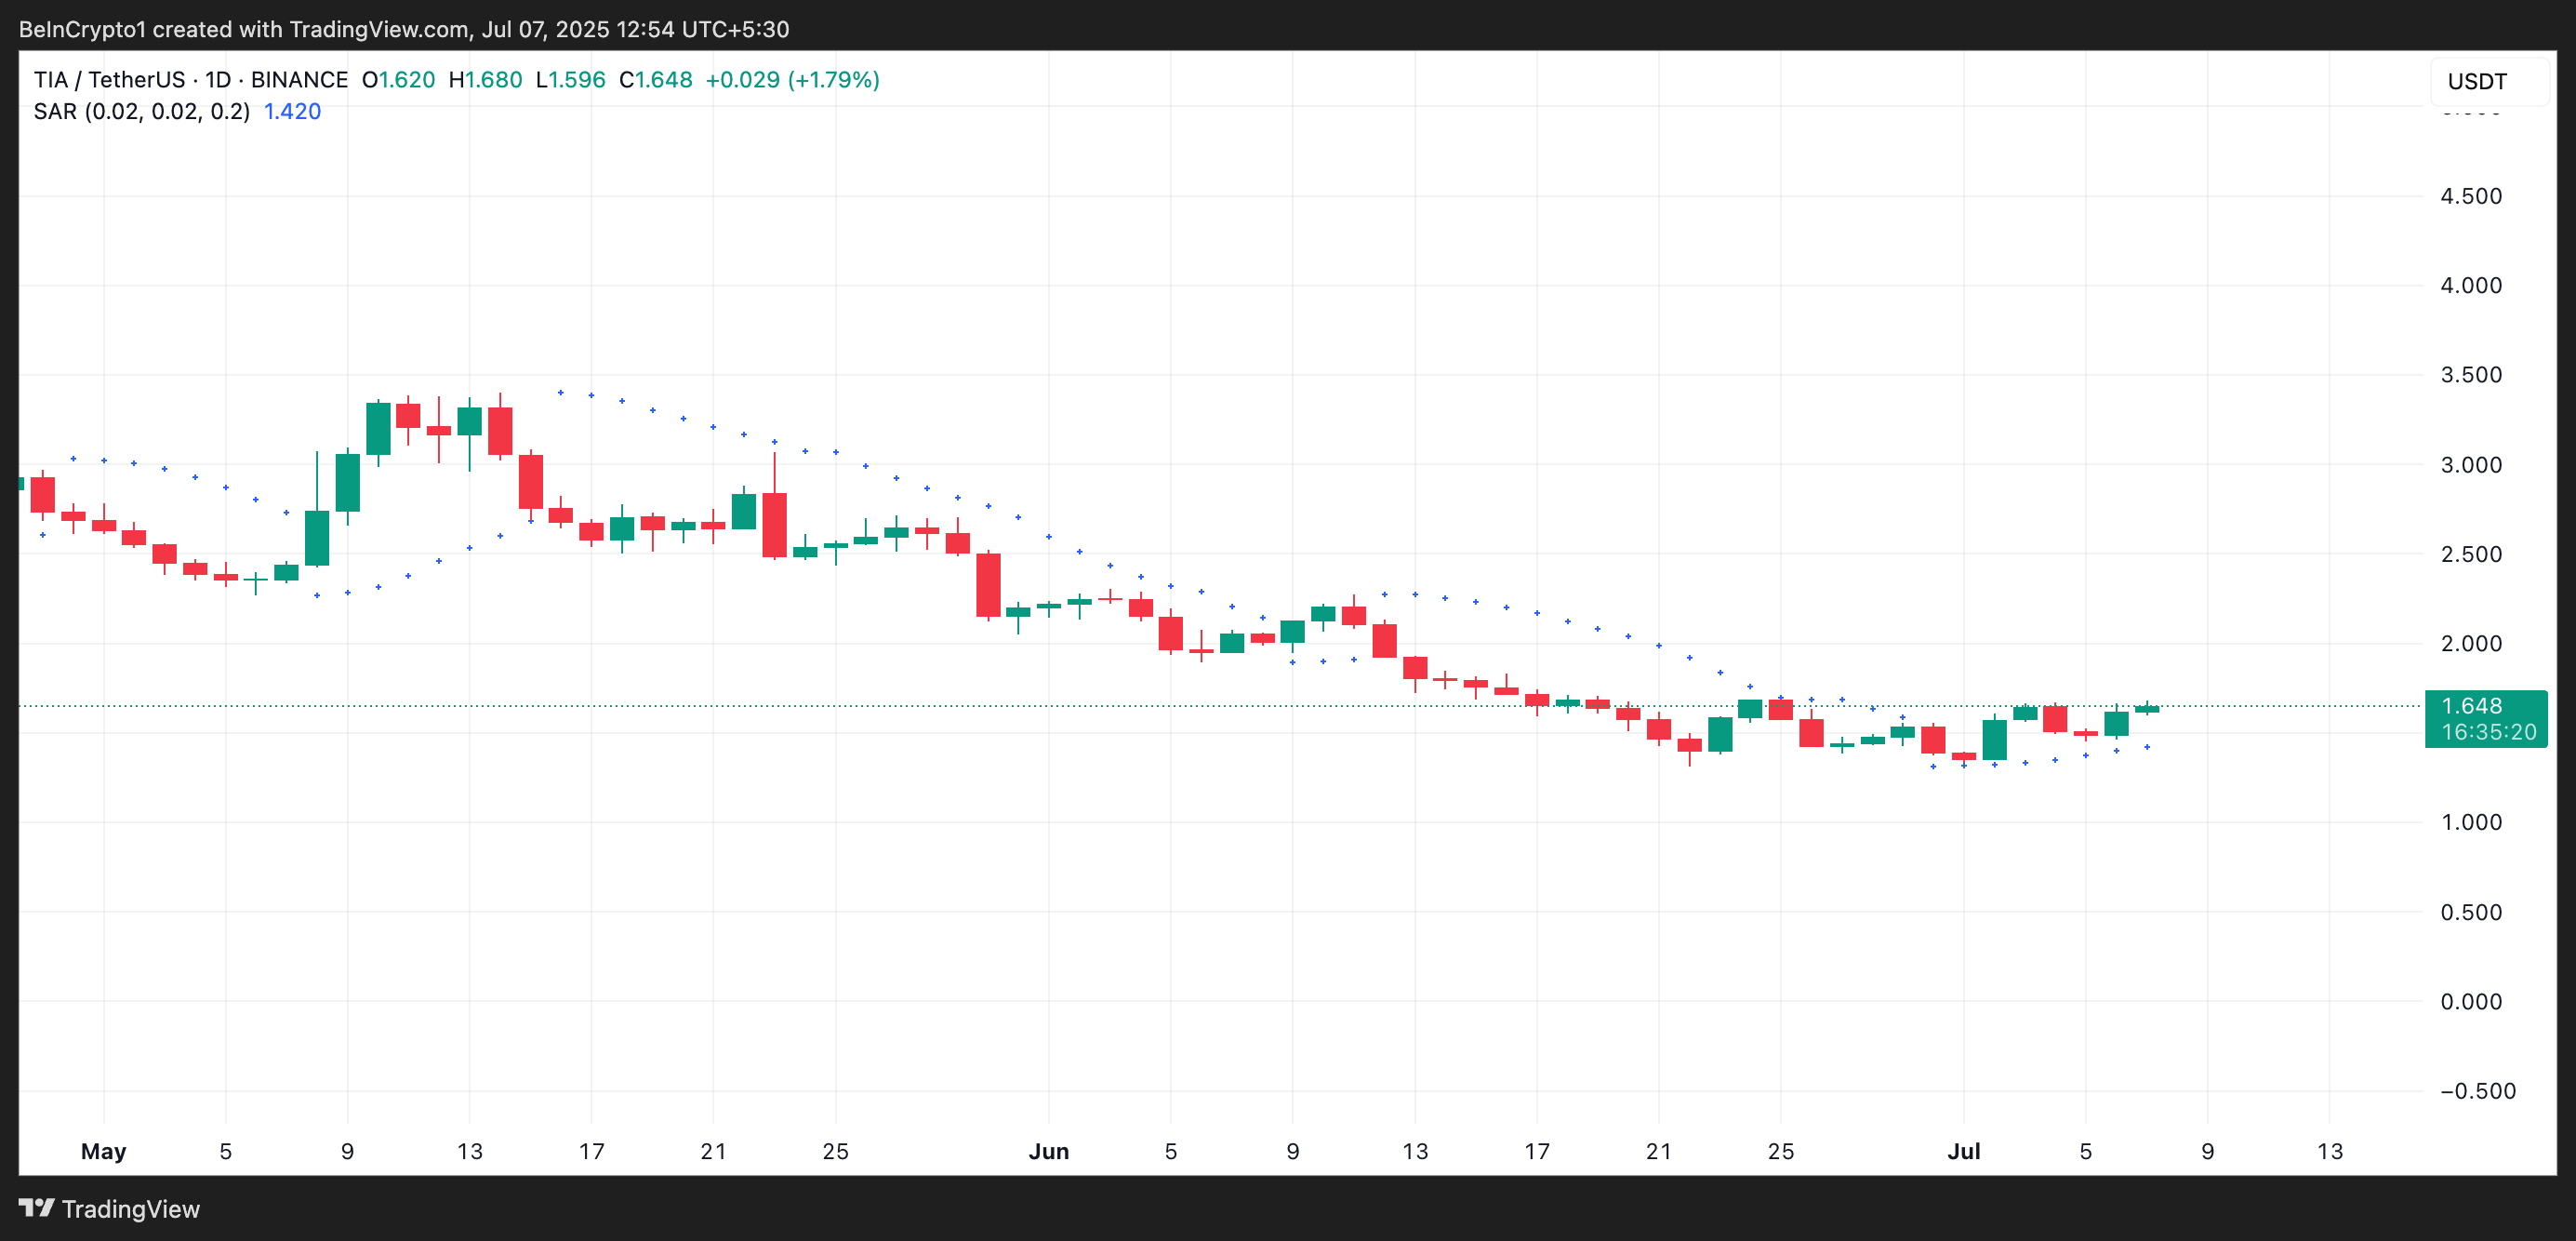
An asset’s Parabolic SAR indicator identifies potential trend direction and reversals. When its dots are placed under an asset’s price, it indicates it is witnessing bullish momentum, and its price could continue to rally if buying persists.
TIA Bulls Target $2 as Momentum Builds—But Risks Linger
With upward momentum building, TIA could reclaim the key psychological level of $2 soon if the current trend holds. A break above the $2 price level could pave the way for a further rally toward $2.27.
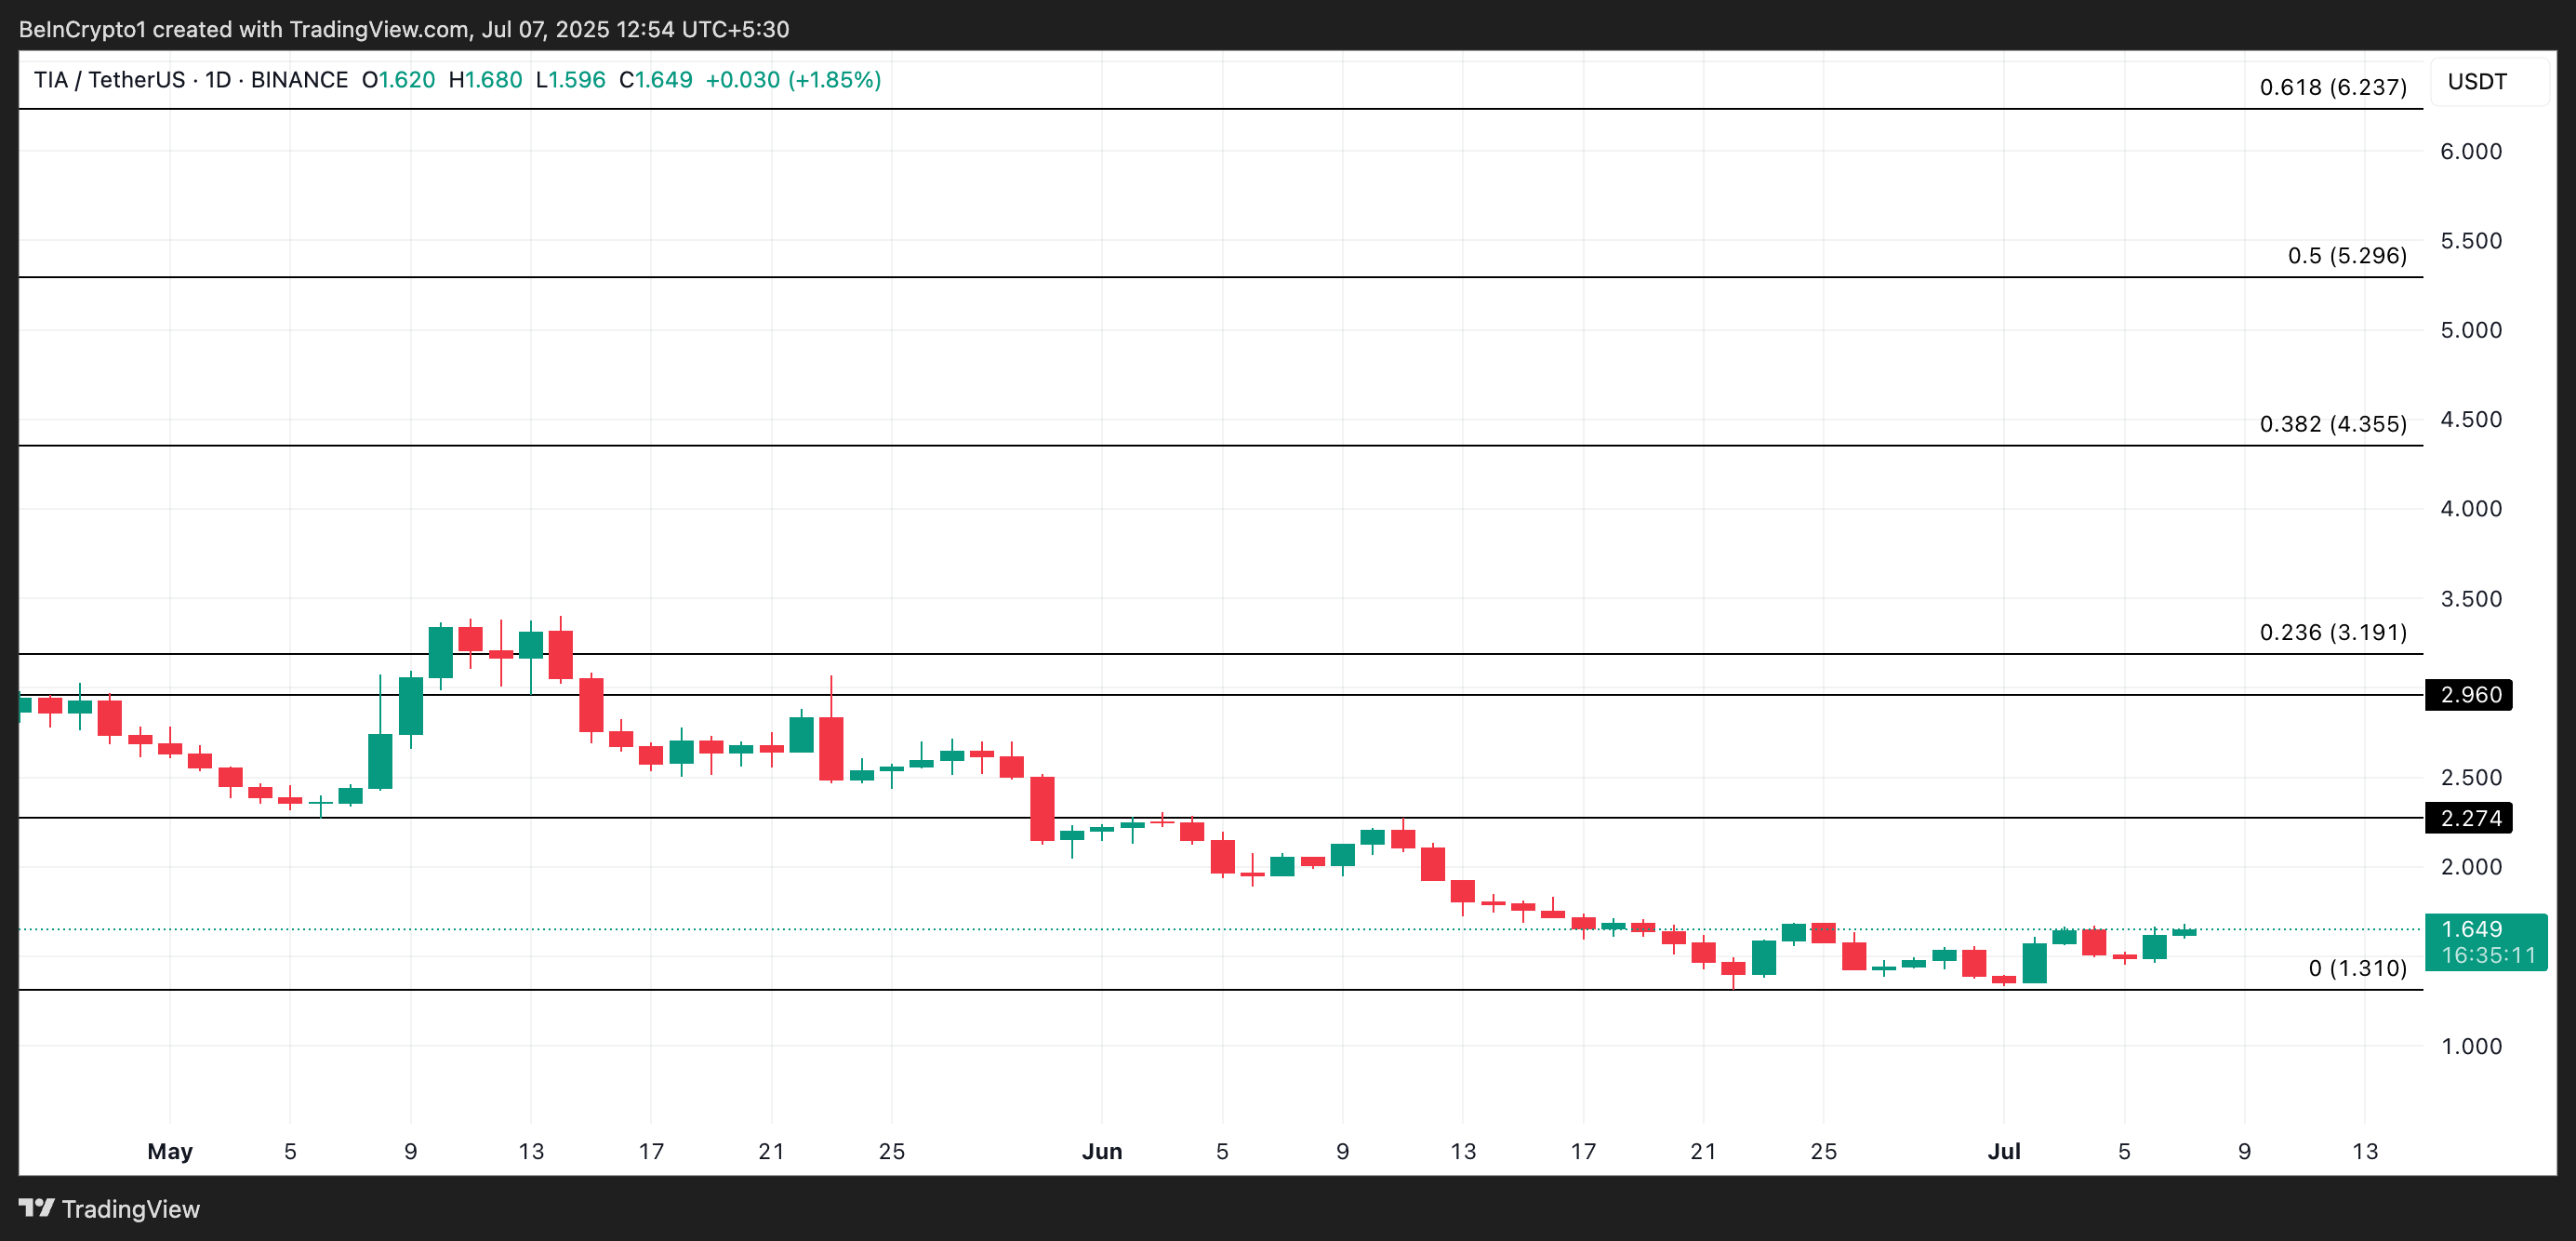
However, a bearish shift in market sentiment could invalidate this bullish outlook. If selling pressure climbs and demand dips, TIA could shed recent gains and plummet to $1.31.
