PI Coin Nearing All-Time Low? Chart Signals Point to a Critical Week Ahead

PI Coin teeters on the edge—will this week seal its fate or spark a rebound?
The Breakdown: Technical indicators flash warning signs as PI Coin flirts with historic lows. No sugarcoating—this is make-or-break territory.
Why It Matters: Another 'fundamentals don't matter' crypto story gets stress-tested. Traders are either licking their wounds or circling like vultures.
Bottom Line: Whether it's capitulation or contrarian opportunity depends on your risk appetite—and how much you enjoy gambling with charts that sometimes move like they’re powered by a Magic 8-Ball.
PI Sell-Off Deepens as Bullish Momentum Weakens
PI’s Accumulation/Distribution (A/D) Line has taken a dive over the past two weeks, signaling a significant drop in buying volume and waning investor confidence. As of this writing, the metric is at -300.73 million, falling 82% since June 25.
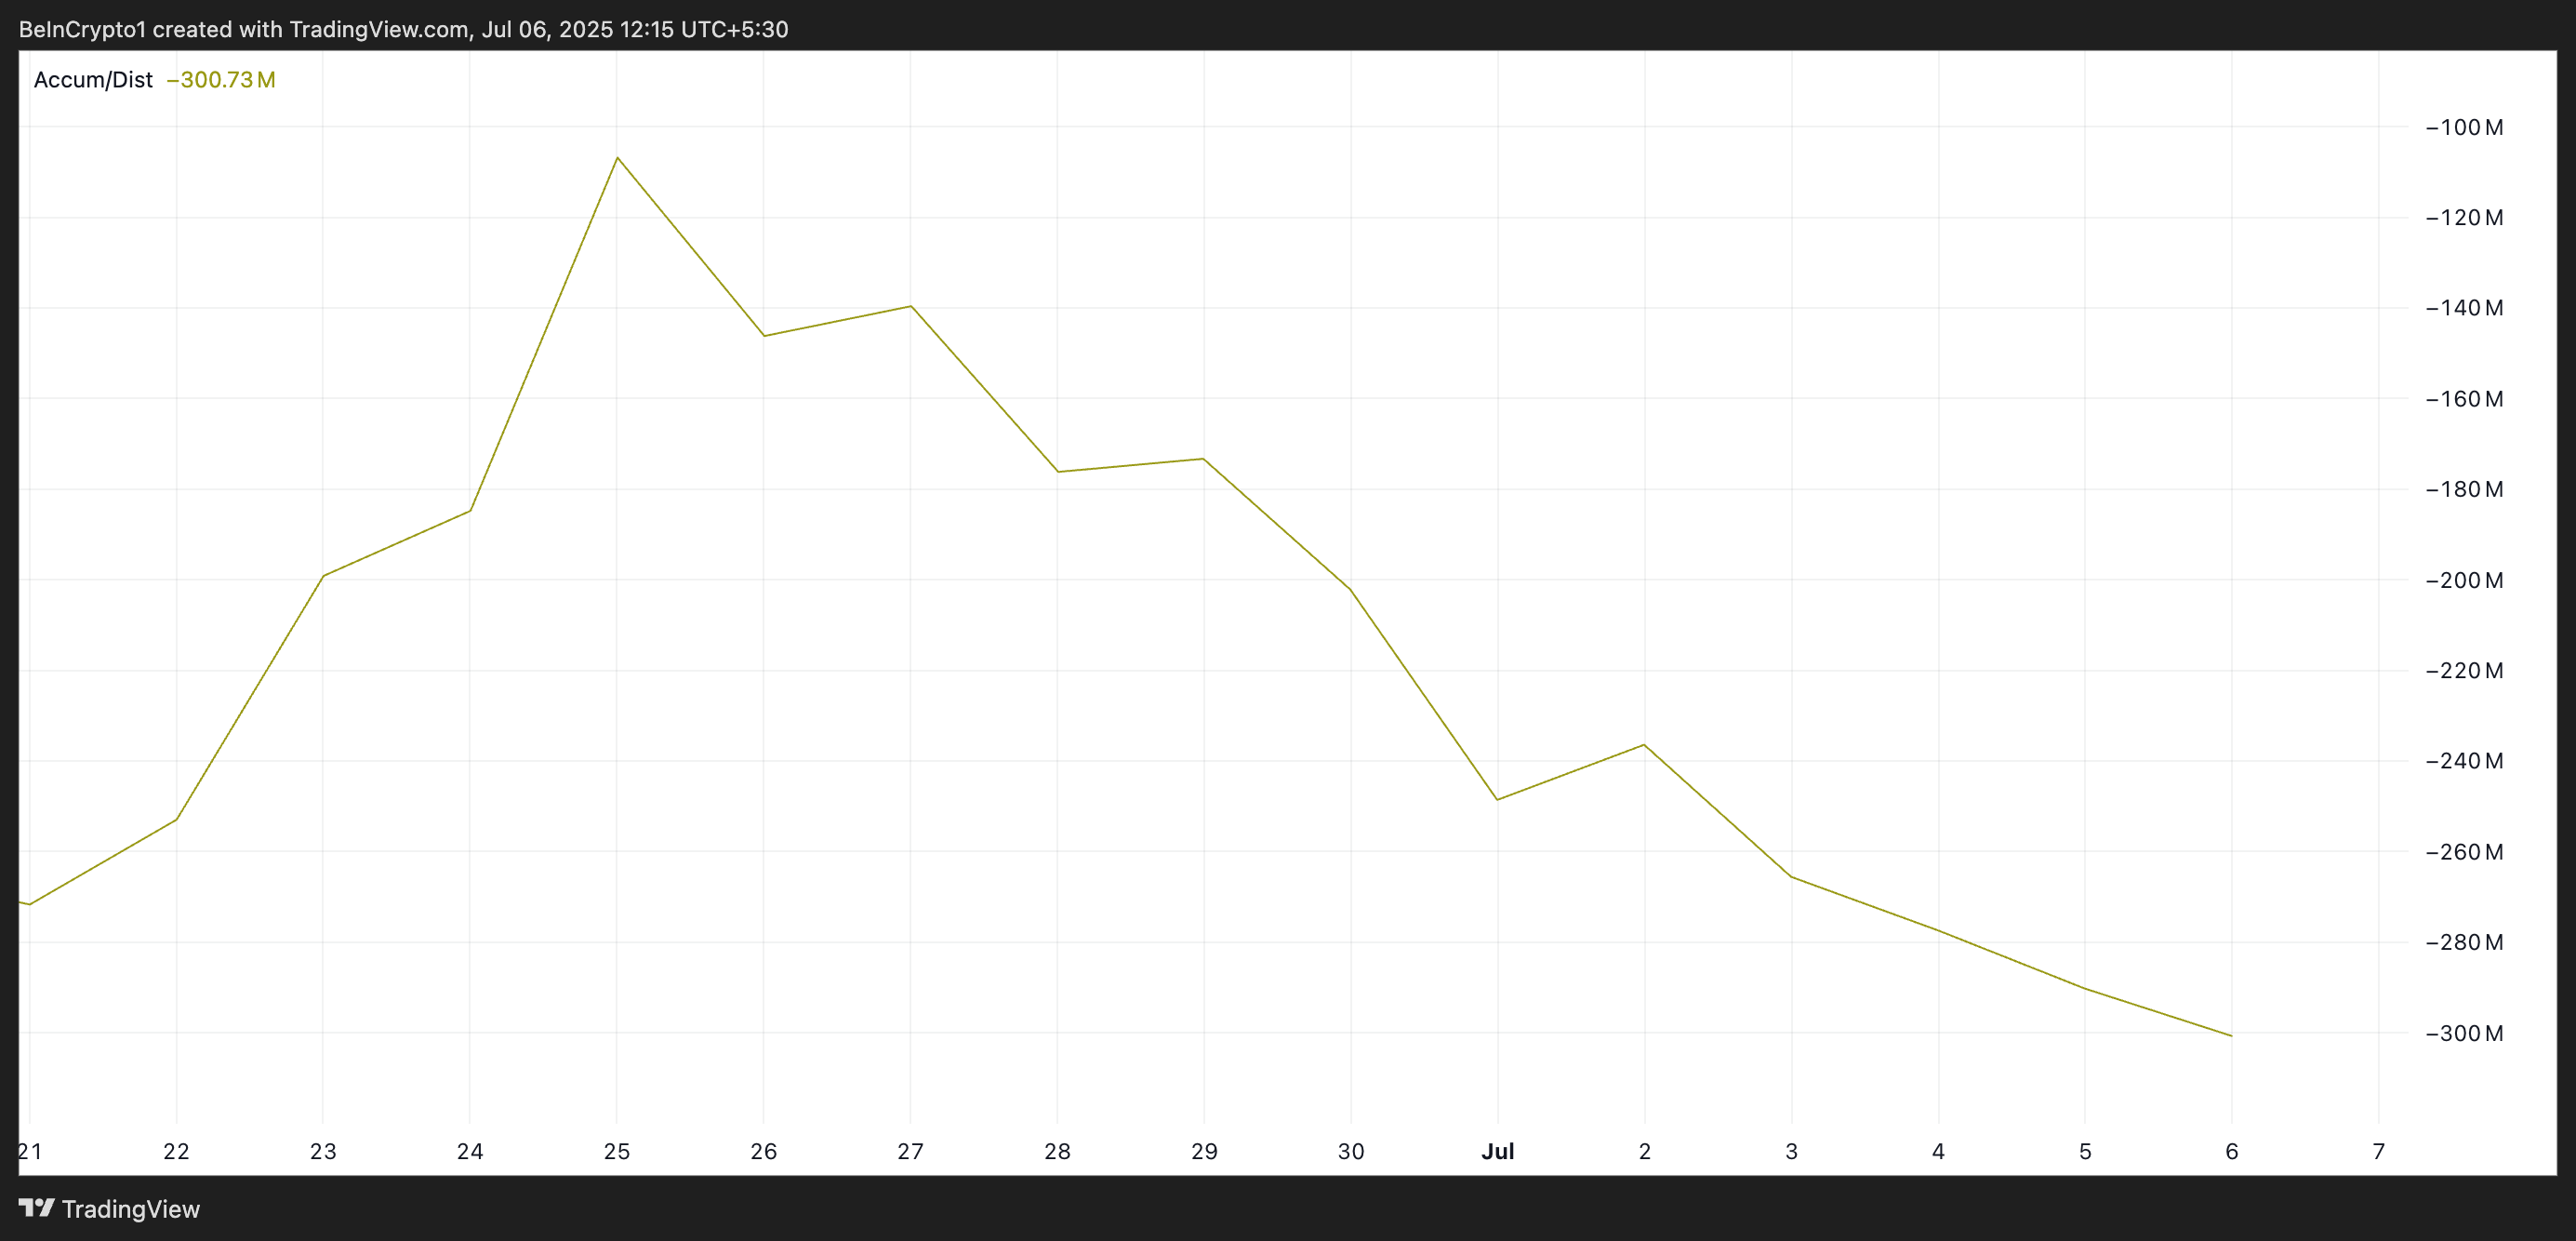
The A/D line measures an asset’s buying and selling pressure by analyzing its price movements and trading volume. When it climbs, it indicates strong accumulation, meaning buyers are driving demand and pushing prices higher.
On the other hand, as seen with PI, a falling A/D Line suggests that selling pressure outweighs buying interest. It indicates that traders are offloading PI rather than accumulating it, a sign of weakening confidence in the token’s short-term recovery prospects.
Furthermore, the setup of PI’s Directional Movement Index (DMI) aligns with this bearish narrative. The token’s positive directional index (+DI, blue) currently rests below the negative directional index (-DI, orange), showing a strengthening negative trend.
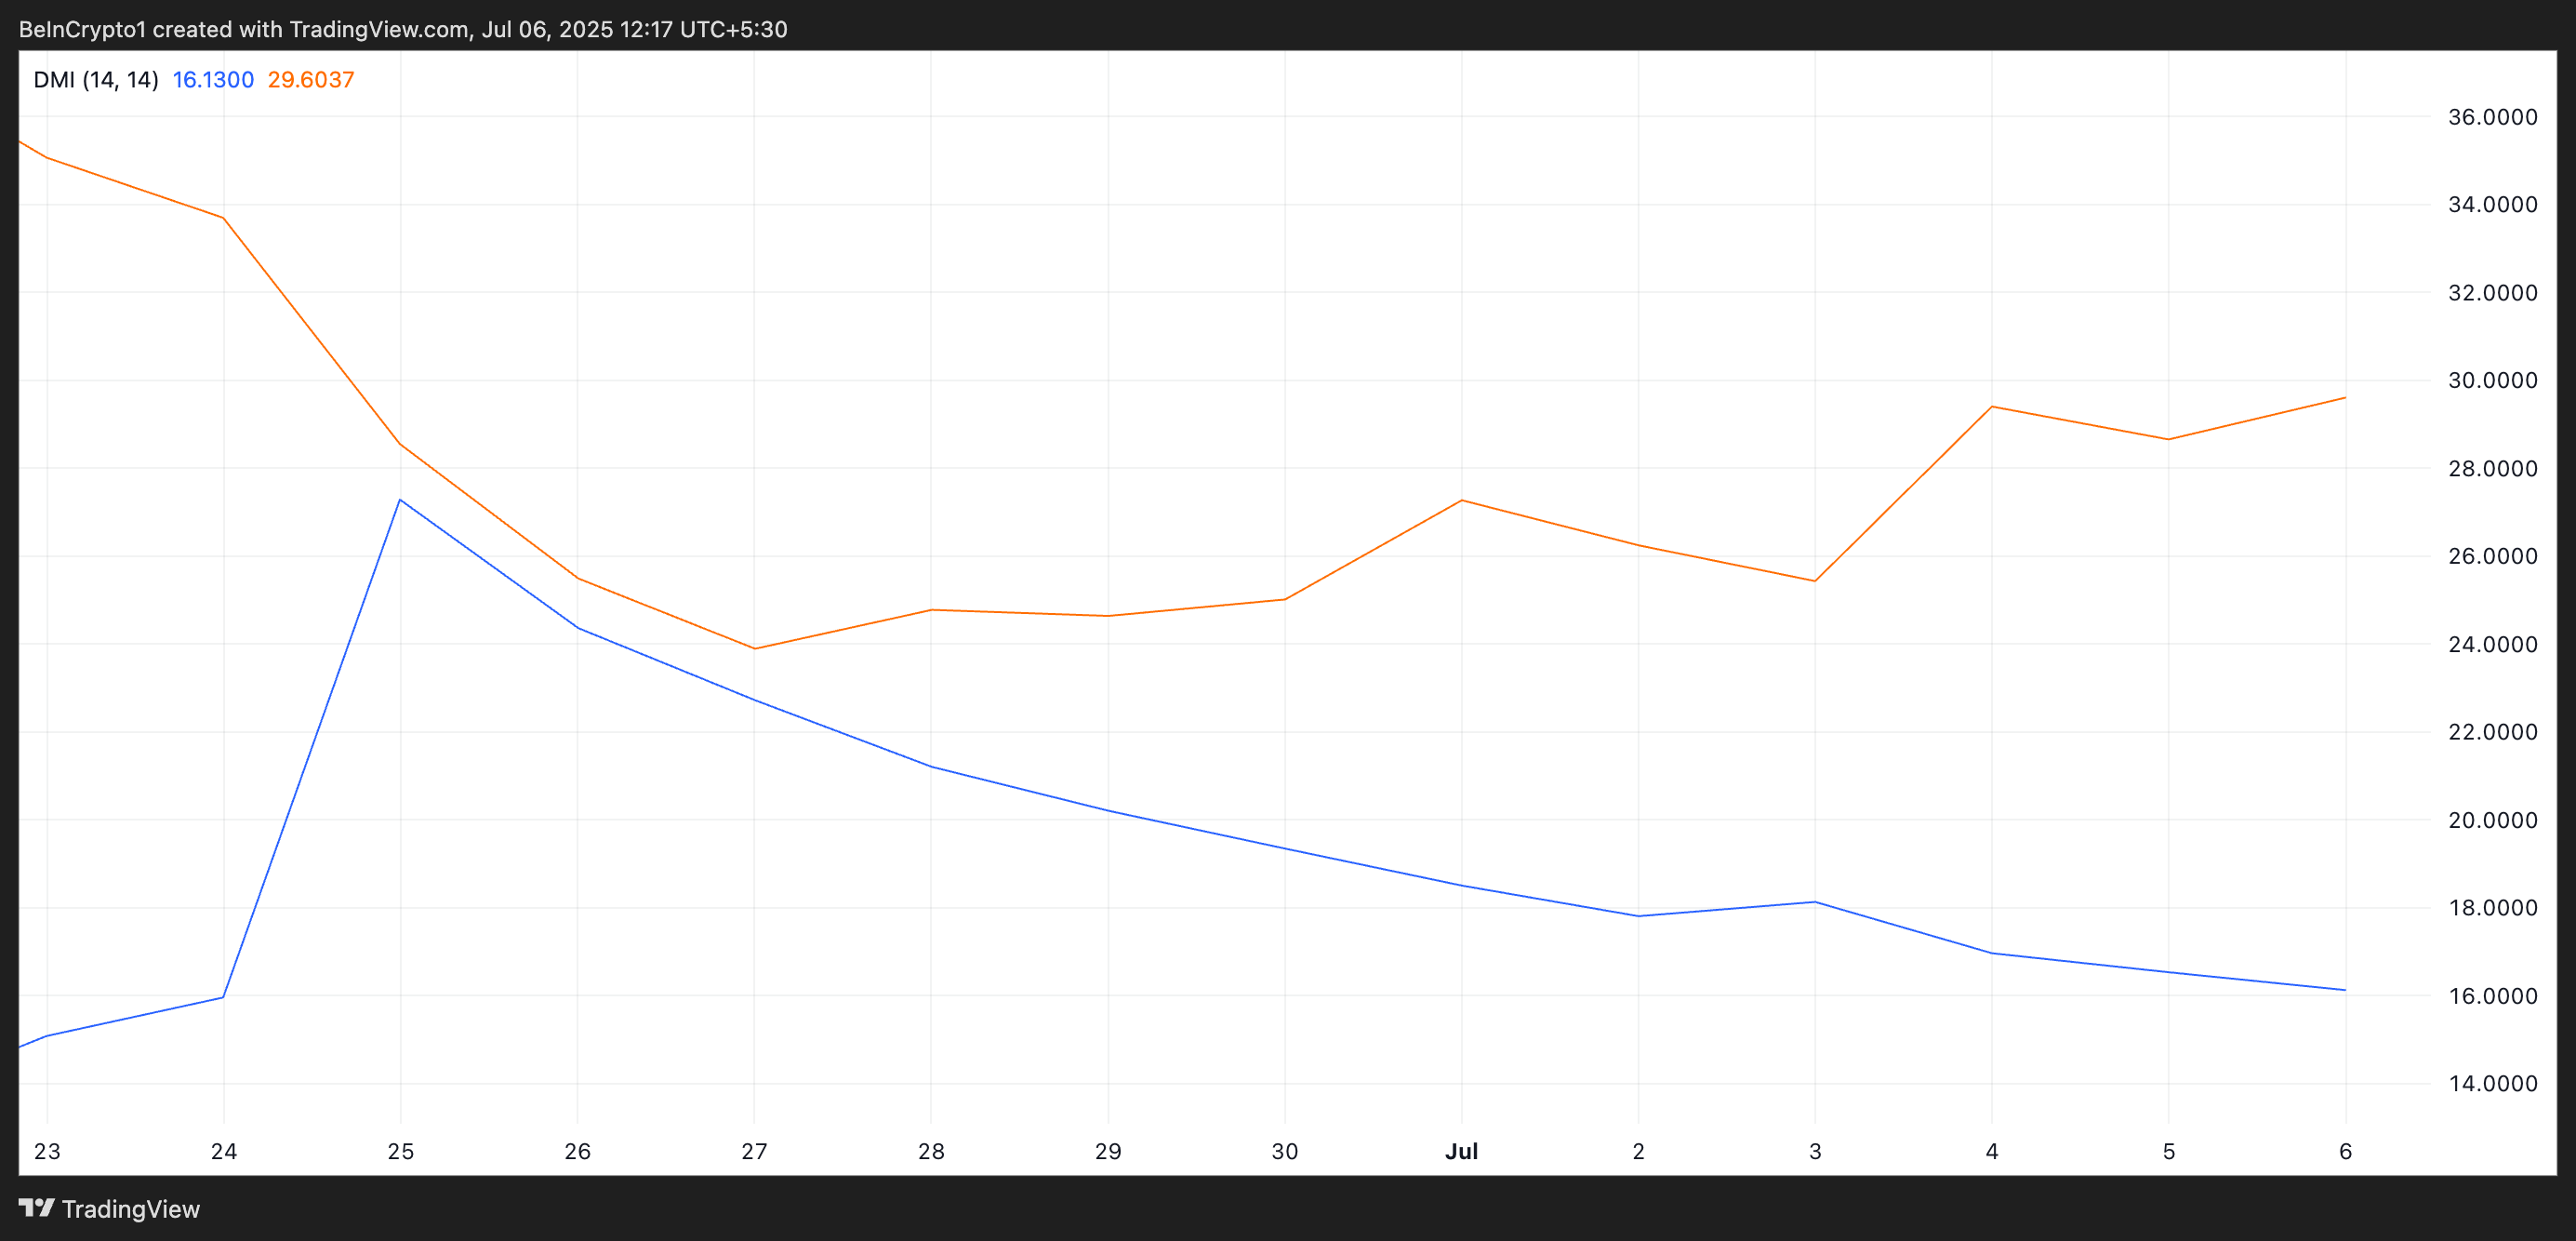
The DMI indicator measures the strength of an asset’s price trend. It consists of two lines: the +DI, which represents upward price movement, and the -DI, which means downward price movement.
The market trend is bullish when the +DI rests above the -DI. This means that buy-side pressure is dominant, and the asset is in an uptrend.
Conversely, when the +DI lies under the -DI, the downward price movement is strong. This is a bearish sign, indicating that PI sellers have more control over the market than buyers.
Sellers Dominate PI Market, but Buyers Could Flip the Script
At press time, PI trades at $0.44, with its next major support level at its all-time low of $0.40. With sellers remaining firmly in control and building bearish momentum, a revisit to this price low is possible.
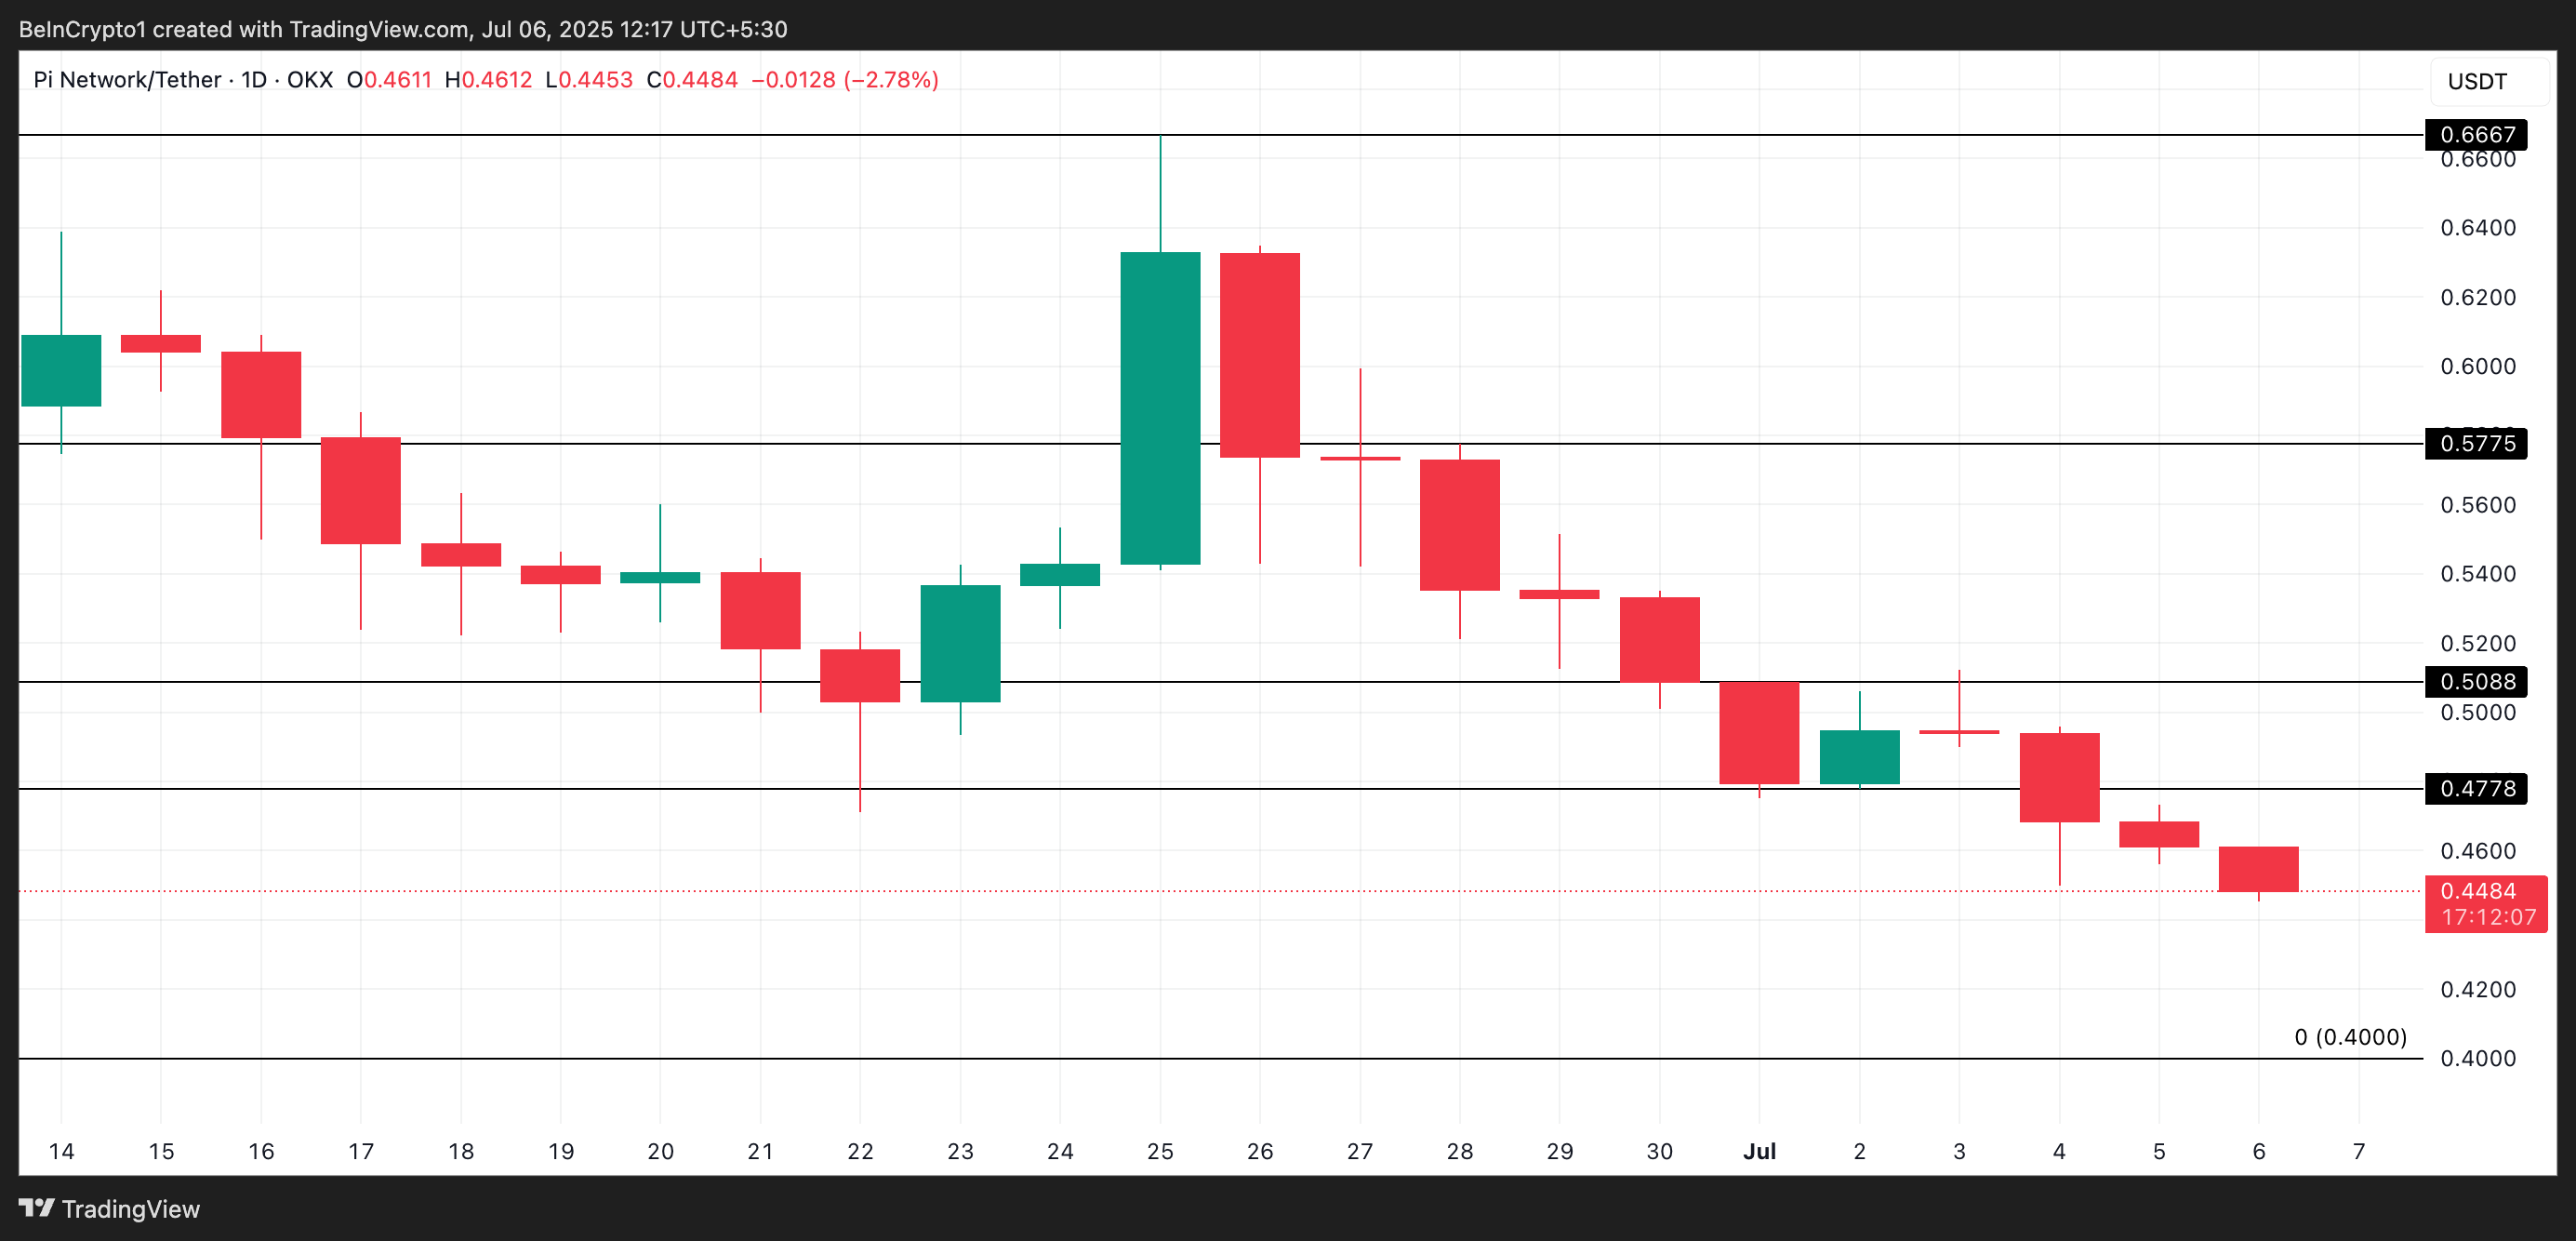
However, a resurgence in buyer demand could invalidate this bearish outlook. In that scenario, the PI coin price could rebound, break above the new resistance at $0.47, and climb toward $0.50.
