Hedera’s 5% Rally Teeters as Sell-Side Pressure Hits Overdrive – Can It Hold?

Hedera's latest 5% surge isn't winning any confidence contests. The rally looks more like a tightrope walk over a pit of sell orders—and the rope's fraying.
Market Mechanics at Play
Every uptick meets a wall of profit-taking. Network activity? Steady. Tokenomics? Unchanged. This is pure trader psychology playing out in real-time—greed and fear doing their usual dance.
The Institutional Angle
While retail traders chase the green candles, OTC desks report quiet accumulation. Smart money knows volatility breeds opportunity—they're just waiting for weak hands to fold first.
Bottom Line
Another 'decentralized' asset moves on centralized exchange dynamics. The irony would be poetic if it weren't so expensive for bagholders.
HBAR’s Short-Term Rally Threatened by Weakening Bullish Pressure
An assessment of the HBAR/USD one-day chart shows the altcoin currently testing a break below its 20-day Exponential Moving Average (EMA). HBAR currently exchanges hands at $0.155, trading above this key moving average, forming dynamic support at $0.153.
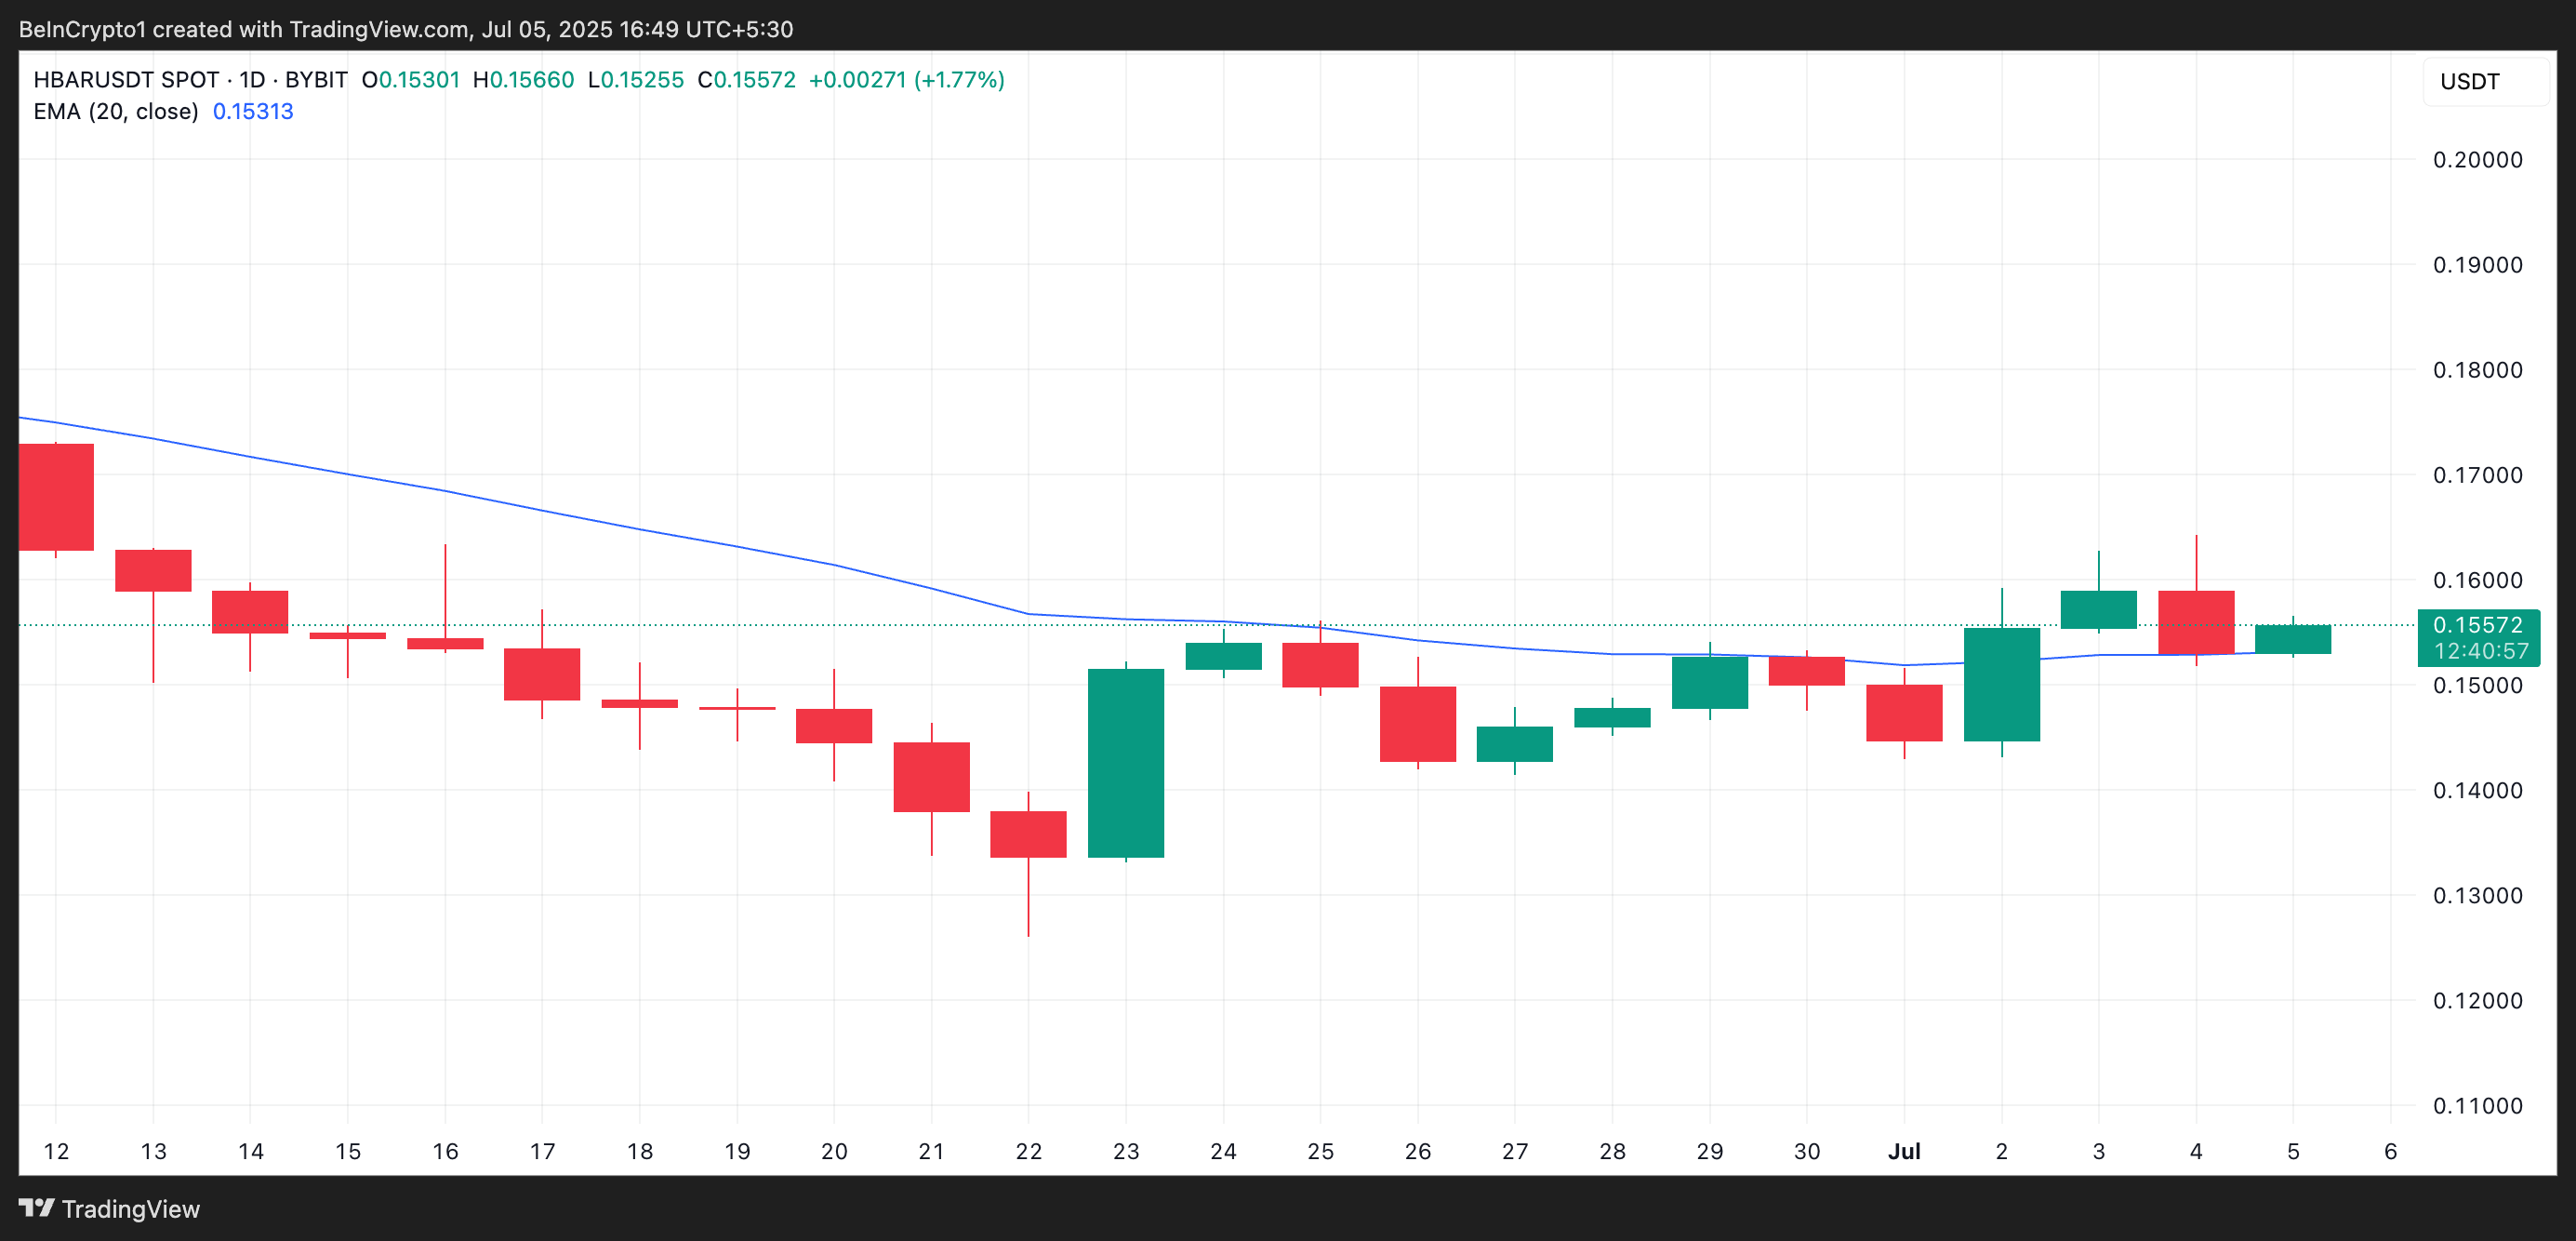
The 20-day EMA measures an asset’s average price over the past 20 trading days, giving weight to recent price changes. When an asset’s price is poised to break below its 20-day EMA, it signals weakening short-term momentum.
HBAR’s eventual decline below this key moving average confirms that selling pressure has outweighed buying activity. If no strong buying interest emerges, the asset could enter a corrective phase or even start a new downtrend.
Moreover, readings from the altcoin’s Elder-Ray Index indicator support this bearish outlook. Over the past three trading sessions, the green bars that make up the indicator have seen their sizes shrink. This contraction reflects fading bullish conviction, reinforcing the risk of a near-term reversal.
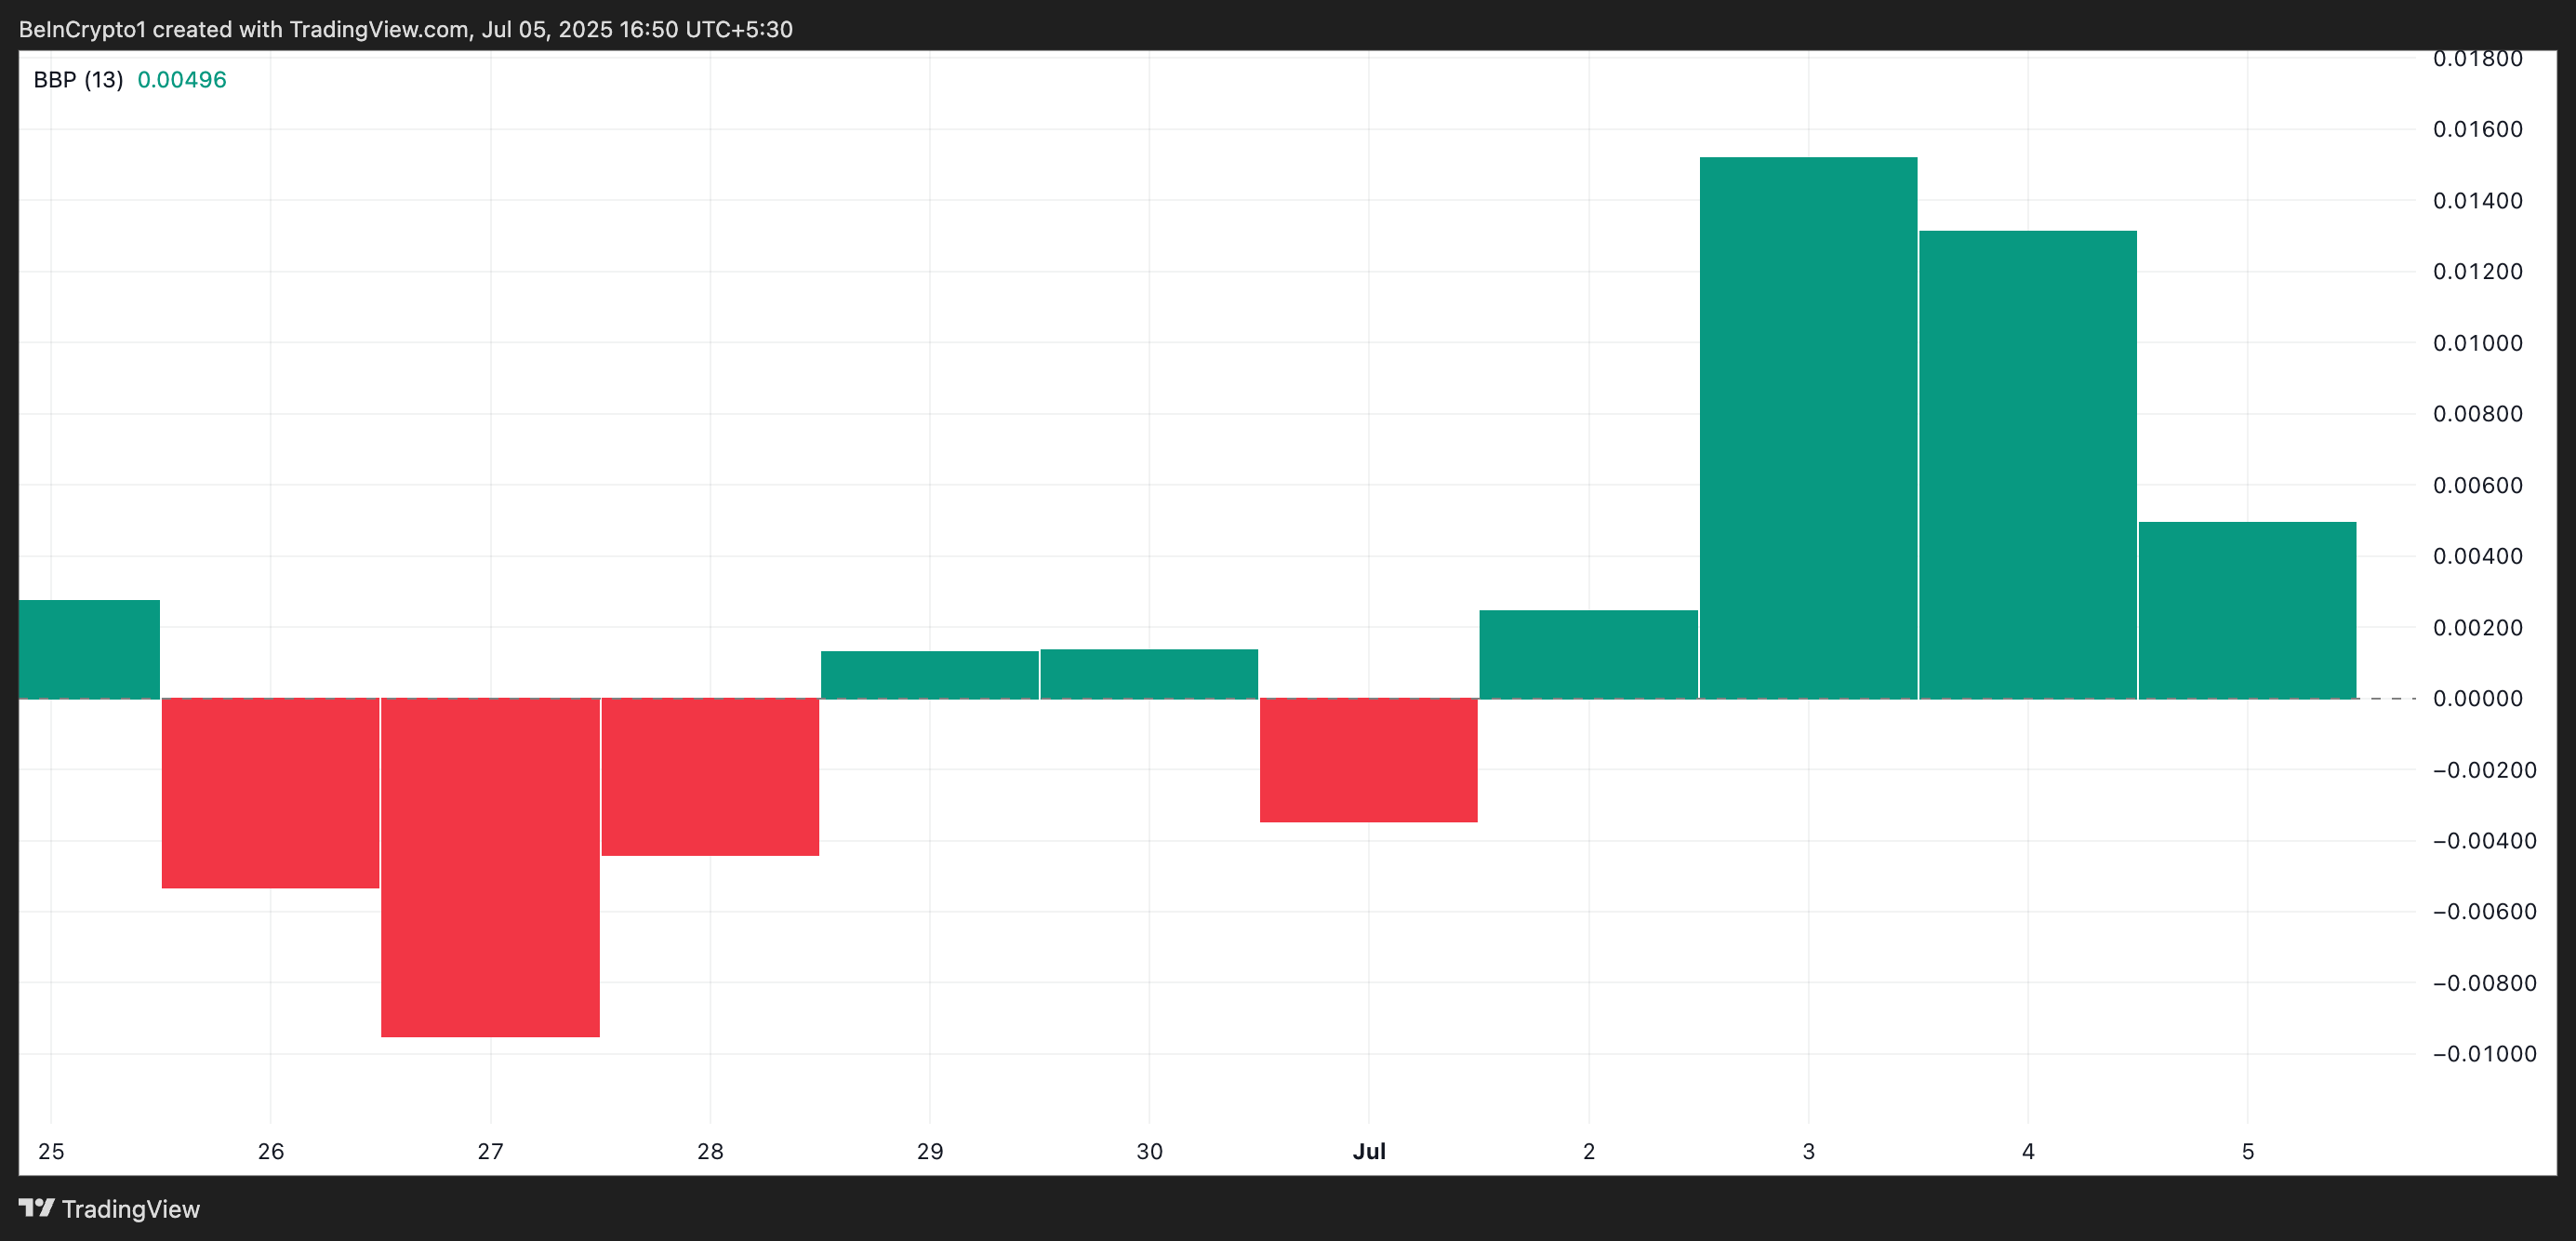
The indicator gauges the strength of bulls and bears in the market. When it prints green histogram bars, it indicates strong buyer dominance and rising upward momentum.
However, when these bars contract like this, it signals a dip in token accumulation, which is the case with HBAR.
HBAR’s Fragile Gains Under Threat
These trends suggest that HBAR could struggle to maintain its gains unless fresh buying momentum returns. In the meantime, it could see a retrace. If selloffs spike, HBAR’s price could fall to $0.141.
If bearish pressure strengthens at this support level, the token’s price could plunge to $0.124.
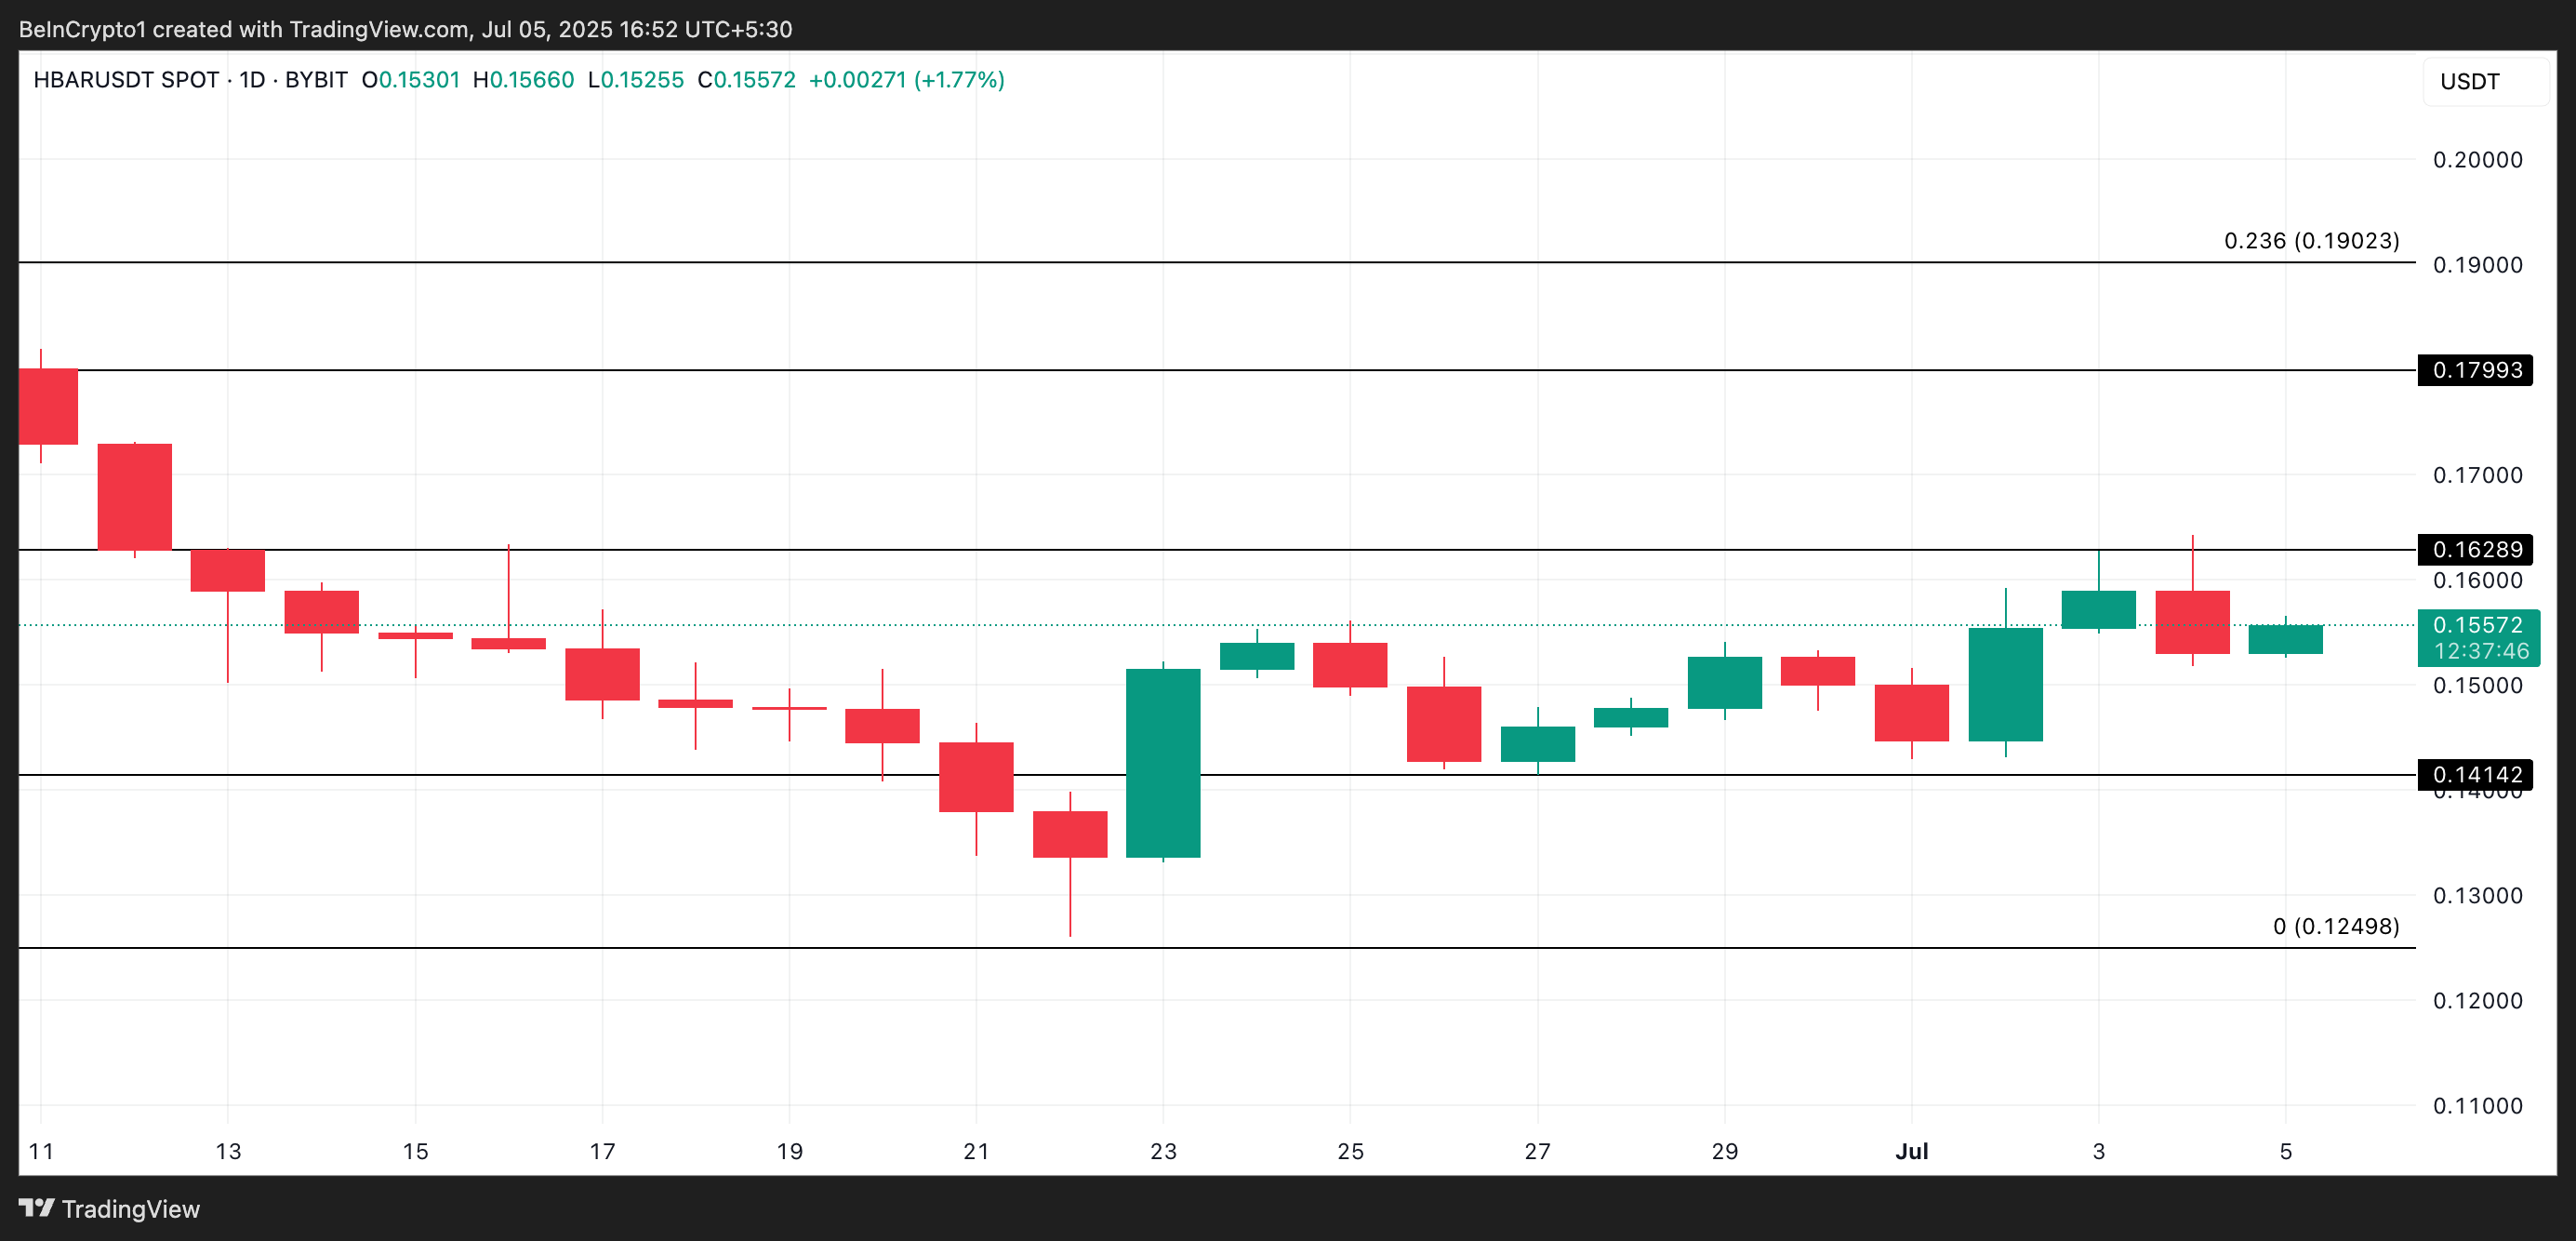
Conversely, a resurgence in new demand for HBAR could invalidate this bearish outlook. If new buyers enter the market, they could propel the altcoin’s value above $0.162.
