Bitcoin Cash Soars to 8-Month Peak – Will July Fuel the Rally Even Higher?

Bitcoin Cash isn’t just climbing—it’s blasting off. The asset just hit its highest price in eight months, leaving traders scrambling. Here’s why July could be the month that separates the believers from the bagholders.
The Rally No One Saw Coming
While Wall Street was busy overcomplicating ETFs, Bitcoin Cash quietly doubled down on its utility narrative. No fancy derivatives, just pure, unfiltered momentum.
The July Factor
Historically, crypto summers either sizzle or fizzle. This time? Liquidity’s flooding back in, and the charts are screaming bullish. Even the skeptics are side-eyeing their short positions.
A Cynic’s Footnote
Let’s be real—half the ‘institutional money’ pouring in still thinks Bitcoin Cash is just Bitcoin with a discount coupon. But hey, money’s money.
Bitcoin Cash Bulls Take Charge
Readings from BCH’s BBTrend point to growing upward bullish momentum, with the indicator currently sitting at 9.4 at press time. This hints at the potential for continued price rallies in the short term.
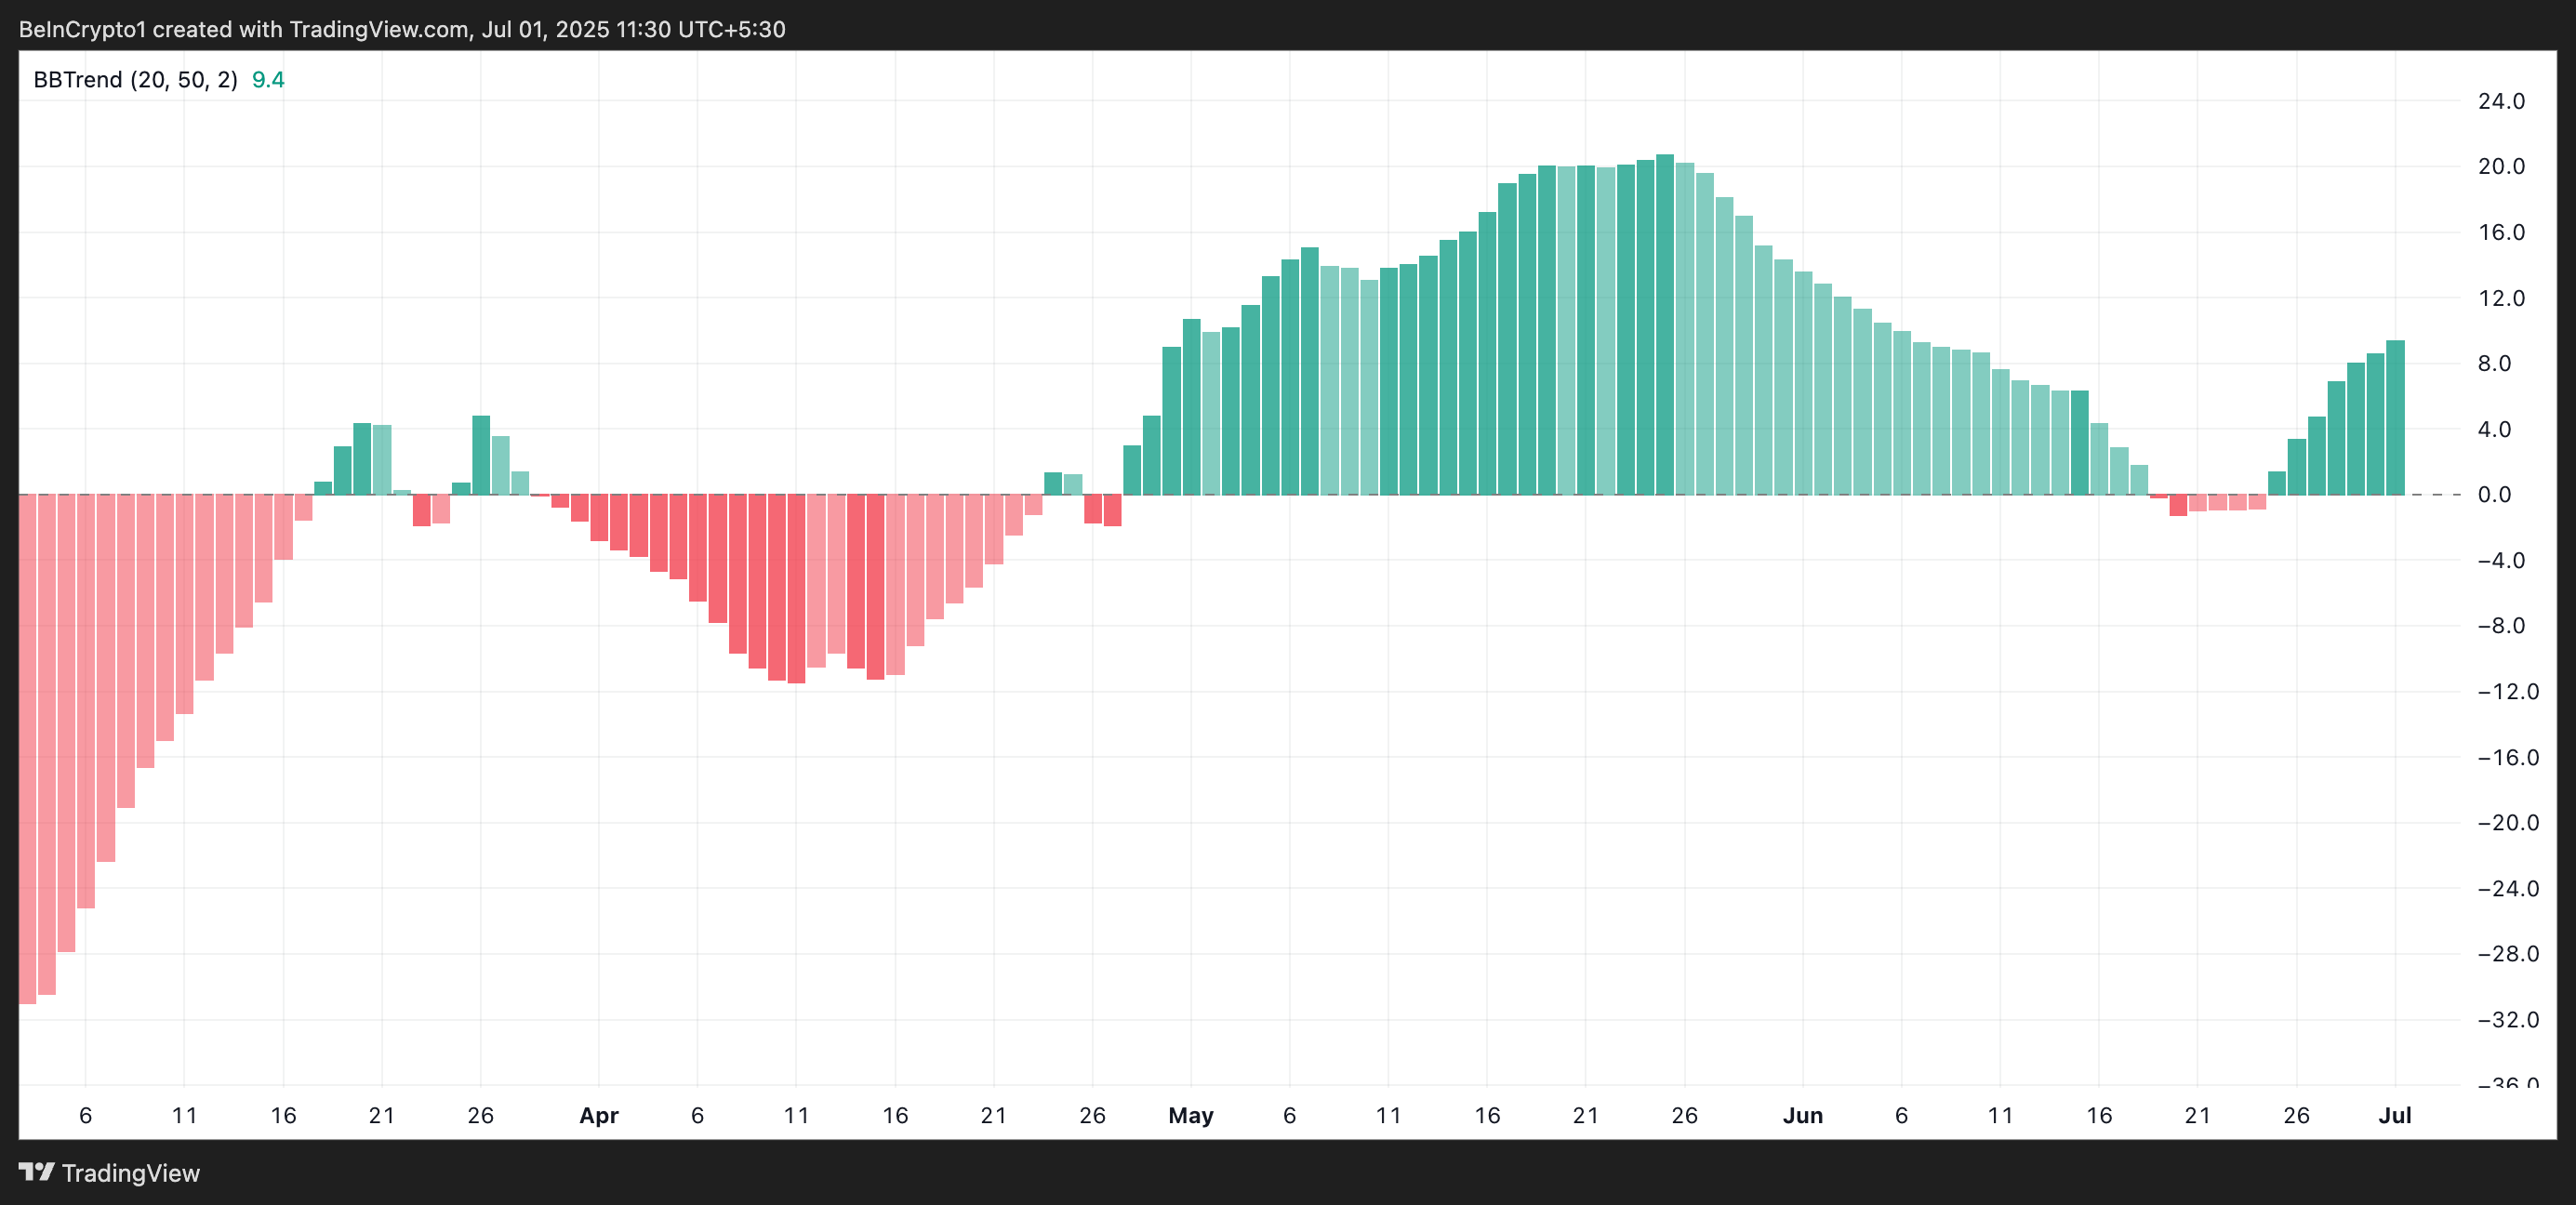
On the daily chart, the green histogram bars that make up the BBTrend have been steadily increasing in size over the past few days, a clear sign of growing buying pressure and investor demand for BCH.
The BBTrend measures the strength and direction of a trend based on the expansion and contraction of Bollinger Bands. When the indicator prints green histogram bars that grow larger over consecutive sessions, it suggests that the bullish trend is strengthening.
For BCH, this setup means buyers are gaining control, volatility is expanding in the direction of the uptrend, and its price is likely to continue moving higher.
Furthermore, the coin’s Smart Money Index (SMI) supports this bullish outlook. As of this writing, the indicator is at 85.1, having climbed over 220% since June 5.
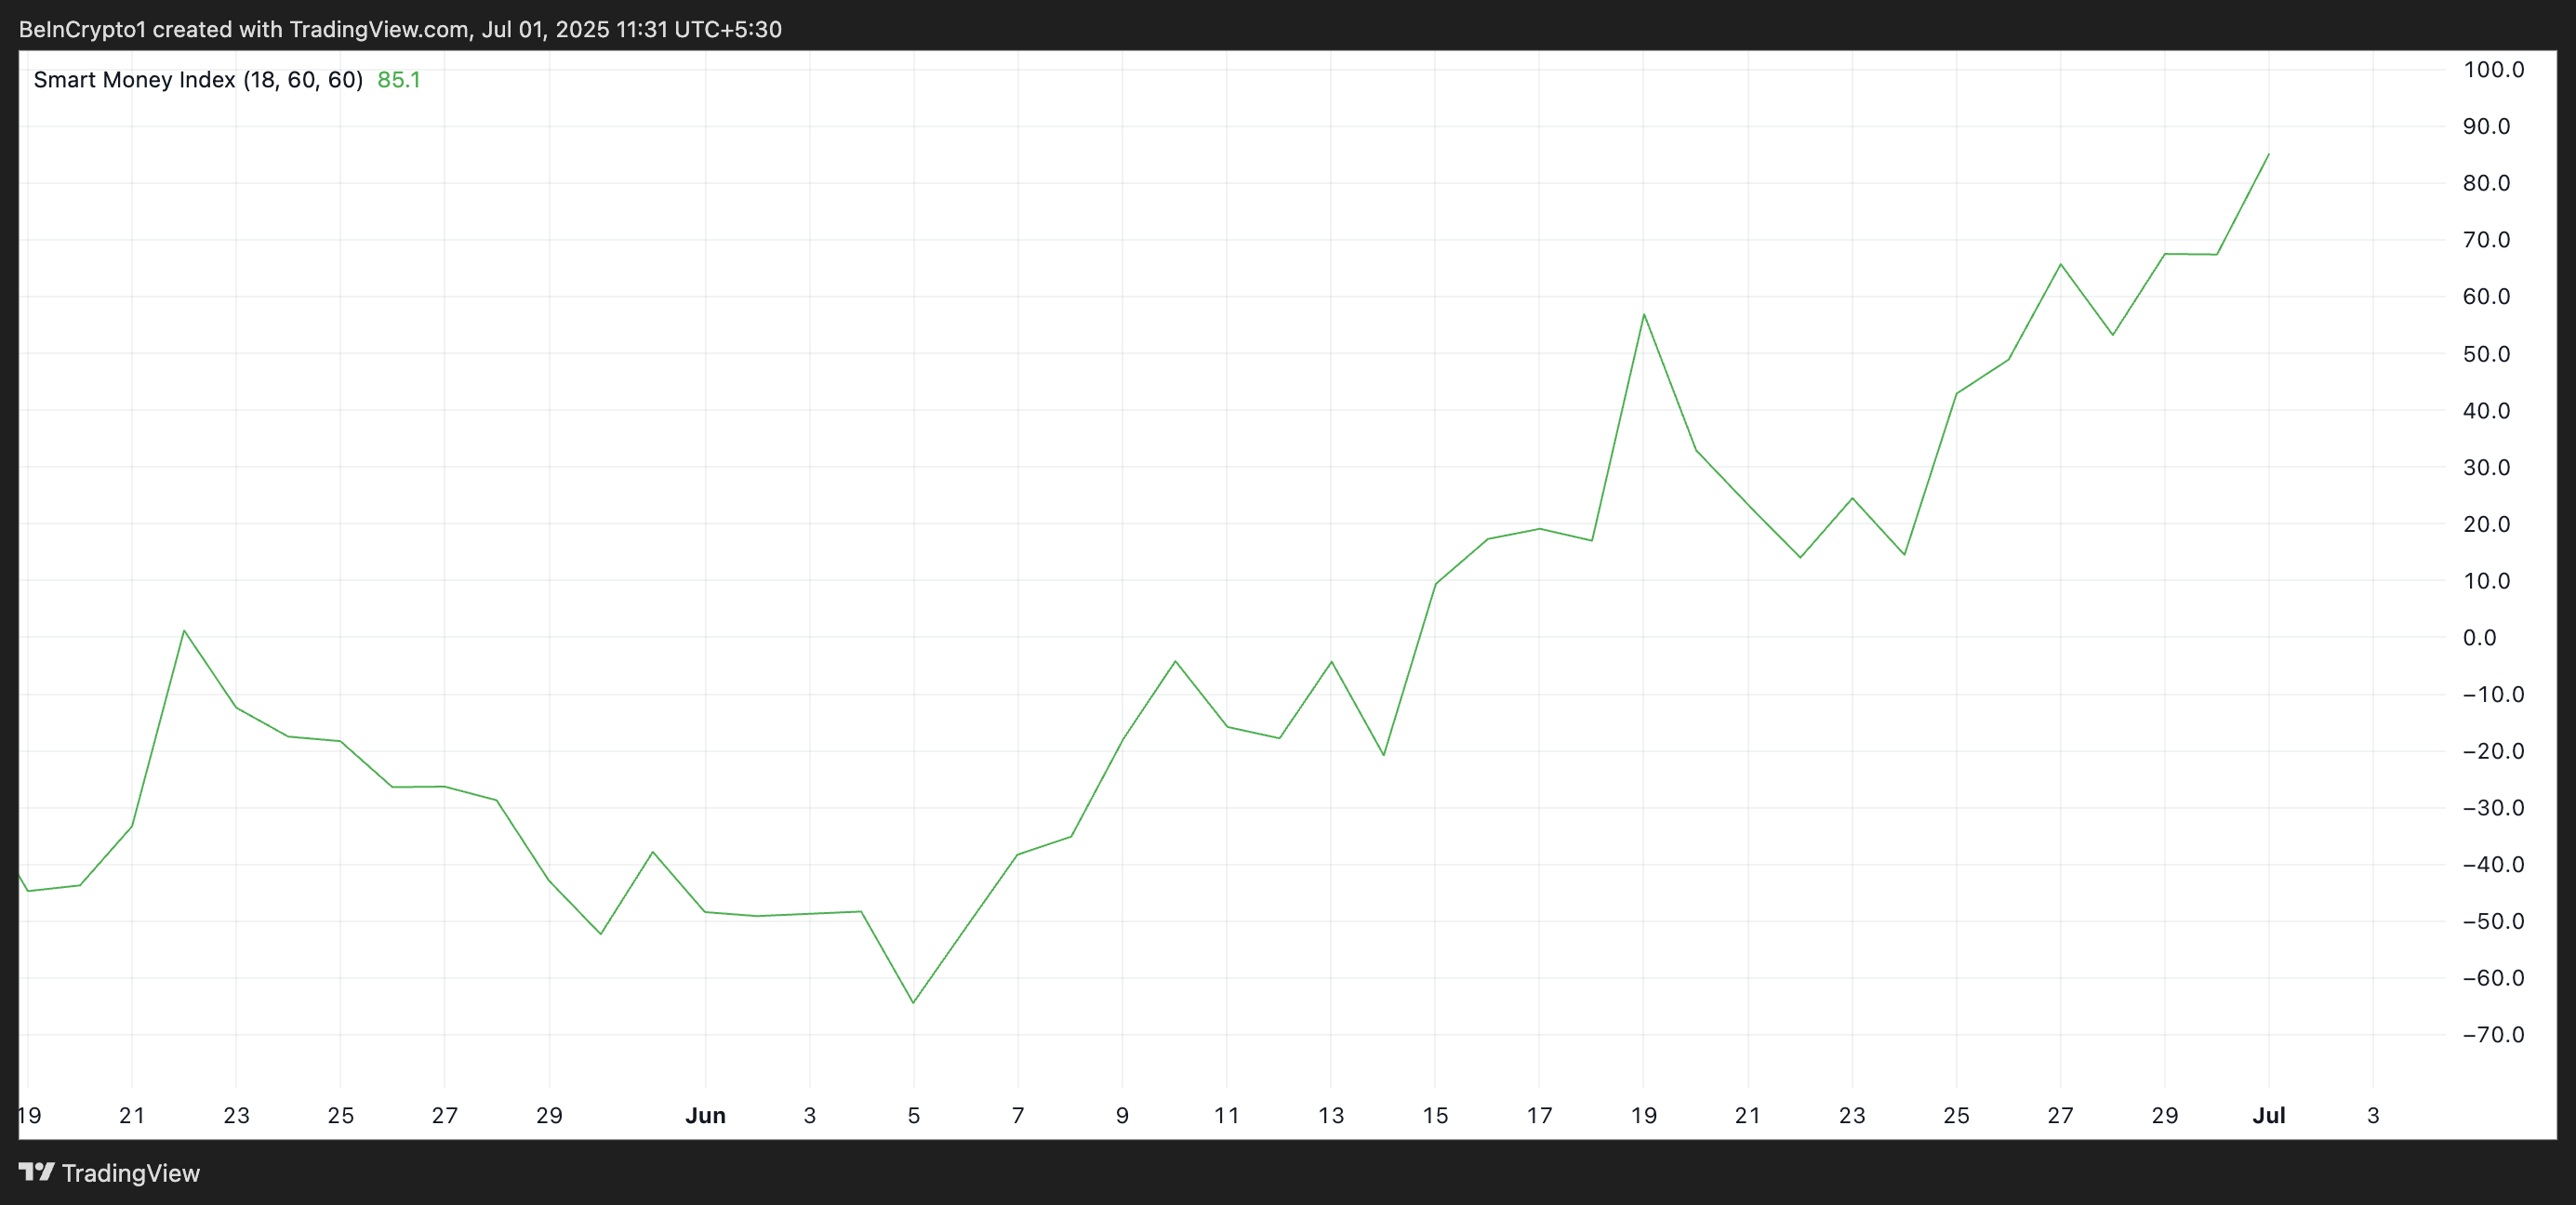
An asset’s SMI tracks the activity of experienced or institutional investors by analyzing market behavior during the first and last hours of trading. When it drops, it suggests selling activity or reduced confidence from these investors, pointing to bearish sentiment or expectations of price declines.
Conversely, when the indicator rises, key investors are increasing their buying activity, signaling growing confidence in the asset. Therefore, the steady uptick in BCH’s SMI over the past few weeks reflects the strong bullish pressure backing its current rally.
BCH Eyes Higher Highs as Buying Pressure Mounts
BCH could climb even higher in the coming days as strengthening demand fuels buying pressure. If accumulation persists, the coin could extend its rally and climb toward $556.40.
On the other hand, if demand stalls and profit-taking begins, the coin’s price could plunge to $490.80.
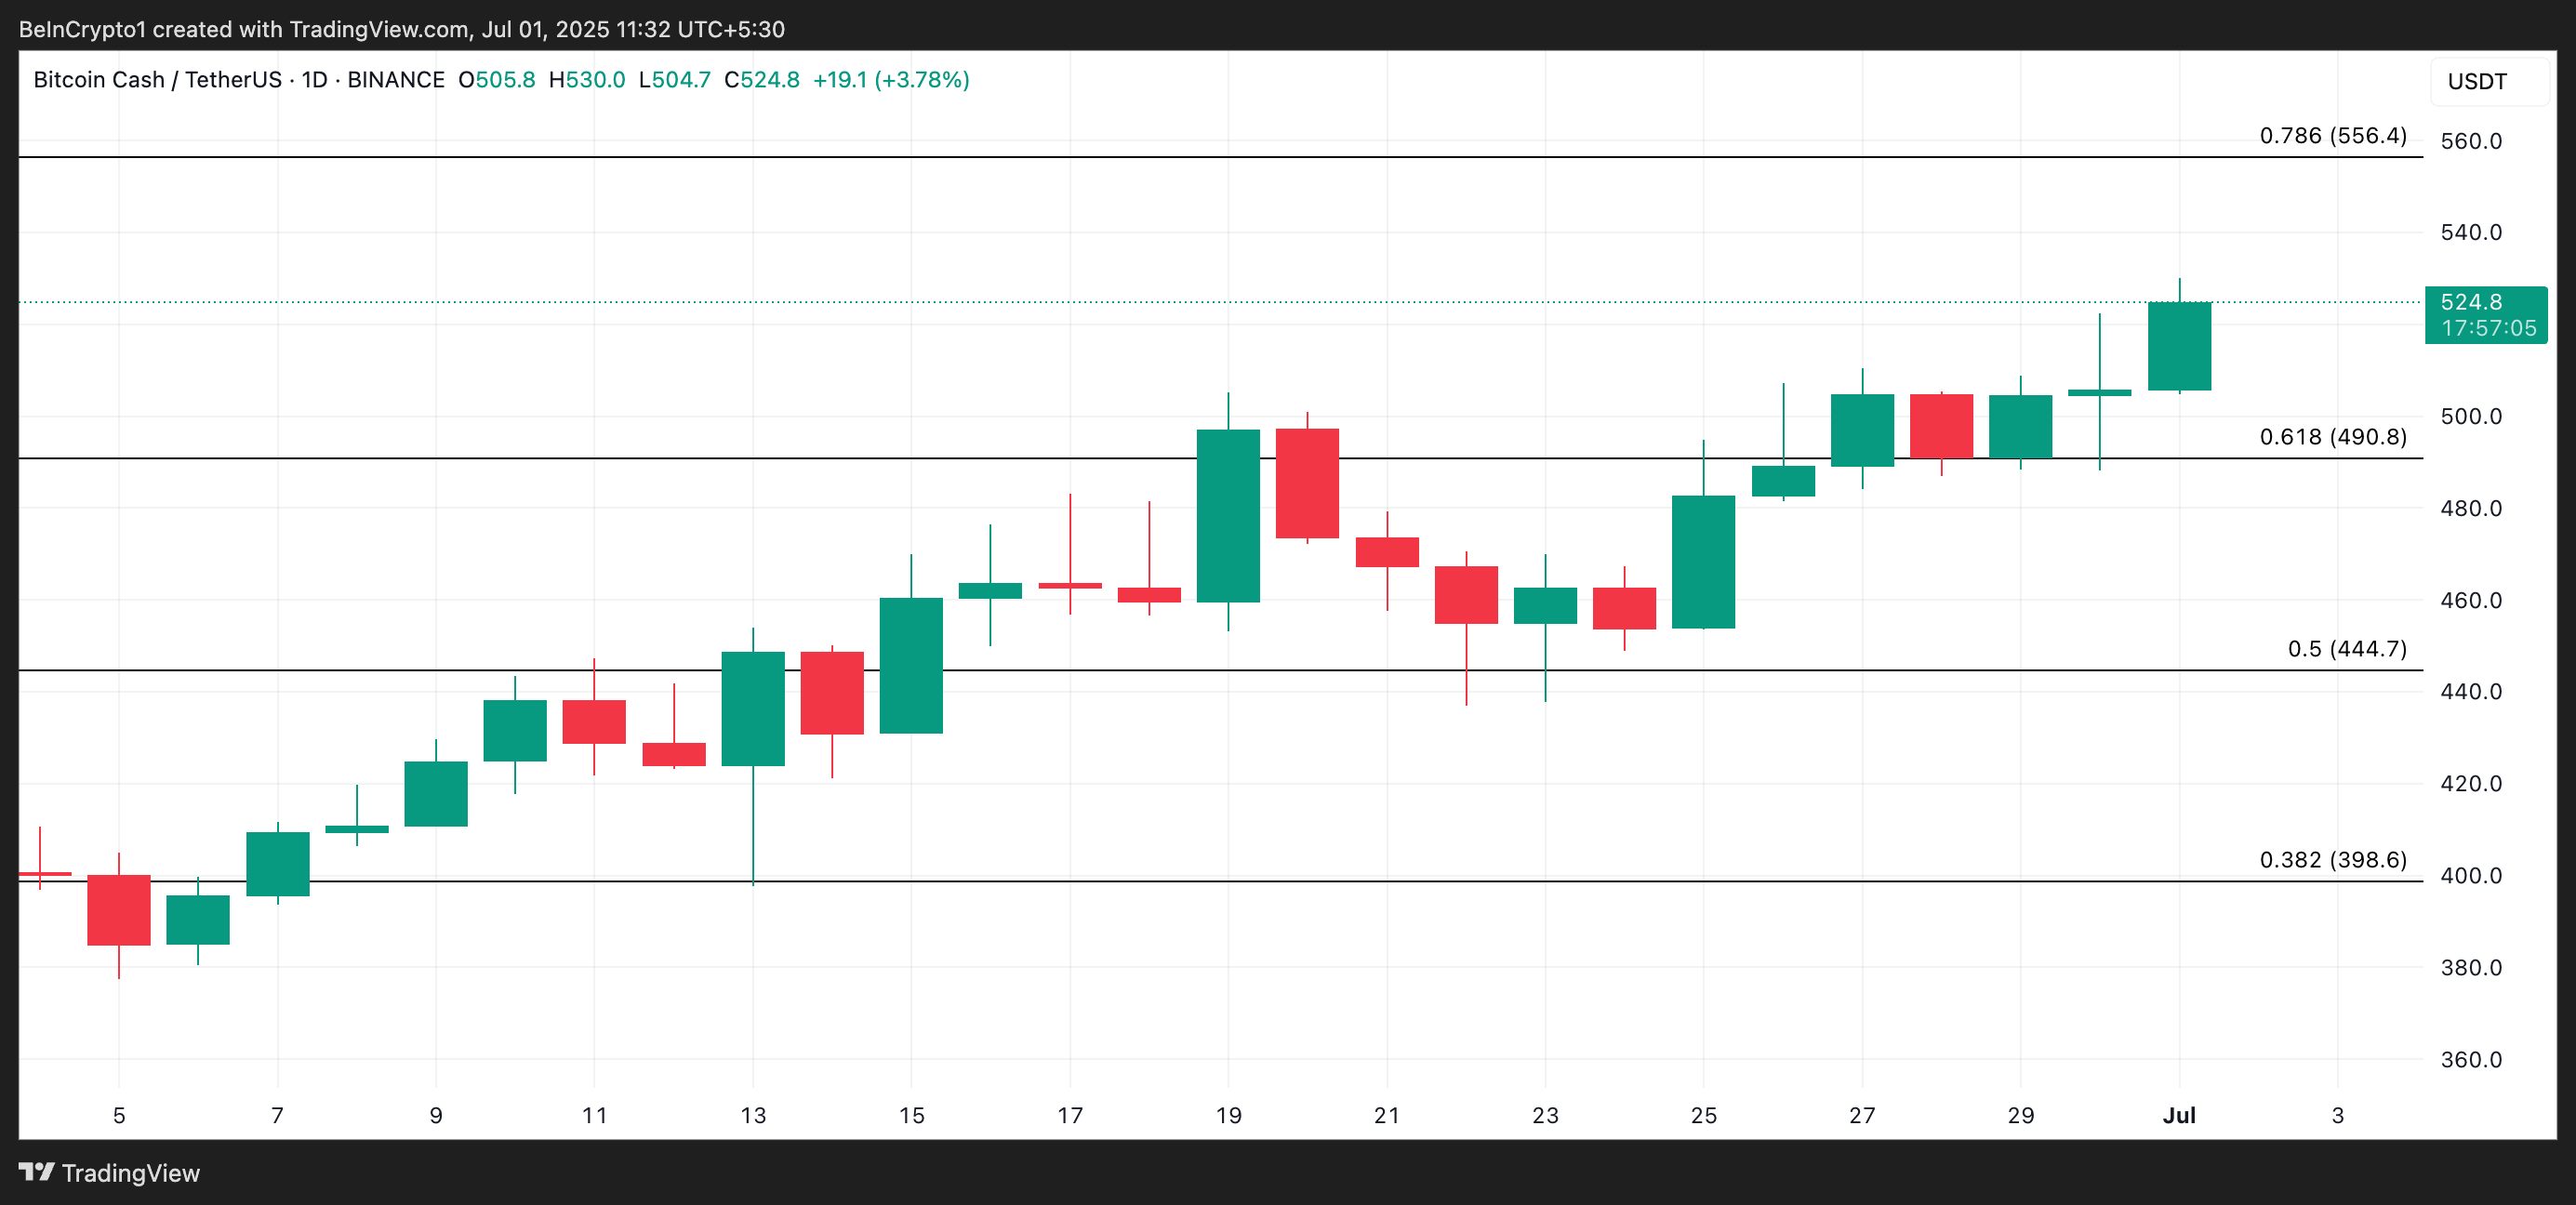
A break below this support floor could trigger further declines toward $444.70.
