Ethereum Futures See Massive Sell-Off as Geopolitical Tensions Explode—What Traders Are Missing

Ethereum futures markets just got rocked by a tsunami of selling pressure—and geopolitics is lighting the fuse. Here's why smart money isn't panicking.
The Flight to Nowhere
Institutional traders dumped ETH derivatives at a pace not seen since the 2022 bear market. Open interest nosedived as macro uncertainty trumped Ethereum's fundamental upgrades. Classic case of Wall Street using crypto as a geopolitical hedge—until they remember it's the most correlated 'uncorrelated' asset class.
Blood in the Water
Liquidations spiked across perpetual swaps, with leveraged longs getting torched. The sell-off comes despite Ethereum's Dencun upgrade slashing layer-2 fees by 90% last quarter. But when missiles fly, traders reach for the 'sell first' button—logic be damned.
The Silver Lining Playbook
This is exactly how ETH bottomed at $880 in 2023. Retail folds, OI resets, then institutions quietly rebuild positions. Meanwhile, Ethereum's burn mechanism keeps removing supply at a rate of 3 ETH/minute. Someone's getting a fire sale—and it's not the paper-handed crowd.
Funny how the 'smart money' always forgets: crypto winters breed generational buying opportunities. But sure, keep trading ETH like it's a tech stock.
Ethereum Bears Tighten Grip
The bearish bias against ETH is reflected by its taker buy/sell ratio, which has consistently posted negative values since Friday. At press time, this stands at 0.93 per CryptoQuant, indicating that sell orders dominate buy orders across the ETH futures market.
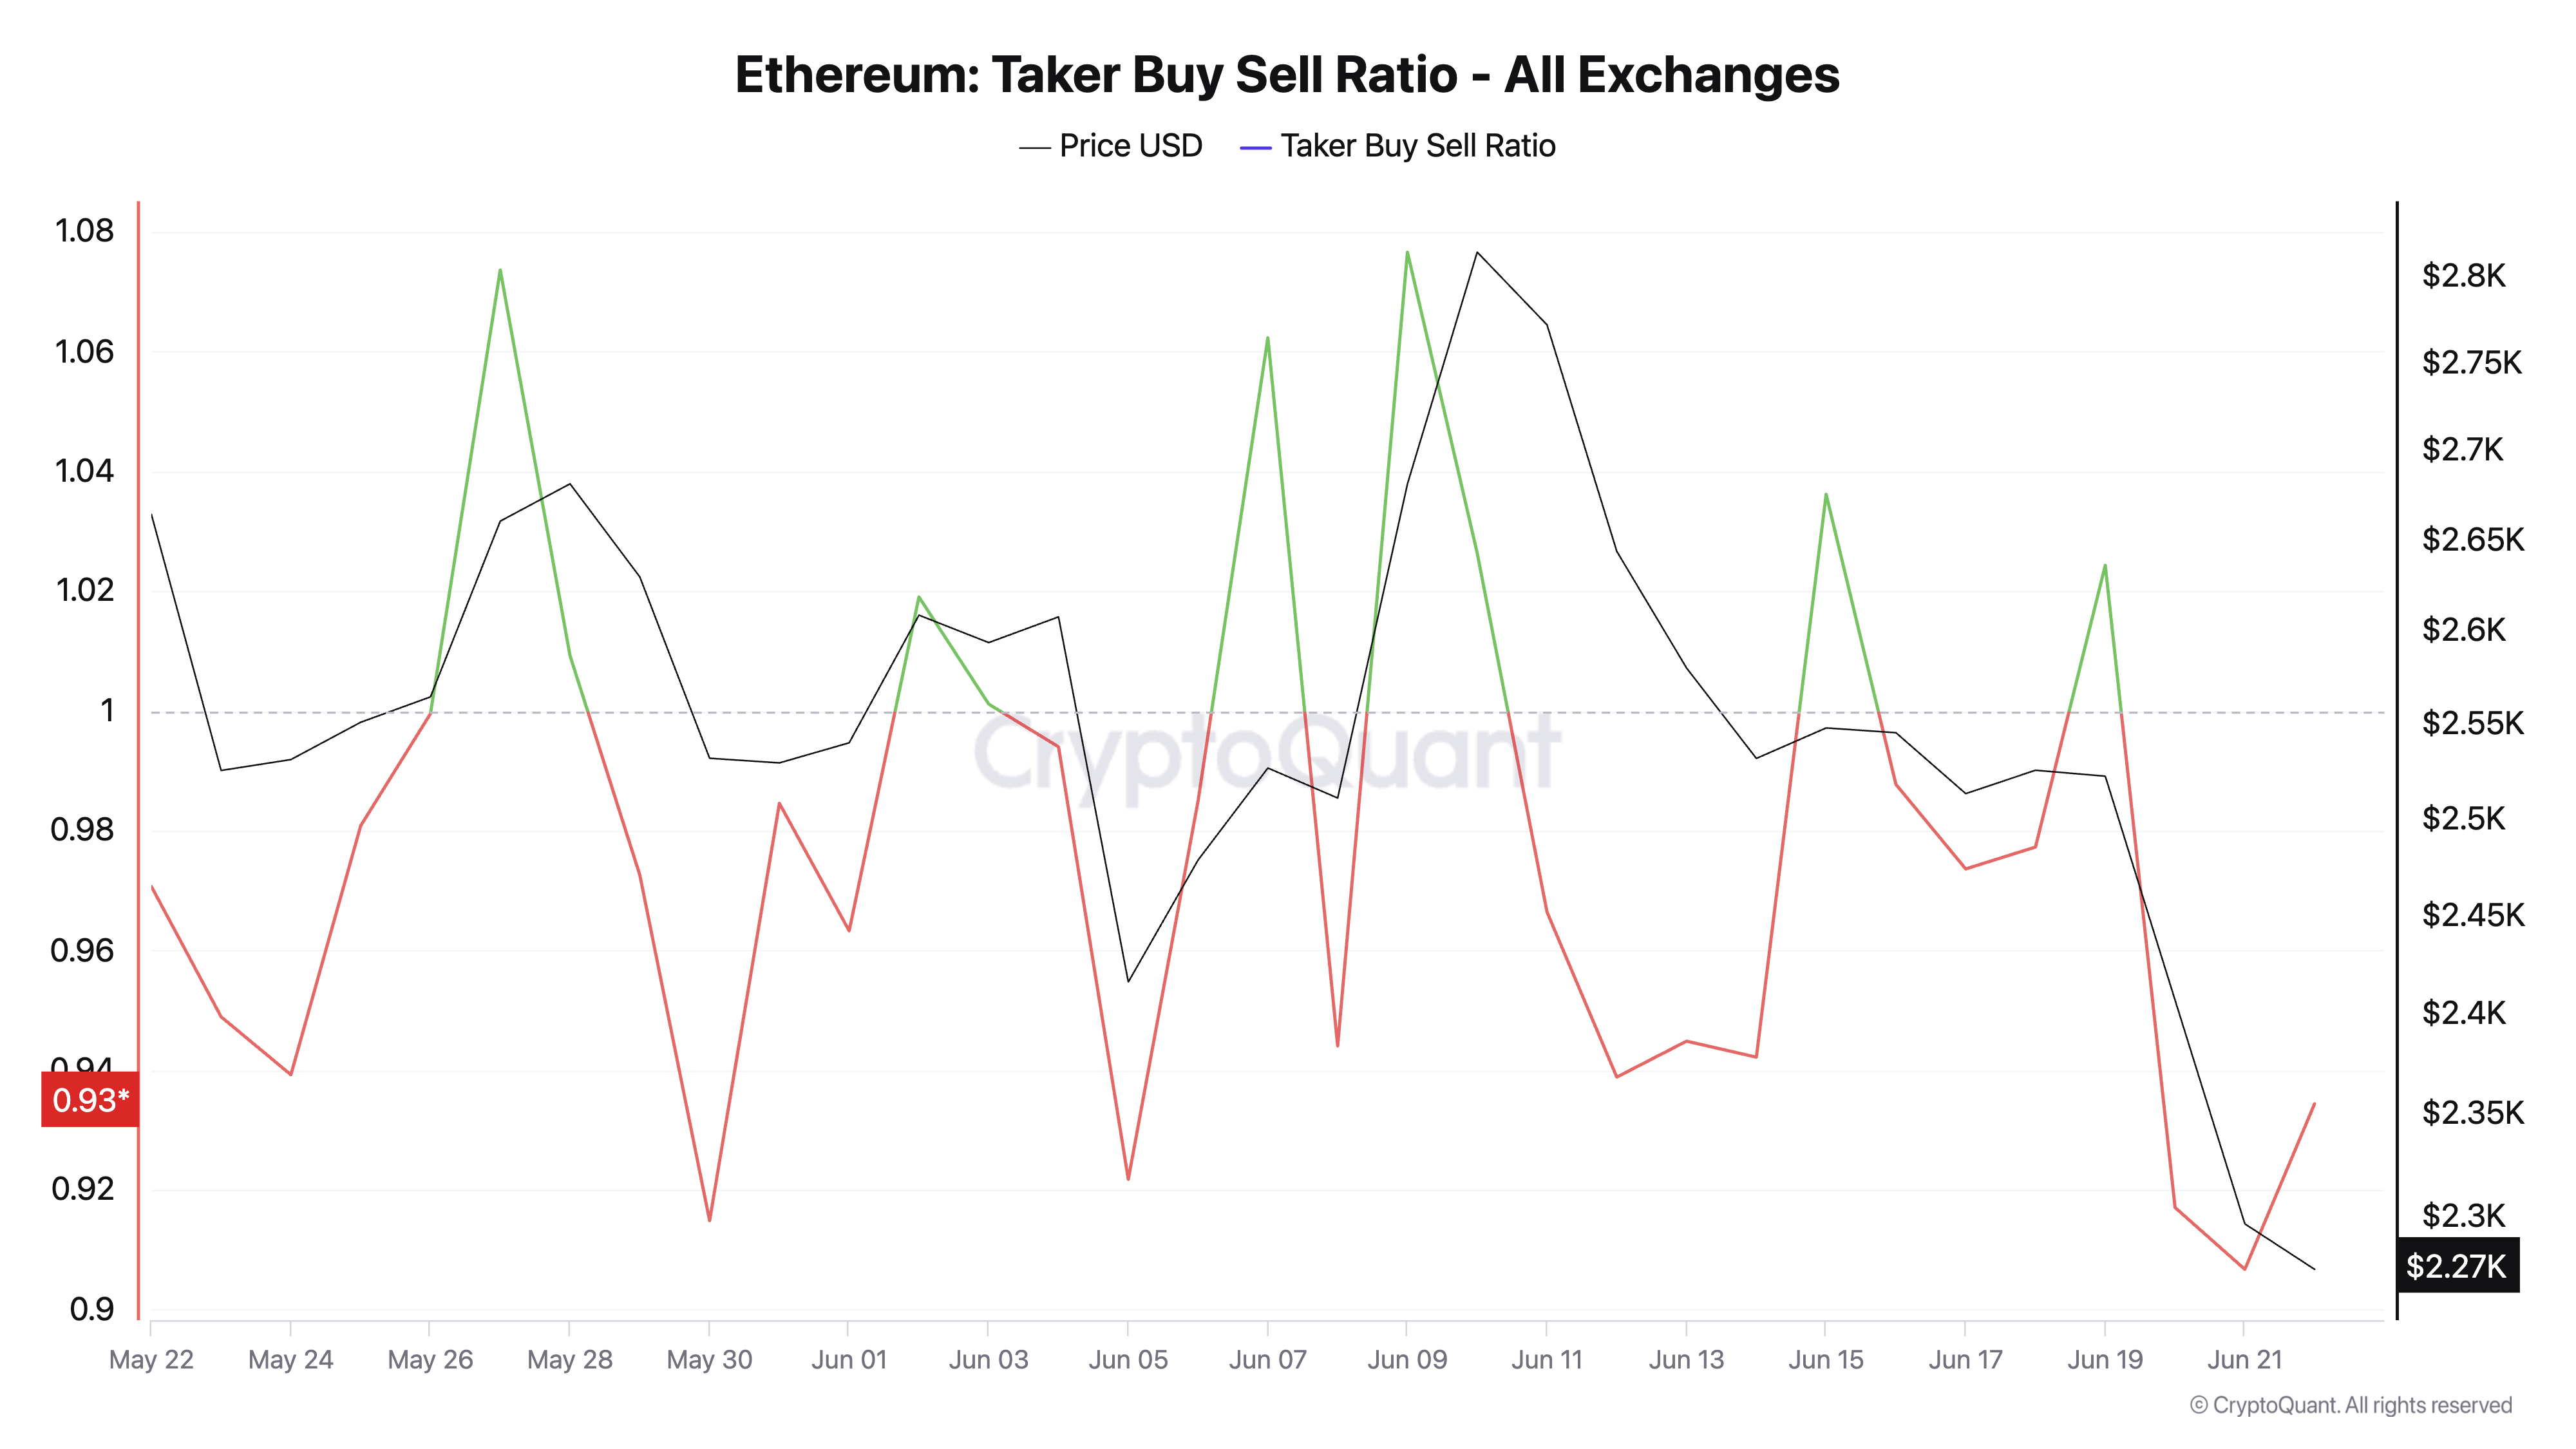
Ethereum Taker Buy Sell Ratio. Source: TradingView
An asset’s taker buy-sell ratio measures the ratio between the buy and sell volumes in its futures market. Values above one indicate more buy than sell volume, while values below one suggest that more futures traders are selling their holdings.
The steady dip in ETH’s taker buy/sell ratio over the past few days points to a climbing sell-off among futures traders. This mounting sell-side pressure confirms weakening sentiment and could accelerate price declines if it continues.
In addition, ETH remains significantly below its 20-day Exponential Moving Average (EMA), which shows the bearish sentiment surrounding the asset. At press time, this key moving average forms dynamic resistance above ETH’s price of $2,497.

The 20-day EMA measures an asset’s average price over the past 20 trading days, giving weight to recent prices. When the price falls below the 20-day EMA, it signals short-term bearish momentum and suggests sellers are in control.
This further confirms the weakening bullish structure around ETH, as the asset struggles to reclaim short-term trend support.
Will Ethereum Hold the Line?
ETH currently trades at $2,272, noting a 6% decline amid the broader market’s pullback of the past 24 hours. With climbing sell pressure across its spot and futures market, ETH risks pulling toward the support at $2,185.
If this support fails, ETH’s price could plummet further to $2,027.

However, if buying pressure gradually gains momentum, ETH could rebound and climb to $2,424.
