Solana’s Nasdaq Momentum: Can It Shatter $160 Before Q2 Ends?

Solana's riding high on Nasdaq's coattails—but can it turn hype into hard gains?
The speed demon of blockchain just got a turbocharge from traditional finance's spotlight. With institutional eyeballs glued to crypto's most scalable contender, SOL's price action reads like a thriller.
Breaking through psychological barriers
$160 isn't just another number—it's the make-or-break level that separates 'promising project' from 'market dominator.' Traders are watching the charts like hawks, waiting to see if Solana can flip this resistance into support before the quarter's final bell.
The Nasdaq effect (or is it affect?)
Wall Street's sudden crypto crush smells suspiciously like 2021's déjà vu. When traditional markets sneeze, digital assets catch pneumonia—but this time, Solana's built a better immune system with actual utility.
Prediction time: SOL's got nine lives
Whether it's a graceful moon landing or a painful rejection, one thing's certain: the crypto casino never closes. Just remember—institutional interest giveth, and the Fed taketh away.
Solana Primed for Rally? Nasdaq Filing Fuel Momentum
According to a Form 40-F filing dated June 18, Canadian asset manager Sol Strategies, a firm focused exclusively on the solana ecosystem, filed compliance documents with the US Securities and Exchange Commission (SEC), signaling its intent to list on the Nasdaq.
While still awaiting approval, the filing represents a bold step toward offering institutional investors direct exposure to Solana-based assets via traditional markets. This development has triggered a renewed wave of cautious Optimism among SOL hodlers, driving up its price today.
Also, the timing of this filing aligns with increasingly bullish on-chain signals such as the coin’s Liquidation Heatmaps, which show a dense cluster of liquidity has formed around the $160 level.
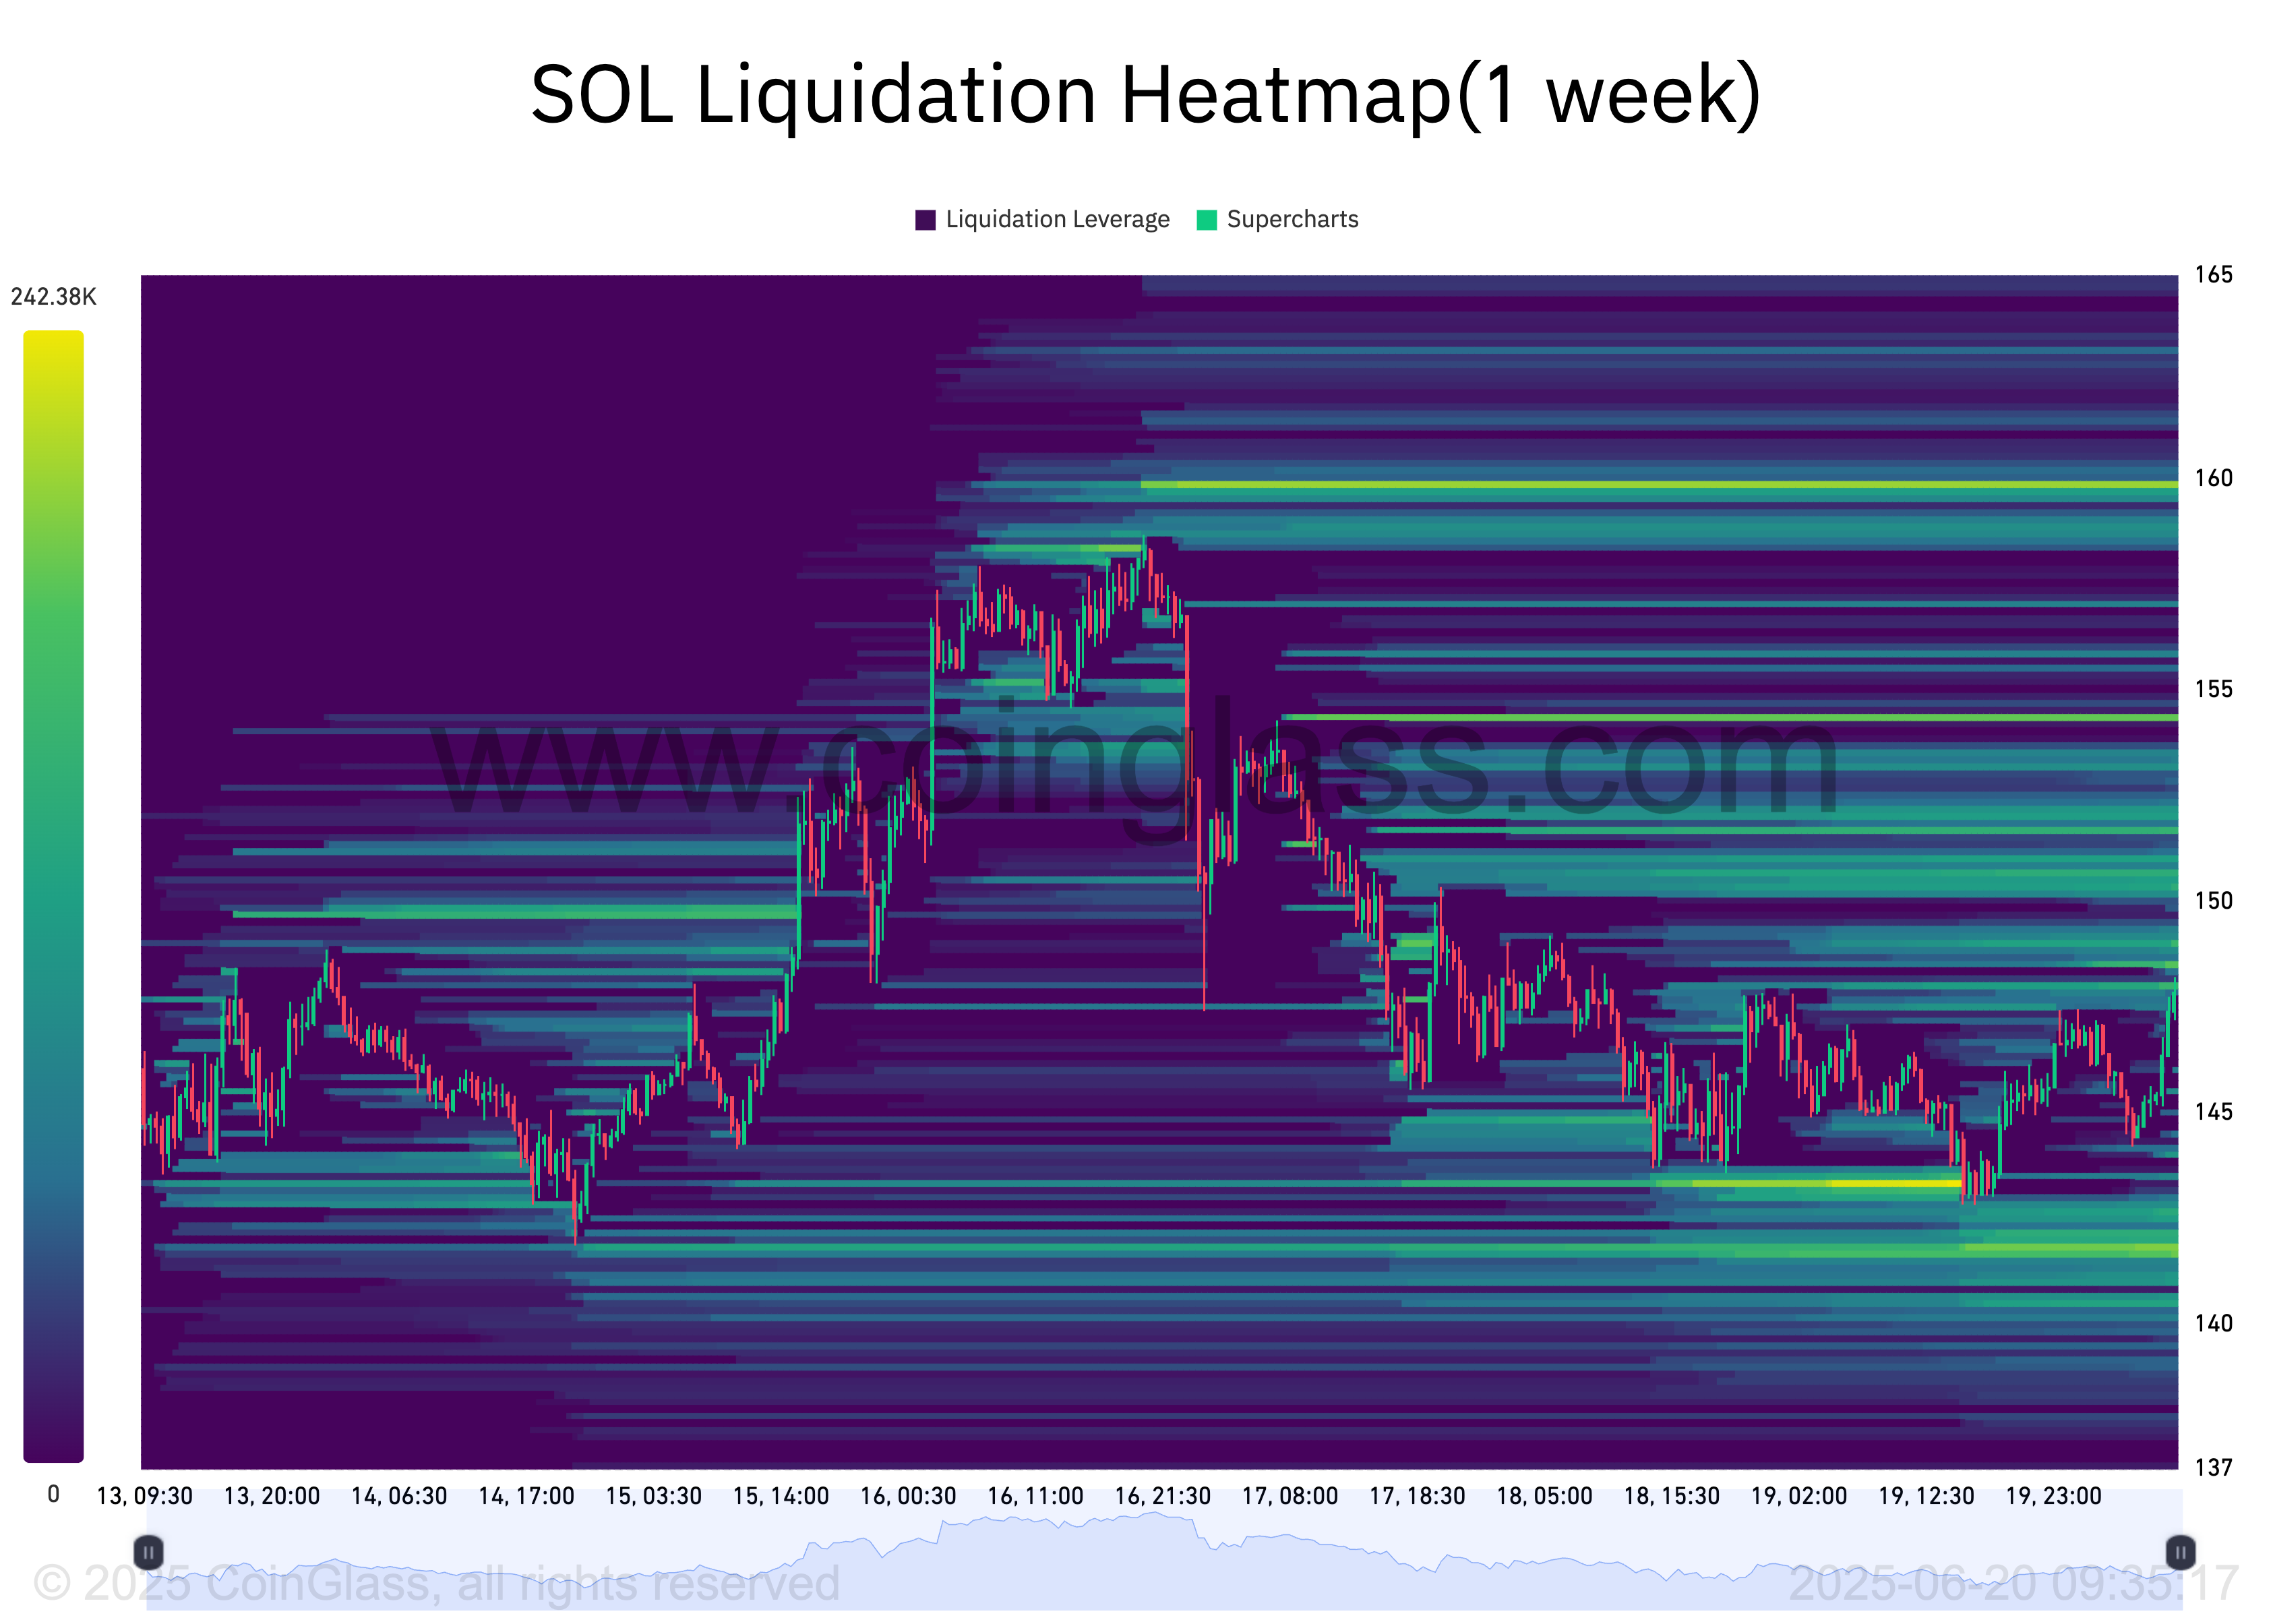
Liquidation heatmaps are visual tools traders use to identify price levels where large clusters of Leveraged positions are likely to be liquidated. These maps highlight areas of high liquidity, often color-coded to show intensity, with brighter zones representing larger liquidation potential.
Usually, these price zones are magnets for price action, as the market moves toward these areas to trigger liquidations and open fresh positions.
Therefore, for SOL, the dense liquidity cluster around the $160 level suggests strong trader interest in buying or covering short positions at that price. This sets the stage for a near-term rally toward that zone.
Furthermore, SOL’s open interest (OI) has climbed 3% over the past day, indicating increased leveraged participation in SOL futures.
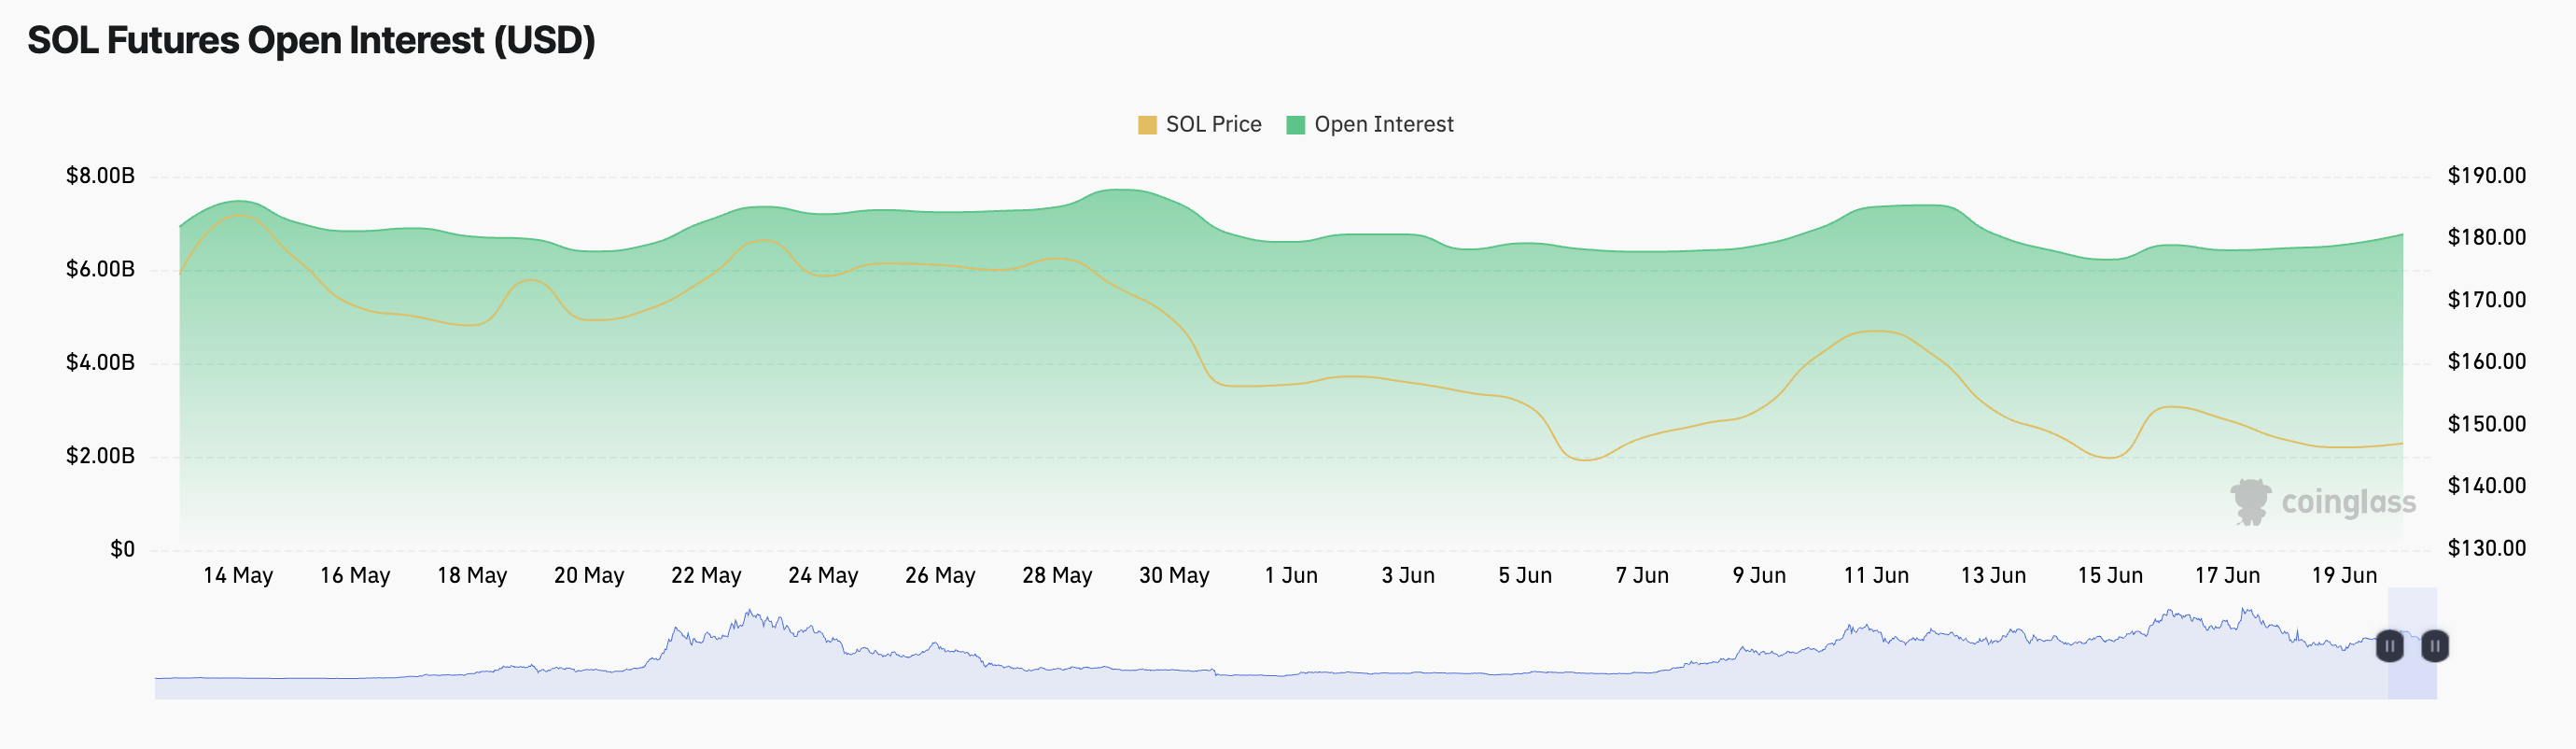
A rising OI suggests that more capital is flowing into the coin’s derivatives markets, reflecting growing conviction among traders about SOL’s potential upward price movement.
Can Fresh Demand Spark a Breakout Above $160?
Since early June, SOL has traded within a tight range, facing resistance at $153.59 and finding support at $142.59. A potential push toward $160 WOULD require a decisive breakout above this resistance, which can only happen if fresh demand enters the market.
Without renewed buying pressure, current momentum may stall. If buyers begin to show signs of exhaustion, SOL risks reversing its recent gains and retesting support at $142.59.
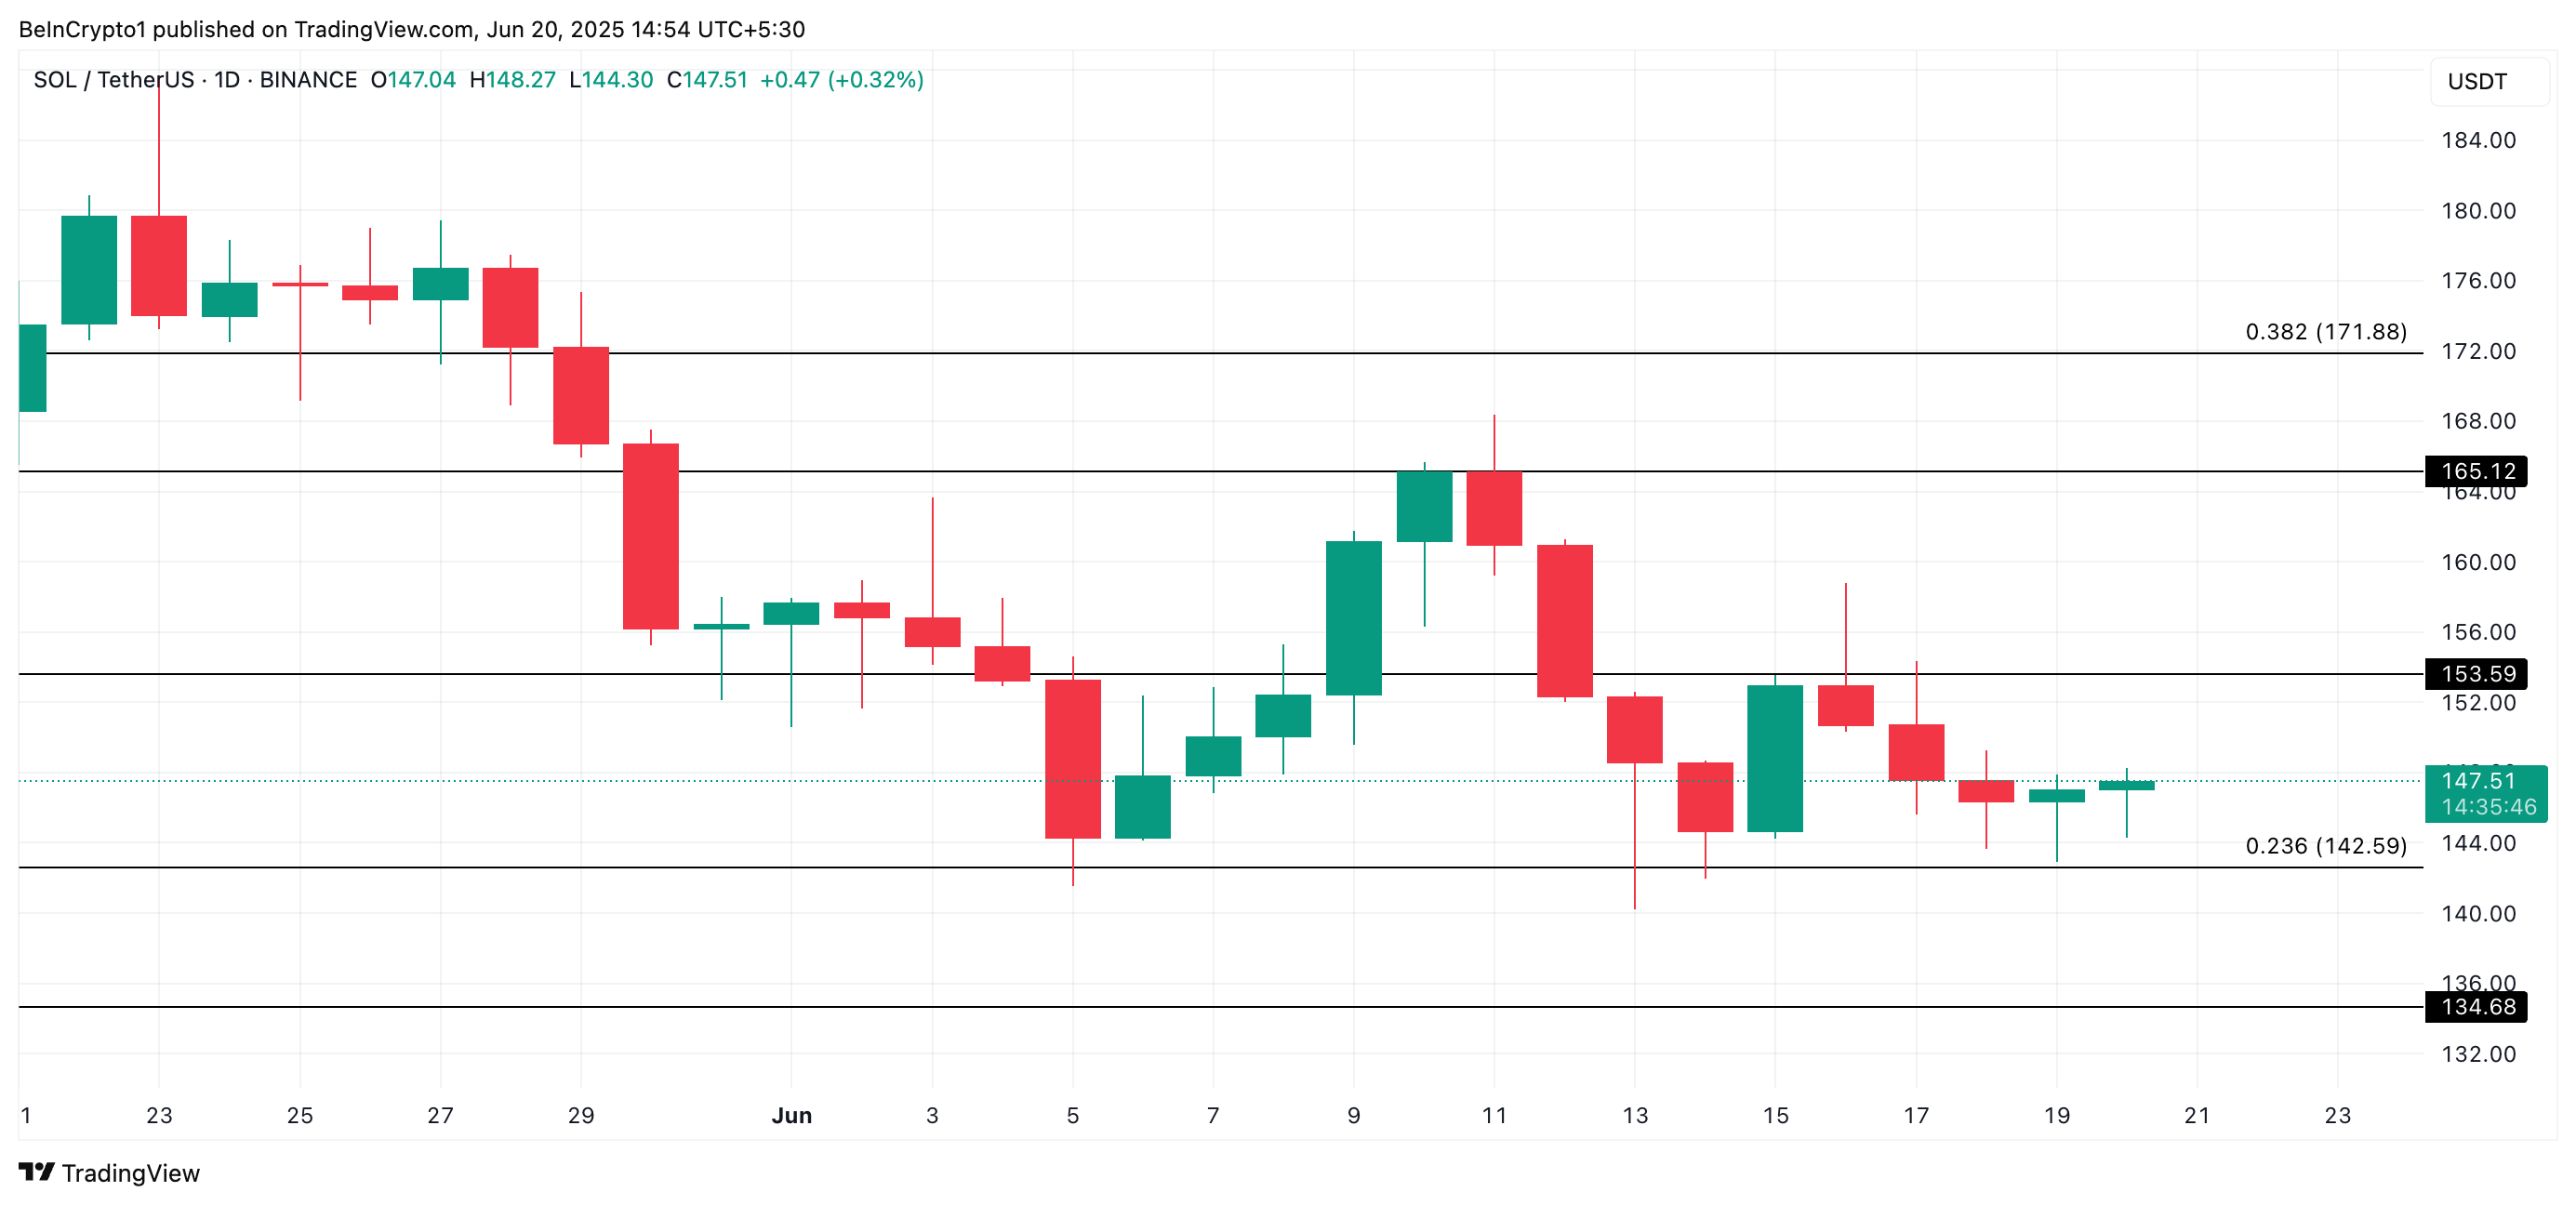
A breakdown below this level could open the door for a deeper correction in the SOL coin’s price toward $134.68 as Q2 draws to a close.

Log in to Reply
Log in to comment your thoughtsComments
Related Articles
|Square
Get the BTCC app to start your crypto journey
Get started today Scan to join our 100M+ users