Shiba Inu Hits 7-Day Low—Will Bulls Stage a Q2 Comeback?

Shiba Inu's price just nosedived to its lowest point in a week—right as Q2 races toward the finish line. Can the meme coin's loyalists pull off a last-minute rally, or is this another 'hold my beer' moment for crypto speculators?
The clock's ticking. With June 18 marking the home stretch of Q2, SHIB traders are either sweating or salivating. No new data? No problem. The chart tells the story: seven straight days of bleeding, and a community that treats 'buy the dip' like a religious mantra.
Here's the brutal truth: hope isn't a strategy. But in crypto-land, where 'fundamentals' are whatever Twitter says they are today, never underestimate the power of memes, FOMO, and Wall Street Bets refugees with too much leverage. Just ask the 'Shib Army'—they've turned 'irrational exuberance' into an art form.
SHIB Traders Brace for More Losses
On the technical front, momentum indicators suggest that the meme coin may face further losses in the short term. For example, the token’s BBTrend remains red on the daily chart, confirming that bearish forces are firmly in control.

The BBTrend measures the strength and direction of a trend based on the expansion and contraction of Bollinger Bands. When BBTrend values are positive, it typically signals a strong uptrend, while negative values indicate increasing bearish momentum.
Observed on the one-day chart, SHIB’s BBTrend indicator has posted red histogram bars that have gradually increased in size over the past 13 days. This signals strengthening sell-side pressure among the token’s spot traders.
Furthermore, the meme coin’s Elder-Ray Index supports this bearish outlook. At press time, the indicator is below zero at -0.0000011.
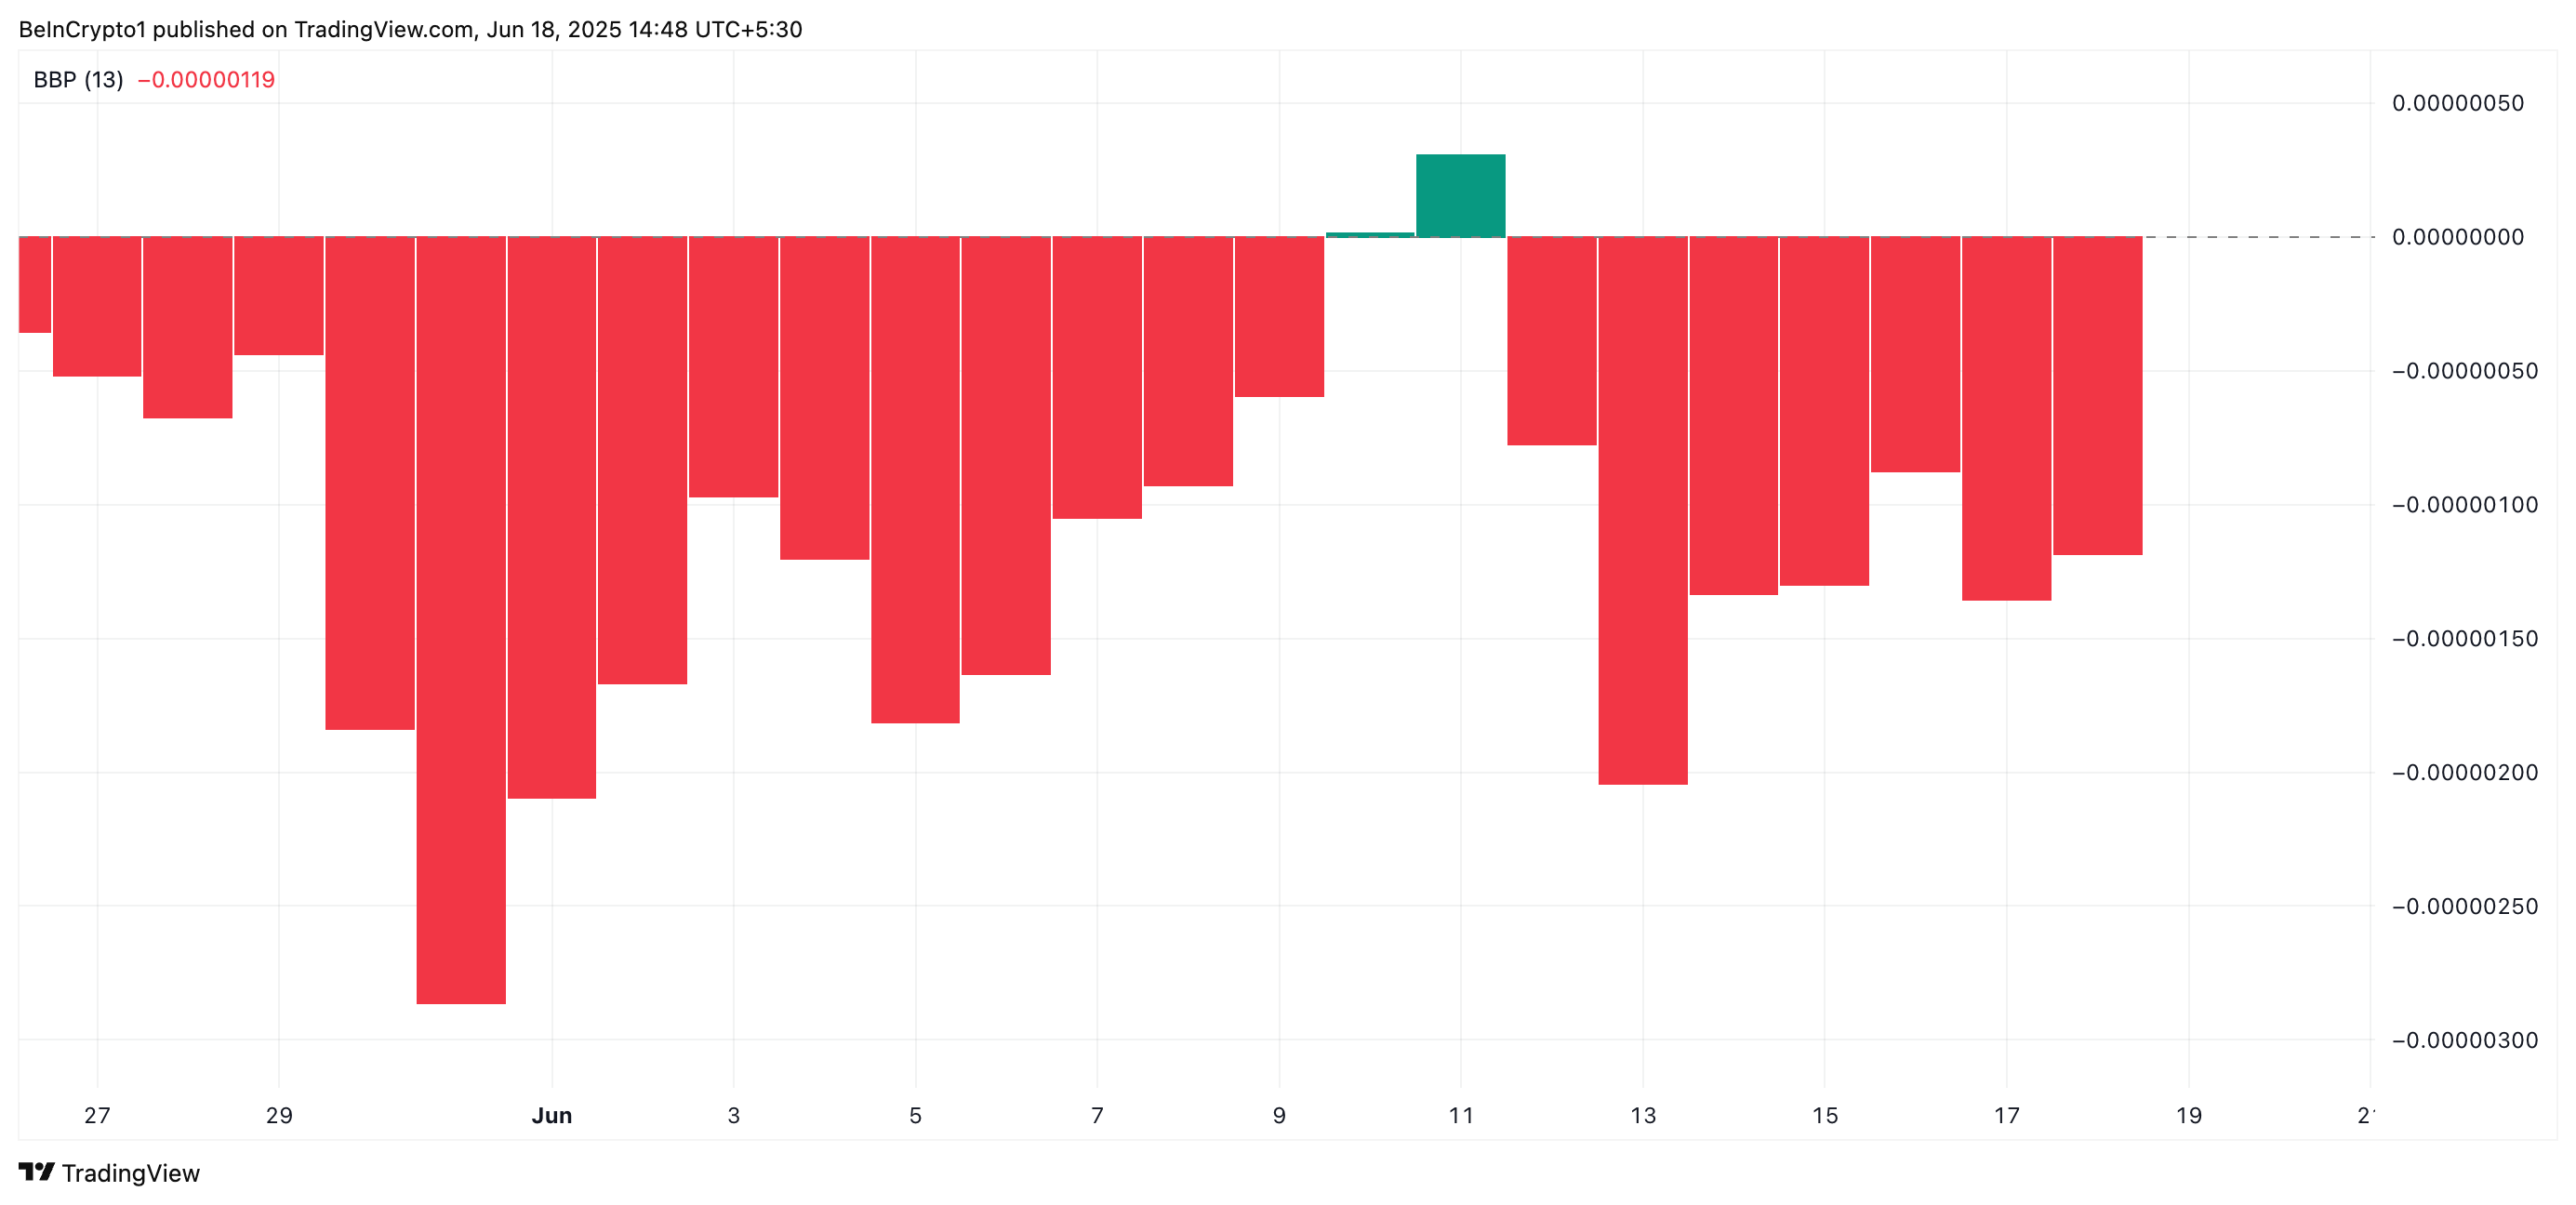
The Elder Ray Index measures the strength of buying and selling pressure in the market, using two key components: Bull Power and Bear Power. When the index is negative, sellers dominate the market. This confirms the bearish trend in the SHIB markets and hints at a continued downward momentum in the short term.
Can SHIB Hold the Line?
SHIB currently trades just above the key support level at $0.0000102, a price floor last tested in April. If bearish pressure intensifies, SHIB could retest this critical zone.
If the support level fails to hold, a further decline in market sentiment and weak demand may drive the token toward $0.00000939.

Conversely, if bullish momentum builds and buyer interest returns, the shiba inu token price could stage a recovery, with a potential upside target near $0.0000122.
