Solana Primed for Major Rebound as SOL Nears Golden Cross Breakout
Solana''s native token SOL is flashing bullish signals as it teeters on the verge of a golden cross formation—the technical indicator that''s crushed bears in every previous crypto cycle.
The 50-day MA is creeping toward the 200-day line like a predator stalking prey. When these trendlines kiss, history shows SOL could rocket past key resistance levels.
Traders are watching three critical price zones: the psychological $200 level, the 2024 swing high at $260, and of course the all-time peak at $267. Break these, and SOL''s runway clears for a potential 2x move.
Meanwhile, Ethereum maximalists are suddenly ''researching'' Solana''s throughput specs—funny how a potential 100% gain focuses the mind. The real question: Will this golden cross deliver golden returns, or just another fakeout for bagholders? Only price action tells the truth.
Solana Bulls Gradually Regain Control
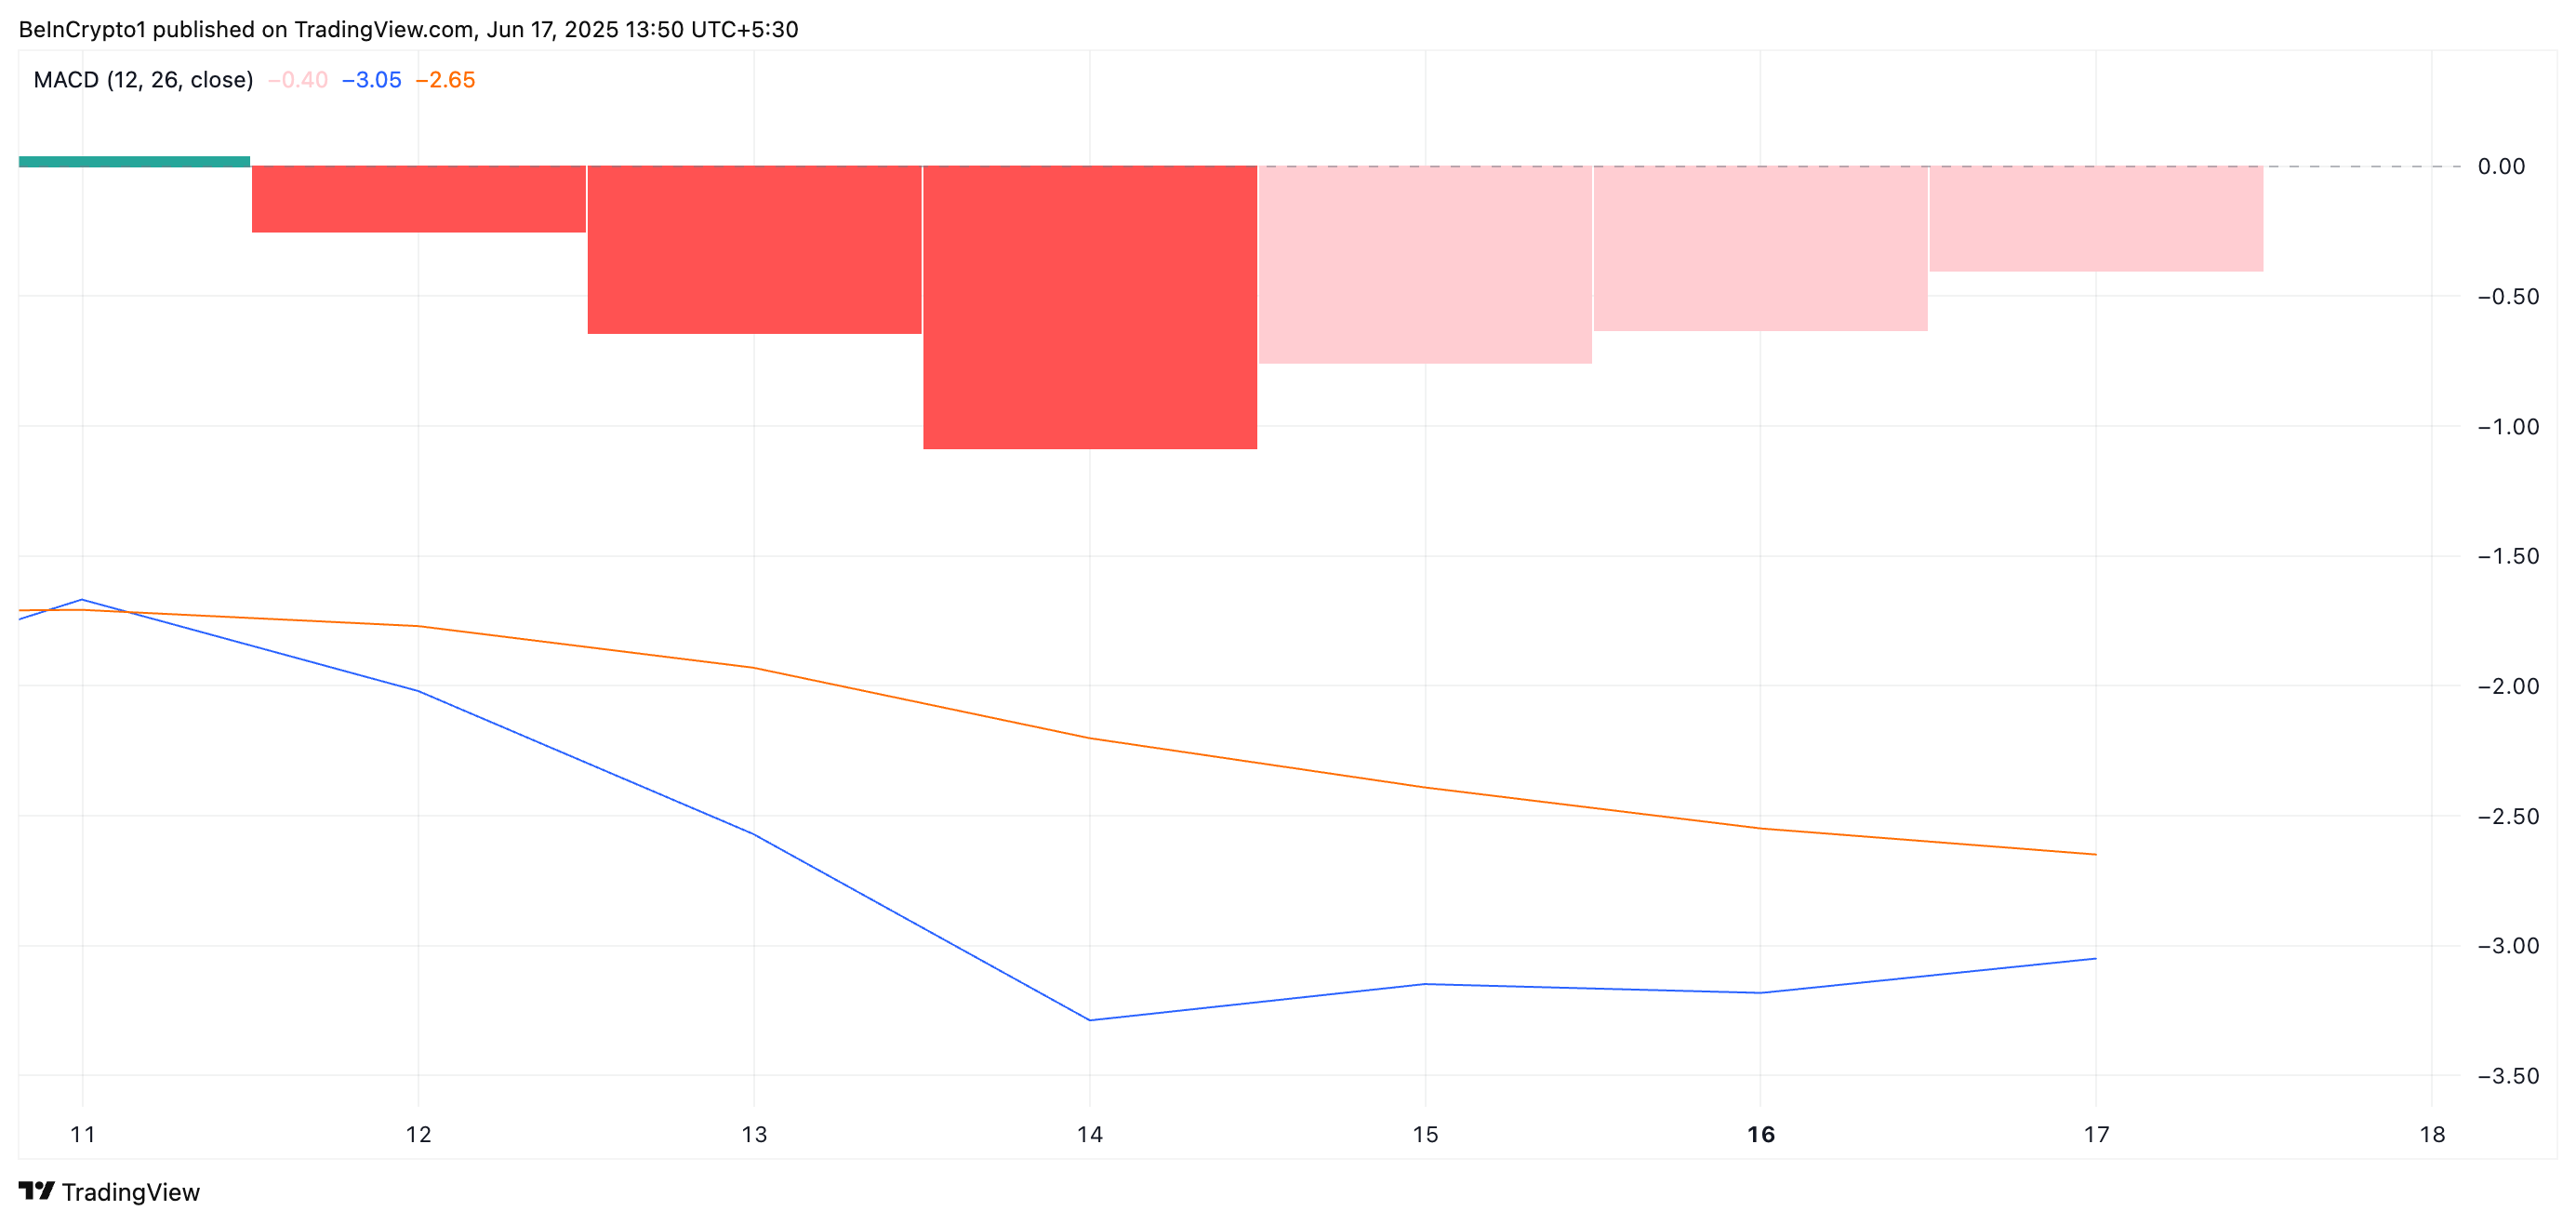
On the daily chart, SOL’s Moving Average Convergence Divergence (MACD) is on the verge of forming a golden cross, indicating a shift in market sentiment toward the upside. A golden cross emerges when an asset’s MACD line (blue) crosses above the signal line (orange), a setup widely regarded as a bullish momentum signal.

The MACD indicator identifies an asset’s trends and momentum in its price movement. It helps traders spot potential buy or sell signals through crossovers between the MACD and signal lines.
When the MACD line is above the signal line and a golden cross is formed, it confirms the bullish momentum in the market and suggests that the SOL’s price may continue to rise.
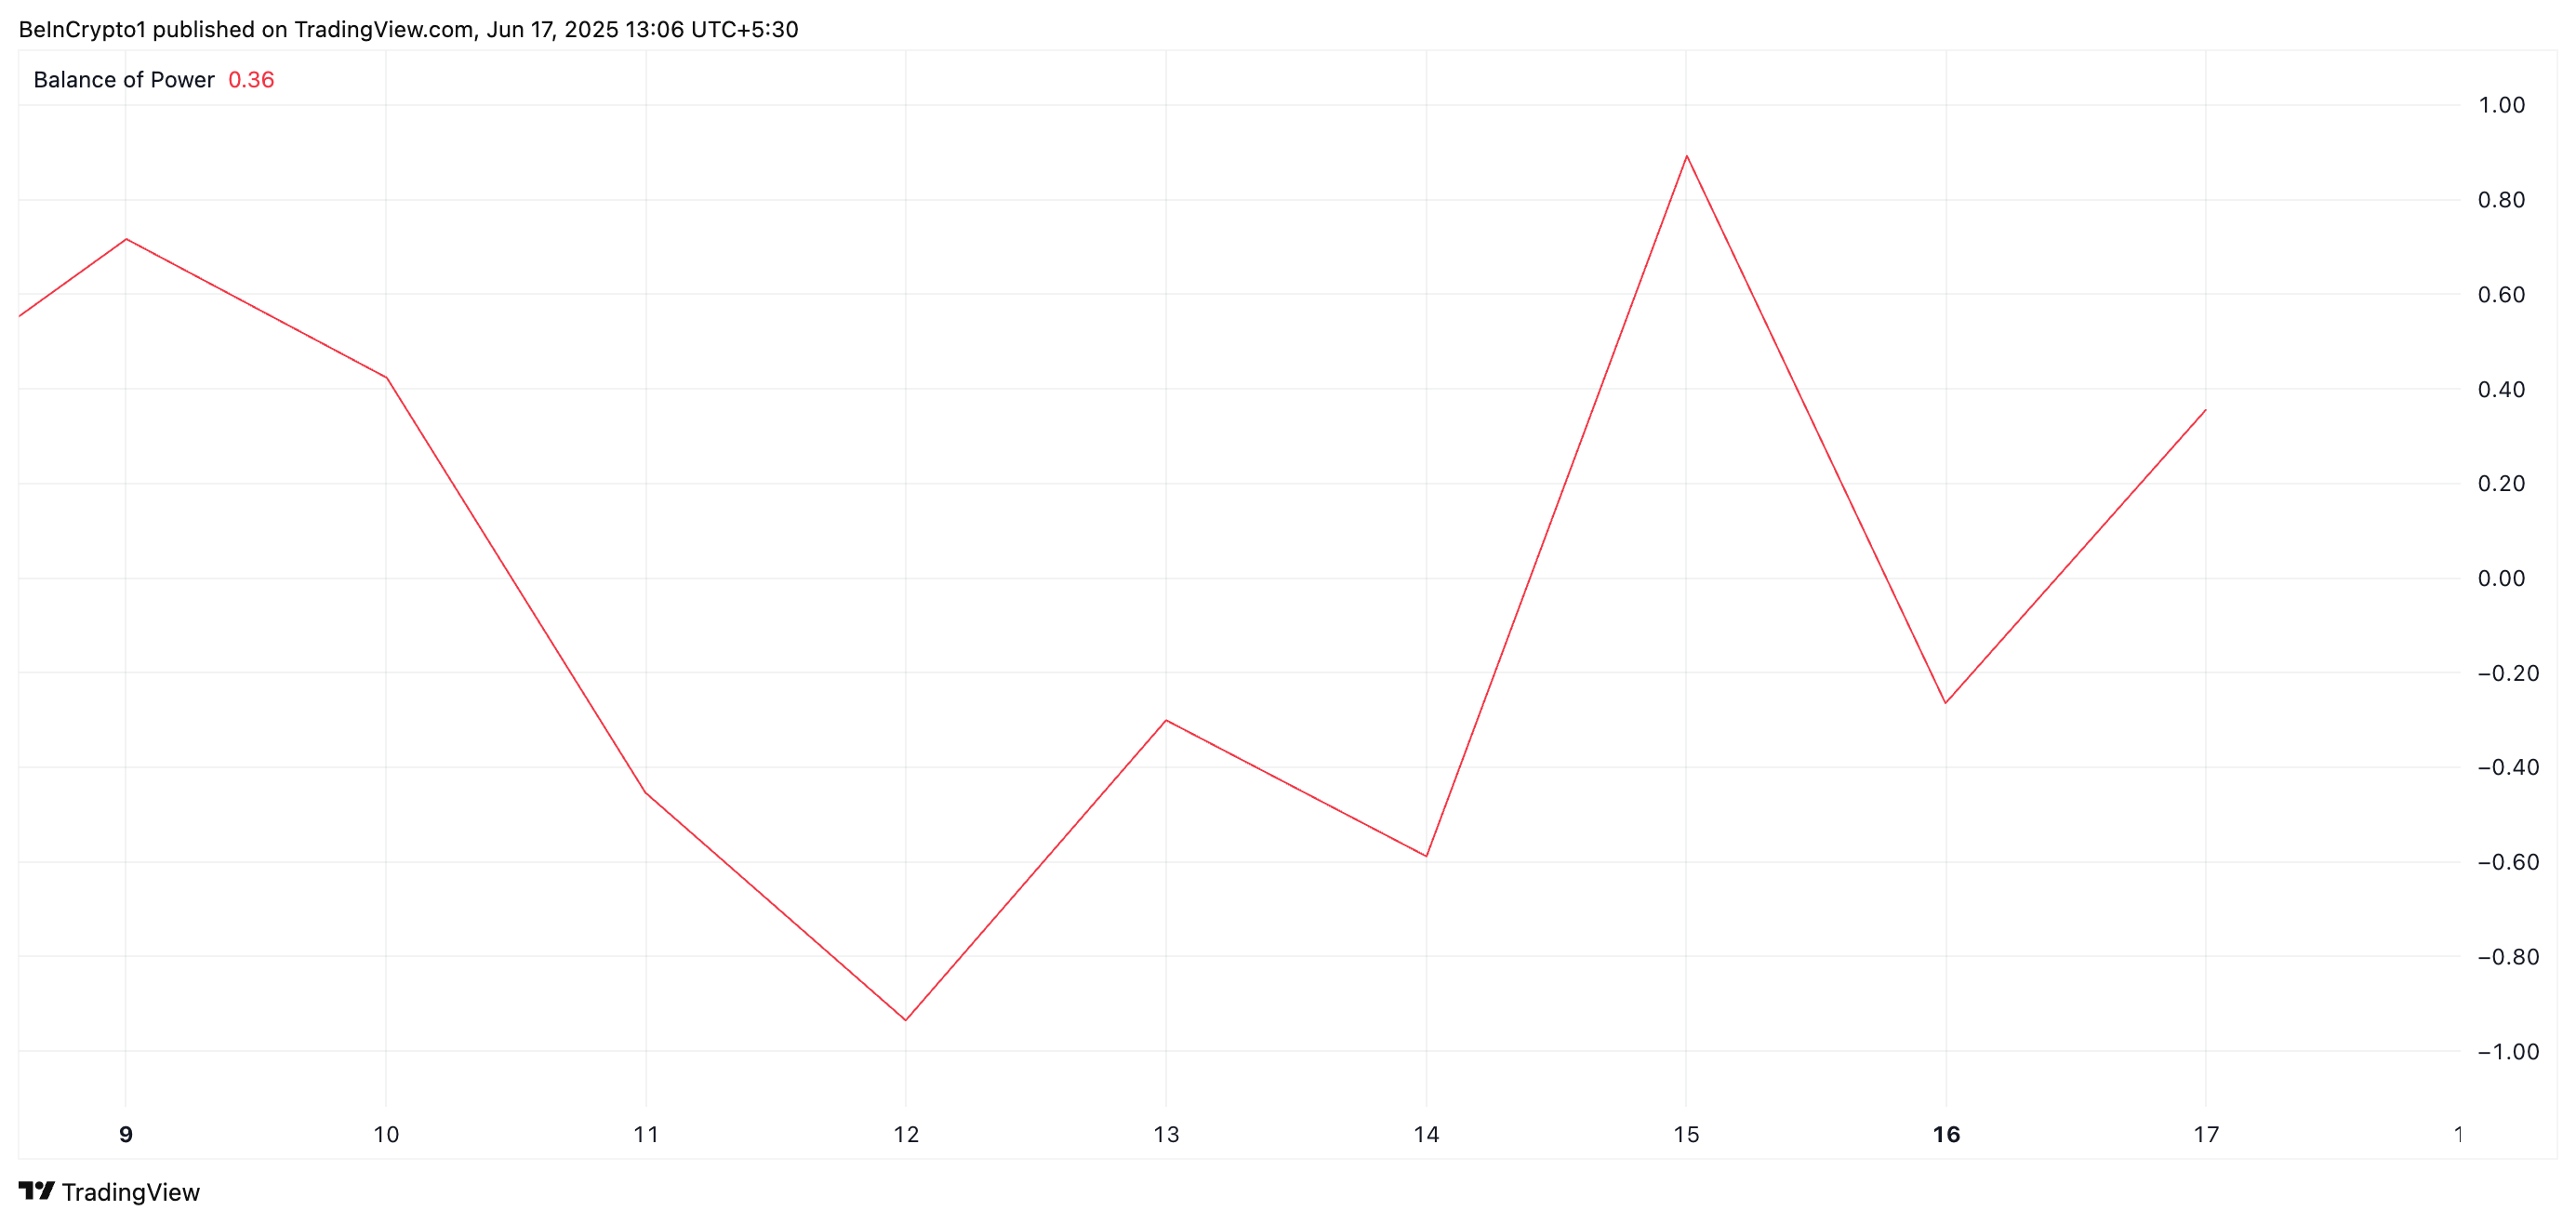
Adding to this bullish outlook, SOL’s Balance of Power (BoP) indicator is positive, reflecting a resurgence in buy-side strength. At press time, this is at 0.36.

The BOP indicator measures the strength of buyers versus sellers by comparing the price action within a trading session. When BOP is negative, it suggests that sellers are dominating the market, indicating bearish sentiment and downward price pressure.
Converesly, as with SOL, when the indicator’s value is positive, buyers are dominating the market. The increased demand suggests that bulls are regaining control after several days of downward pressure.
Solana Eyes Breakout Above $157—Will Bulls Deliver?
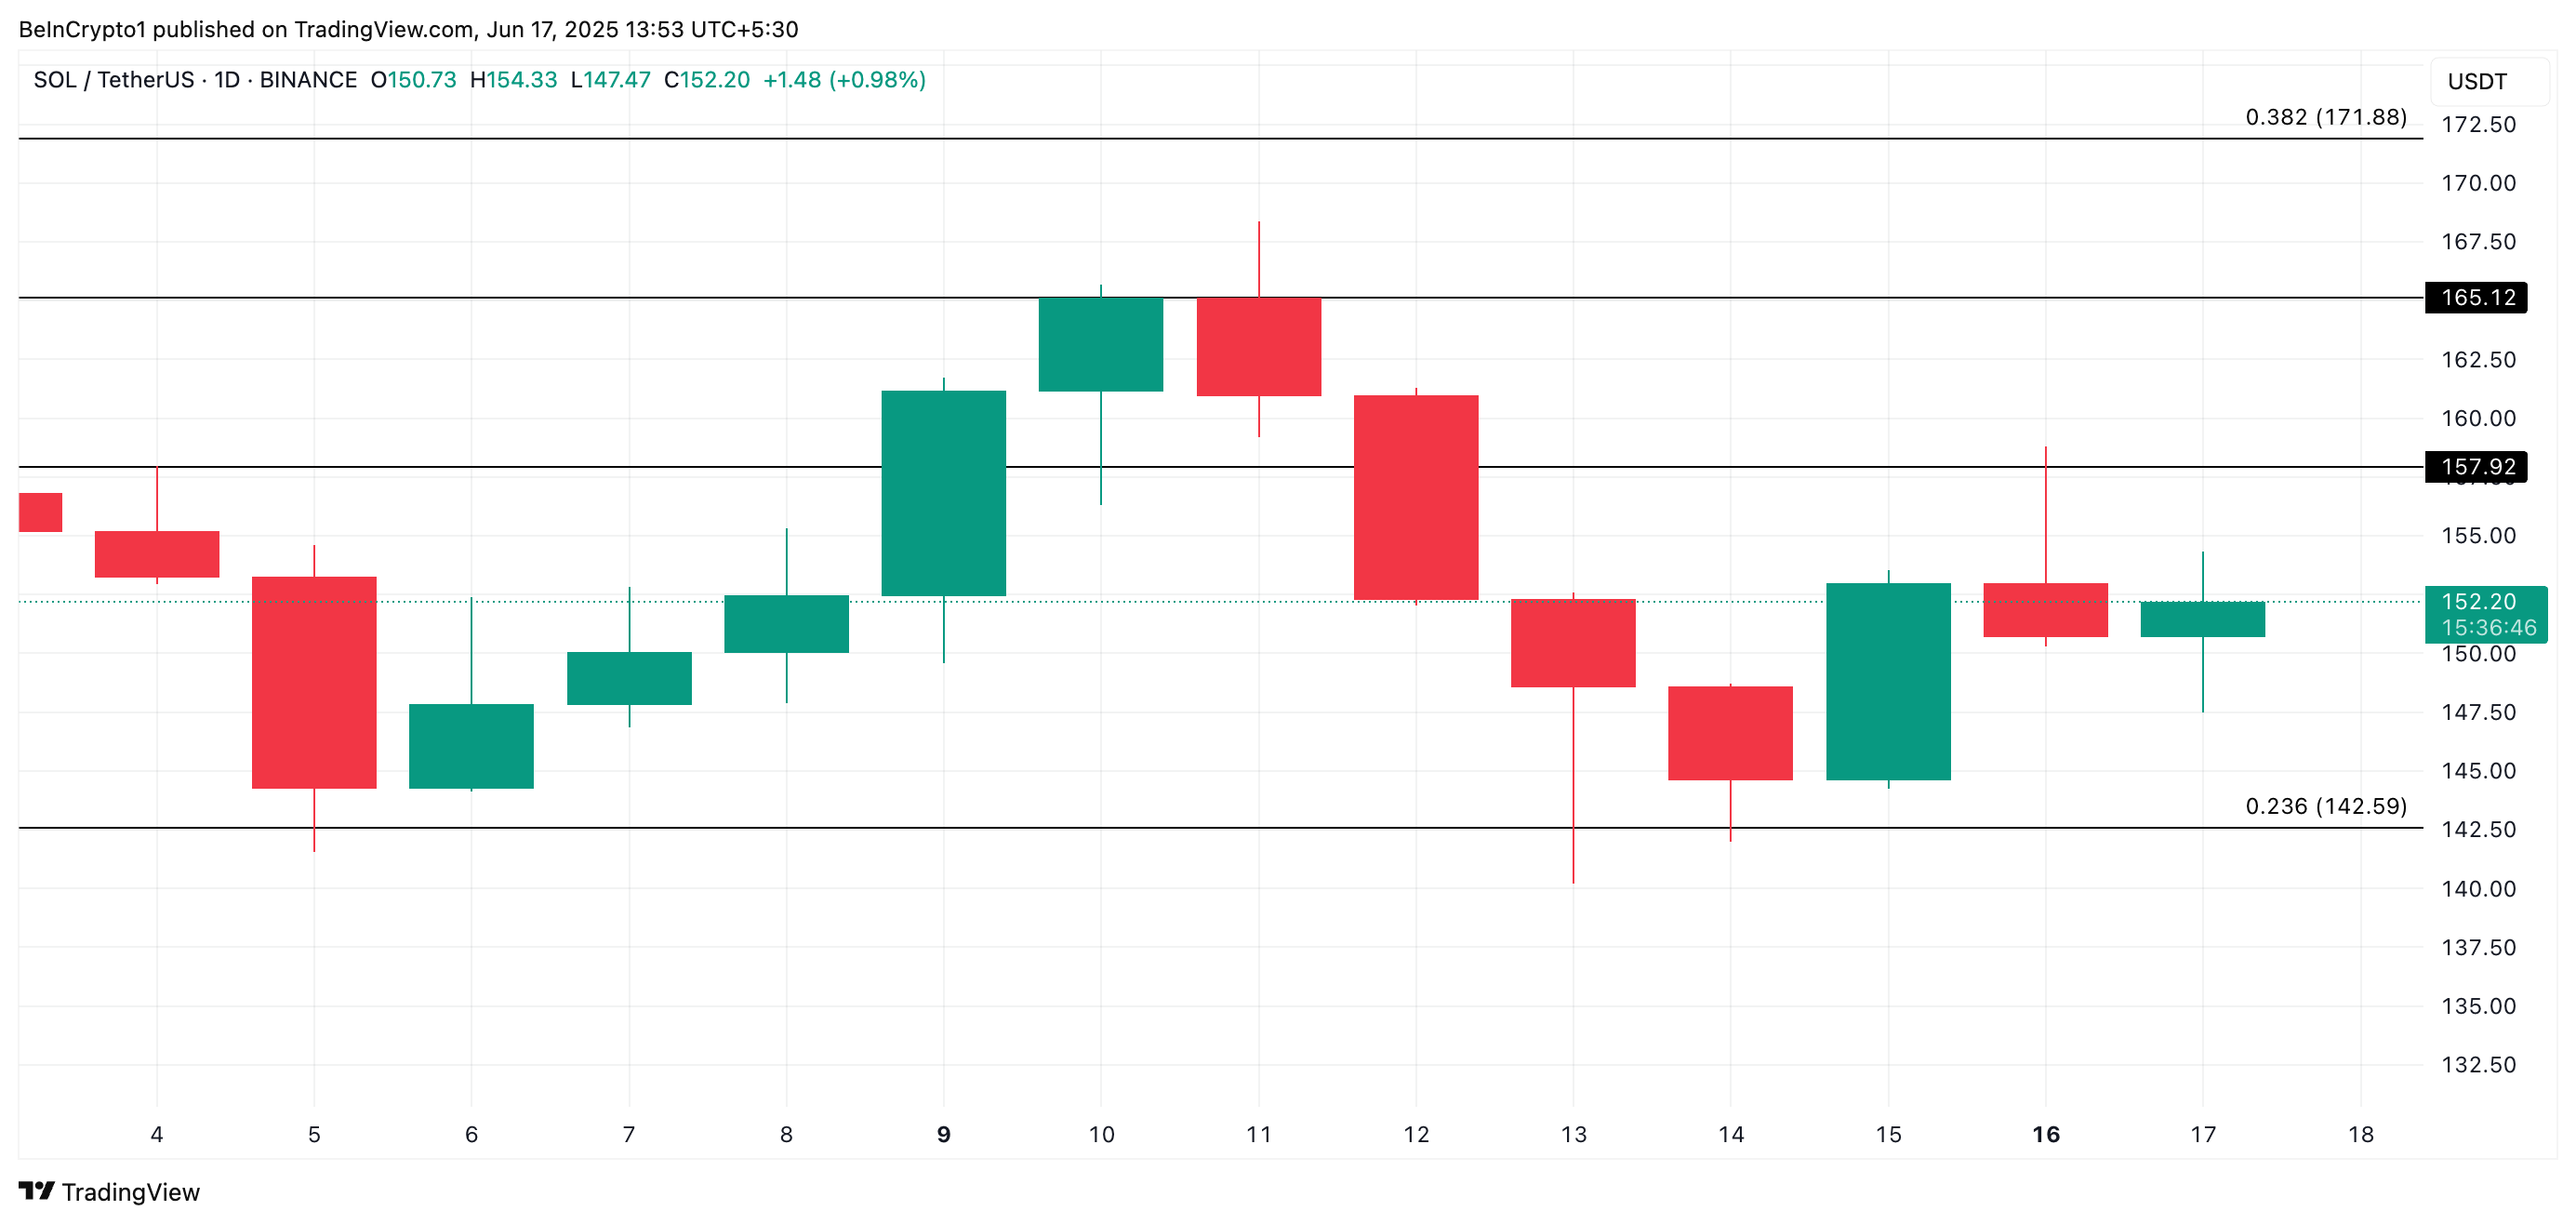
At press time, SOL trades at $152.20. If buying pressure continues to build, the altcoin could break above the immediate resistance at $157.92. A successful breach of this level may pave the way for a rally toward $165.12.

However, if demand weakens and profit-taking resumes, the solana coin price risks resuming its downward trajectory, falling to support around $142.59.

