Hedera (HBAR) Bulls Fight Back—But Bears Still Hold the Reins in 2025

Hedera''s recent rebound? Don''t pop the champagne yet. The bears are still lurking—and they''ve got the upper hand.
Price action might be green, but the charts whisper a darker story. HBAR''s recovery looks more like a dead cat bounce than a trend reversal. Shorts are stacking, resistance looms, and liquidity? Thin as a crypto influencer''s expertise.
Here''s why the smart money isn''t buying the hype... yet.
Technical trap: That ''recovery'' barely scratched the surface of last month''s nosedive. Until HBAR flips key levels, this is just another bull trap—fresh meat for the algorithmic wolves.
Market mood: Institutional money''s playing chess while retail traders eat crayons. The ''dumb money'' flow says it all.
Governing council updates? Enterprise adoption? Wake us up when it moves the needle. (Spoiler: it hasn''t.)
Bottom line: In crypto, hope isn''t a strategy—it''s what bagholders use as lube. HBAR needs more than vibes to break free.
Hedera Slides as BBTrend Turns Deeply Negative
Hedera is showing signs of weakening momentum as its BBTrend has sharply declined to -12.41, down from -0.83 just two days ago.
Earlier today, the indicator hit a low of -13.43 before slightly recovering, underscoring a potential intensification in bearish pressure.
This rapid shift suggests that HBAR is entering a stronger downtrend phase, with sellers increasingly dominating recent price action.
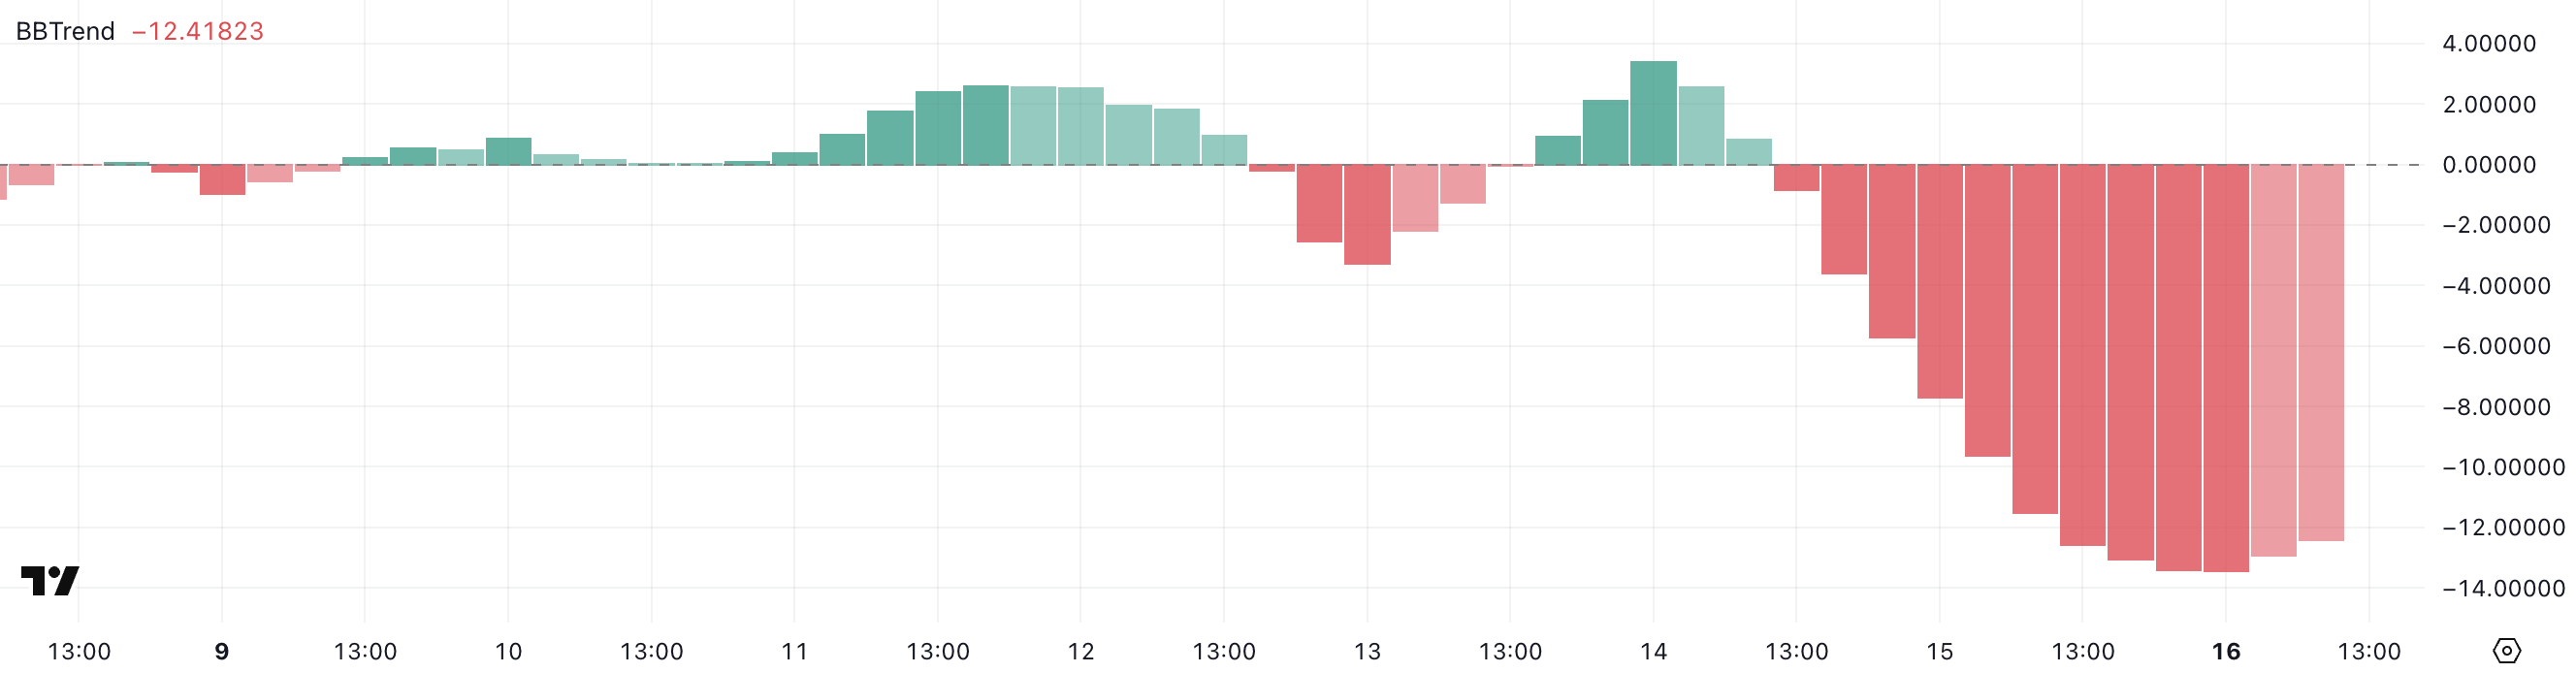
BBTrend, short for Bollinger Band Trend, is a technical indicator that measures the strength and direction of price movements based on the width and slope of the Bollinger Bands.
When the BBTrend turns deeply negative, it typically signals that the price is trending downward with increasing volatility. In the case of HBAR, the current BBTrend reading of -12.41 indicates that bearish momentum is gaining traction.
If this trend persists, it may lead to further price declines or at the very least, prolonged consolidation NEAR lower support levels.
HBAR Momentum Recovers as RSI Rebounds from Oversold Zone
Hedera is showing a notable shift in momentum as its Relative Strength Index (RSI) has climbed to 50.39, up significantly from 26.6 just two days ago.
This sharp rise suggests that buying interest has picked up, potentially marking the end of an oversold phase.
The recovery toward the neutral zone indicates a possible trend reversal or at least a pause in the recent selling pressure.

RSI is a momentum oscillator that measures the speed and change of price movements on a scale from 0 to 100. Readings below 30 generally indicate that an asset is oversold, while readings above 70 suggest it may be overbought.
With HBAR’s RSI now hovering around 50, the token is neither overbought nor oversold, signaling balance between buyers and sellers.
This level could act as a pivot point—either paving the way for a bullish breakout if upward momentum continues, or triggering renewed selling if resistance holds.
Hedera Faces Make-or-Break Moment Between $0.160 and $0.155
Hedera price remains under a bearish technical structure as its short-term Exponential Moving Averages (EMAs) continue to sit below the long-term ones.
This configuration typically signals downward pressure, but price action is now approaching a key resistance level at $0.160.

A confirmed breakout above this zone could open the door for a MOVE toward $0.175, with further upside potential to $0.183 and even $0.193 if bullish momentum strengthens.
However, if HBAR fails to sustain upward pressure and gets rejected near resistance, it may retest the immediate support at $0.155. A breakdown below this level could lead to a slide toward $0.150, reinforcing the existing bearish structure.
