Pi Network at a Crossroads: Will Key Support Spark a Rally or Collapse?

Pi Network''s price teeters on the edge—bulls and bats clash as a critical support level holds. Will this be the springboard for a rebound or the trapdoor to deeper losses?
Market watchers are split. Some see this as a classic accumulation zone before the next leg up. Others smell blood—another altcoin clinging to hope while Bitcoin steals the show.
One thing''s certain: in crypto, ''key support'' is just institutional jargon for ''last chance saloon.'' Place your bets.
Pi Network DMI Signals Fading Bearish Momentum
Pi Network’s Directional Movement Index (DMI) shows that its Average Directional Index (ADX) has dropped to 34, down from 44.59 just a day ago.
This decline follows a sharp rise from 16.89 three days ago, suggesting a recent but now weakening trend. The ADX measures the strength of a trend, regardless of direction.
Readings below 20 indicate a weak or no trend, while values above 25 signal a strong trend. With the ADX still above 30, PI is likely in a trending phase, but the momentum appears to be cooling off.
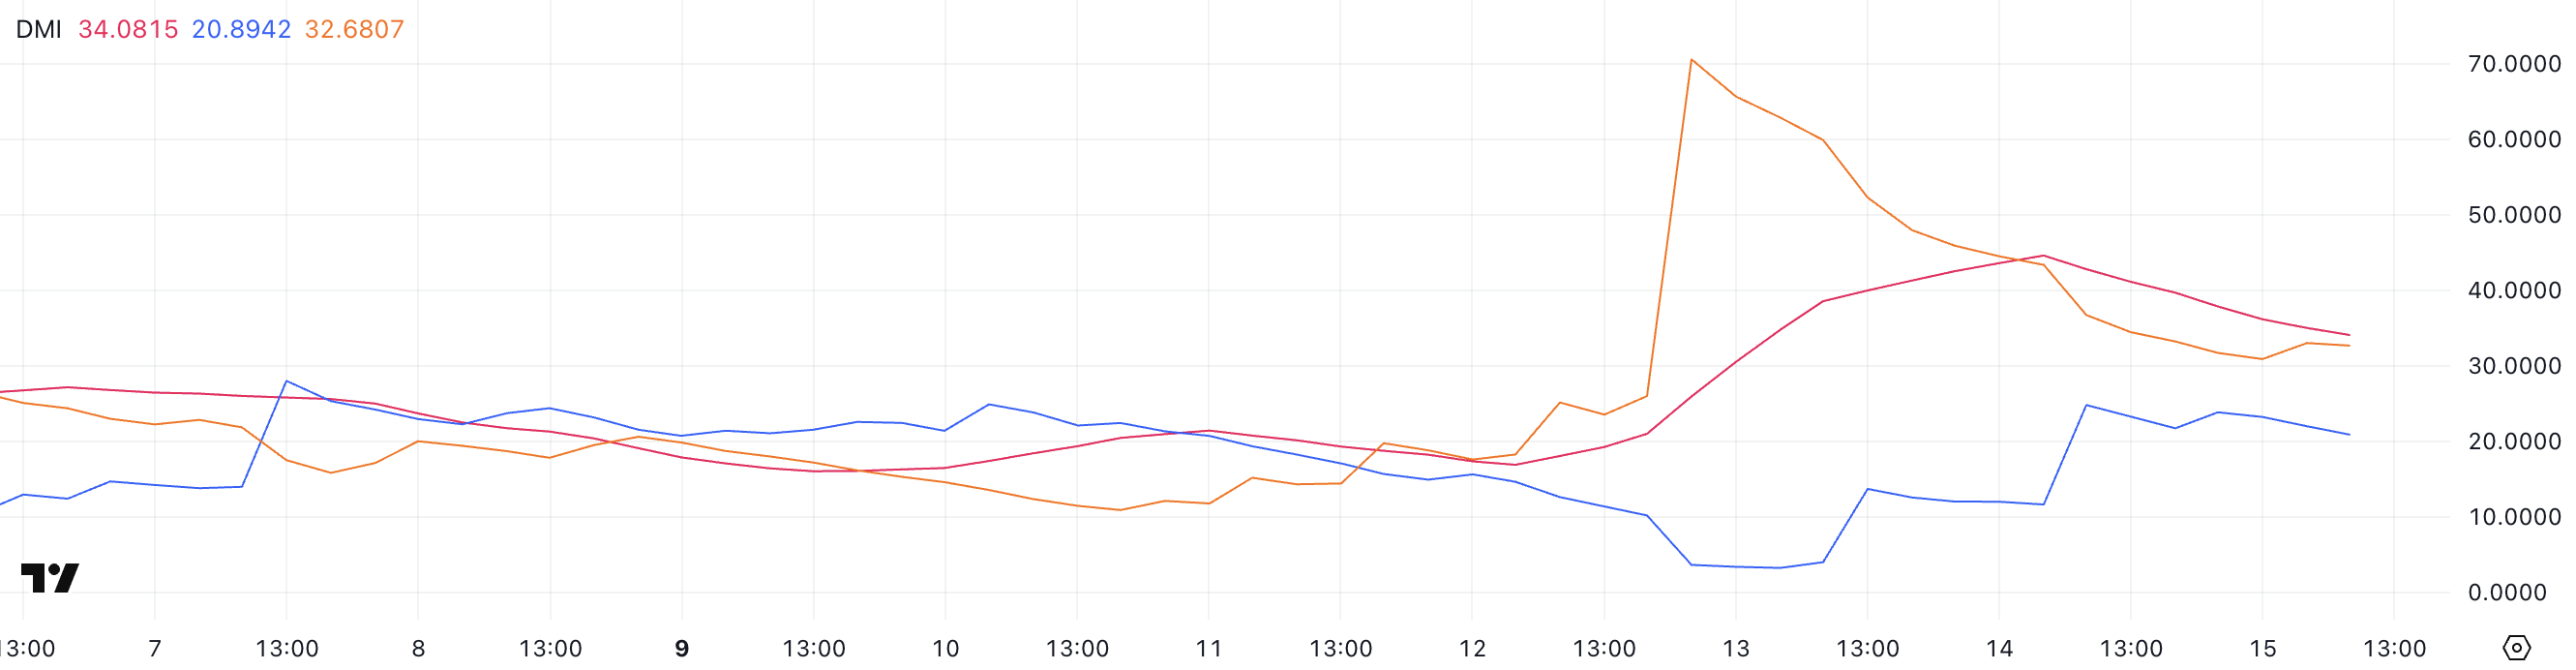
Looking at the directional indicators, +DI has climbed to 20.89 from just 4 two days ago, signaling growing bullish pressure.
Meanwhile, -DI has dropped significantly to 32.68 after peaking at 70.57 three days ago, showing that bearish momentum is fading.
This crossover in directional strength could hint at a potential shift in sentiment. If +DI continues to rise while -DI declines, Pi’s price may start recovering or enter a more neutral phase after a period of intense selling.
PI CMF Shows Light Buying Pressure After Recent Spike
Pi Network’s Chaikin Money FLOW (CMF) is currently at 0.07, down from 0.19 two days ago but still higher than -0.05 three days ago.
The CMF indicator measures the Flow of money into or out of an asset over time, using price and volume data. Values above 0 suggest buying pressure, while values below 0 indicate selling pressure.
Readings above 0.10 or below -0.10 are typically seen as stronger signals of accumulation or distribution.

PI’s current CMF level at 0.07 suggests mild but positive buying pressure.
While not strong enough to confirm aggressive accumulation, it shows that capital is still flowing into the asset, though less intensely than two days ago.
If CMF continues to hold above zero, it could support a stabilization or gradual recovery in price. However, if it dips back below zero, it may signal weakening demand and potential downside risk.
Breakout or Breakdown? PI Trades Near Crucial Levels
Pi Network’s EMA lines currently suggest a period of consolidation, following a recovery from the sharp drop triggered by the Israel-Iran conflict escalation.
Price action is hovering just above a key support at $0.601. If this level is broken, Pi Price could drop to $0.542, and if bearish momentum builds, it might fall further toward $0.40.
This structure reflects uncertainty, with no clear bullish or bearish control at the moment.

On the upside, if PI manages to break through the resistance levels at $0.647 and $0.658, it could trigger a new uptrend.
A successful breakout above these zones might open the door for a MOVE toward $0.796.
The EMA setup supports a neutral stance for now, awaiting a decisive move in either direction.
